
The Economy of Qatar is one of the highest in the world based on GDP per capita, ranking generally among the top ten richest countries on world rankings for 2015 and 2016 data compiled by the World Bank, the United Nations, and the International Monetary Fund (IMF). The country's economy has grown despite sanctions by its neighbors, Saudi Arabia and the United Arab Emirates. Mainly because the country exports primarily to Japan, South Korea, India and China, making the sanctions effectively redundant as neither Saudi Arabia nor the United Arab Emirates have imposed trading penalties such as tariffs or embargoes on any of these countries for trading with Qatar, or offering incentives such as discounts for their own energy exports to reduce Qatari exports.
The gross world product (GWP), also known as gross world income (GWI), is the combined gross national income of all the countries in the world. Because imports and exports balance exactly when considering the whole world, this also equals the total global gross domestic product (GDP). According to the World Bank, the 2013 nominal GWP was approximately 75.59 trillion United States dollars. In 2017, according to the CIA's World Factbook, the GWP was around $80.27 trillion in nominal terms and totaled approximately 127.8 trillion international dollars in terms of purchasing power parity (PPP). The per capita PPP GWP in 2017 was approximately 17,500 international dollars according to the World Factbook. According to the World Bank, the 2020 GWP in current dollars was approximately $84.705 trillion.

The Cooperation Council for the Arab States of the Gulf, also known as the Gulf Cooperation Council, is a regional, intergovernmental, political, and economic union comprising Bahrain, Kuwait, Oman, Qatar, Saudi Arabia, and the United Arab Emirates. The council's main headquarters is located in Riyadh, the capital of Saudi Arabia. The Charter of the GCC was signed on 25 May 1981, formally establishing the institution.

The world economy or global economy is the economy of all humans in the world, referring to the global economic system, which includes all economic activities conducted both within and between nations, including production, consumption, economic management, work in general, financial transactions and trade of goods and services. In some contexts, the two terms are distinct: the "international" or "global economy" is measured separately and distinguished from national economies, while the "world economy" is simply an aggregate of the separate countries' measurements. Beyond the minimum standard concerning value in production, use and exchange, the definitions, representations, models and valuations of the world economy vary widely. It is inseparable from the geography and ecology of planet Earth.

The economy of Asia comprises about 4.7 billion people living in 50 different nations. Asia is the fastest growing economic region, as well as the largest continental economy by both GDP Nominal and PPP in the world. Moreover, Asia is the site of some of the world's longest modern economic booms.
An emerging market is a market that has some characteristics of a developed market, but does not fully meet its standards. This includes markets that may become developed markets in the future or were in the past. The term "frontier market" is used for developing countries with smaller, riskier, or more illiquid capital markets than "emerging". As of 2006, the economies of China and India are considered to be the largest emerging markets. According to The Economist, many people find the term outdated, but no new term has gained traction. Emerging market hedge fund capital reached a record new level in the first quarter of 2011 of $121 billion. Emerging market economies’ share of global PPP-adjusted GDP has risen from 27 percent in 1960 to around 53 percent by 2013. The ten largest emerging economies by nominal GDP are 4 of the 9 BRICS countries along with Mexico, South Korea, Indonesia, Turkey, Saudi Arabia, and Poland. The inclusion of South Korea, Poland, and sometimes Taiwan are questionable given they are no longer considered emerging markets by the IMF and World Bank If we ignore those three, the top ten would include Argentina and Thailand.

The economy of the Middle East is very diverse, with national economies ranging from hydrocarbon-exporting rentiers to centralized socialist economies and free-market economies. The region is best known for oil production and export, which significantly impacts the entire region through the wealth it generates and through labor utilization. In recent years, many of the countries in the region have undertaken efforts to diversify their economies.
The economy of the Organisation of Islamic Cooperation (OIC) combines the economies of 56* member states. 49* are predominantly Muslim states. As of 2013, the combined GDP (nominal) of 48* Muslim majority countries was US$ 12.97 trillion. As of 2016, they contributed 8% of the world's total. Those 57* OIC countries have a combined GDP of US$ 23.948trillion. The largest economic country based on total PPP and Nominal GDP is Indonesia. The richest country on the basis of GDP per capita at PPP is Qatar, with incomes exceeding $133,357 per capita. On the basis of per capita GDP, Qatar is also the richest country, with incomes exceeding US$68,977 per capita. According to a report by Salam Standard, the GDP impact of the world’s Muslim tourism sector exceeded $138 billion in 2015, generating 4.3 million jobs and contributing more than $18 billion in tax revenue.
The Trillion dollar club is an unofficial classification of the world's major economies with a gross domestic product of more than US$1 trillion per year. As of 2023, it included 19 countries. This does not include purchasing power parity, which increases the GDP of many countries with an undervalued currency, which are usually poorer countries.

The economy of Beijing ranks among the most developed and prosperous cities in China. In 2013, the municipality's nominal gross domestic product (GDP) was CN¥1.95 trillion. It was about 3.43% of the country's total output, and ranked 13th among province-level administrative units. Per capita GDP, at CN¥93,213 (US$15,051) in nominal terms and Int $21,948 at purchasing power parity, was 2.2 times the national average and ranked second among province-level administrative units.
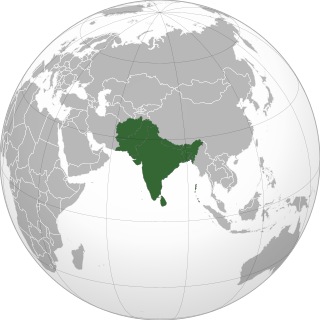
The economy of South Asia comprises 2 billion people living in eight countries. The Indian subcontinent was historically one of the richest regions in the world, comprising 25% of world GDP as recently as 1700, but experienced significant de-industrialisation and a doubling of extreme poverty during the colonial era of the late 18th to mid-20th century. In the post-colonial era, South Asia has grown significantly, with India advancing because of economic liberalisation from the 1980s onwards, and extreme poverty now below 15% in the region. South Asia has been the fastest-growing region of the world since 2014.


