List of Arab League countries by GDP (nominal)

Last updated

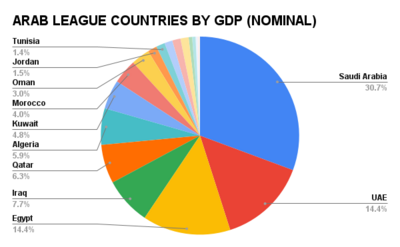
This article lists the countries of the Arab League sorted by their gross domestic product (GDP) at nominal values. GDP is the value of all final goods and services produced within a nation in a given year. The table below shows the nominal GDP and GDP per capita for the 23* Majority Countries and Half Country of “Arab League members”* and Seven* Observers” Only in 2023. The figures shown are estimates compiled by the International Monetary Fund's World Economic Outlook [1]

Contents

Pie chart showing show share of nominal (GDP) of Arab League member countries ARAB LEAGUE COUNTRIES BY GDP (NOMINAL).png
Pie chart showing show share of nominal (GDP) of Arab League member countries

List

RankCountry/Territory2023 GDP (US$ billion) [1] 2023 GDP per capita (US$) [2]
Flag of the United Nations.svg World 119,476,43213,330
Flag of the Arab League.svg  Arab World 3,467 (2013) [1] [n 1] 7,590 (2014) [3]
01.Flag of Saudi Arabia.svg  Saudi Arabia 1,069.4432,586
02.Flag of the United Arab Emirates.svg  UAE 509.17950,602
03.Flag of Egypt.svg  Egypt 398.3973,770
04.Flag of Iraq.svg  Iraq 254.9935,883
05.Flag of Qatar.svg  Qatar 235.581,968
06.Flag of Algeria.svg  Algeria 224.1075,104
07.Flag of Kuwait.svg  Kuwait 159.68732,215
08.Flag of Morocco.svg  Morocco 147.3433,979
09.Flag of Oman.svg  Oman 108.28221,265
10.Flag of Syria.svg  Syria 60.043 (2013) [4] 2,806 (2017)
11.Flag of Tunisia.svg  Tunisia 51.2714,190
12.Flag of Jordan.svg  Jordan 50.0224,850
13.Flag of Bahrain.svg  Bahrain 44.99428,464
14.Flag of Libya.svg  Libya 40.1945,872)
15.Flag of Sudan.svg  Sudan 25.569533.845(“19)
16.Flag of Lebanon.svg  Lebanon 21.78 (“21) [4] 3,283 (2023)
17.Flag of Yemen.svg  Yemen 21.045617 (“24”)
18.Flag of Palestine.svg  Palestine 18.109(2021’) [4] 3,464 (2021)
19.Flag of Mauritania.svg  Mauritania 10.3572,337 (“24”)

See also

Notes

  1. The sum of all GDP figures below.

Related Research Articles

<span class="mw-page-title-main">Financial and social rankings of sovereign states in Europe</span> Overview of financial and social rankings of the sovereign states in Europe

This page compares the sovereign states of Europe on economic, financial and social indicators.

The economy of the Arab League is the economy of the member states of the Arab League. The economy has traditionally been dependent on exports of oil and natural gas; however, the tourism sector has grown rapidly, becoming the fastest-growing sector in the region. The Greater Arab Free Trade Area, founded in 1997, is the league's free trade area which removed customs taxes on 65% of trade between counties in the Arab World.

References

  1. 1 2 3 "Report for Selected Countries and Subjects". IMF. Retrieved 12 October 2023.
  2. "Report for Selected Countries and Subjects". IMF. Retrieved 12 October 2023.
  3. "Report for Selected Countries and Subjects". IMF. Retrieved 12 October 2023.
  4. 1 2 3 "Report for Selected Countries and Subjects". IMF. Retrieved 12 October 2023.