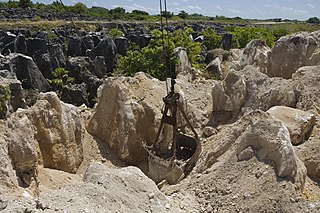
The economy of Nauru is tiny, based on a population in 2019 of only 11,550 people. The economy has historically been based on phosphate mining. With primary phosphate reserves exhausted by the end of the 2010s, Nauru has sought to diversify its sources of income. In 2020, Nauru's main sources of income were the sale of fishing rights in Nauru's territorial waters, and revenue from the Regional Processing Centre.

Tuvalu is a Polynesian island nation located in the Pacific Ocean, midway between Hawaii and Australia, with a population of 11,192 per the 2017 census. The economy of Tuvalu is constrained by its remoteness and lack of economies of scale. Government revenues largely come from fishing licences ; direct grants from international donors ; and income from the Tuvalu Trust Fund. The lease of its highly fortuitous .tv Top Level Domain (TLD) also contributes revenue. The sale of stamps since the independence of Tuvalu in 1976 has been an important source of revenue for the country and government. However, such revenue has significantly declined in recent years. Tuvalu has hardly any tourism. It has no tour guides, tour operators or organised activities and no cruise ships visit.
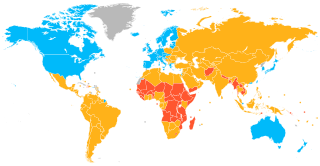
A developed country, or high-income country, is a sovereign state that has a high quality of life, developed economy, and advanced technological infrastructure relative to other less industrialized nations. Most commonly, the criteria for evaluating the degree of economic development are the gross domestic product (GDP), gross national product (GNP), the per capita income, level of industrialization, amount of widespread infrastructure and general standard of living. Which criteria are to be used and which countries can be classified as being developed are subjects of debate. Different definitions of developed countries are provided by the International Monetary Fund and the World Bank; moreover, HDI ranking is used to reflect the composite index of life expectancy, education, and income per capita. Another commonly used measure of a developed country is the threshold of GDP (PPP) per capita of at least US$22,000. In 2023, 40 countries fit all four criteria, while an additional 15 countries fit three out of four.

The economy of Europe comprises about 748 million people in 50 countries. The formation of the European Union (EU) and in 1999 the introduction of a unified currency, the Euro, brought participating European countries closer through the convenience of a shared currency. The European Union is a unique global organisation, an entity forming one of the largest economies in the world. The European Union also “regulates” the global market by the single market. The difference in wealth across Europe can be seen roughly in the former Cold War divide, with some countries breaching the divide. Whilst most European states have a GDP per capita higher than the world's average and are very highly developed, some European economies, despite their position over the world's average in the Human Development Index, are relatively poor. Europe has total banking assets of more than $50 trillion and its Global assets under management has more than $20 trillion.
The Republic of Kiribati's per capita Gross National Product of US$1,420 (2010) makes it the poorest country in Oceania. Phosphates had been profitably exported from Banaba Island since the turn of the 20th century, but the deposits were exhausted in 1979. The economy now depends on foreign assistance and revenue from fishing licenses to finance its imports and development budget.
This page is based on this
Wikipedia article Text is available under the
CC BY-SA 4.0 license; additional terms may apply.
Images, videos and audio are available under their respective licenses.
 American Samoa (US)
 British Indian Ocean Territory (UK)
 Christmas Island (Australia)
 Cocos (Keeling) Islands (Australia)
 Cook Islands (New Zealand)
 French Polynesia (France)
 Guam (US)
 New Caledonia (France)
 Niue (New Zealand)
 Norfolk Island (Australia)
 Northern Mariana Islands (US)
 North Korea
  Pitcairn Islands (UK)
 Tokelau (New Zealand)
 Wallis and Futuna (France)