< 3,000 US$
3,000 - < 4,000 US$
4,000 - < 5,000 US$
5,000 - < 7,000 US$
7,000 - < 10,000 US$
10,000 - < 15,000 US$
> 15,000 US$
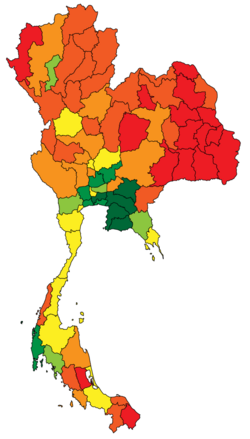
This is a list of Thai provinces and regions by GDP and GDP per capita as of 2019, based on Gross Regional and Provincial Product Chain Volume Measures 2019 Edition, According to Office of the National Economic and Social Development Council (NESDC). [1]
Data for 2019 estimates (US$ at 2019 average market exchange rate, [2] international $ (I$) using 2019 PPP conversion factor from World Bank [3] )
| ID | Province | Population (millions) | GPP (billions ฿) | % of national GDP | GPP (billions US$ nominal) | GPP (billions I$ PPP) | GPP per capita (฿) | GPP per capita (US$ nominal) | GPP per capita (I$ PPP) |
|---|---|---|---|---|---|---|---|---|---|
| 0000 | 69.315 | 15,451.96 | 100.00 | 545.00 | 1,342.20 | 228,398 | 7,864 | 19,276 | |
| 0700 | Bangkok Metropolitan Region | 16.932 | 7,167.11 | 47.50 | 258.90 | 647.25 | 449,881 | 15,800 | 44,240 |
| 0701 | Bangkok | 8.912 | 5,022.02 | 31.88 | 173.76 | 434.4 | 573,907 | 19,749 | 55,297 |
| 0702 | Samut Prakan | 2.171 | 717.05 | 4.71 | 25.69 | 64.22 | 343,215 | 12,176 | 34,092 |
| 0703 | Pathum Thani | 1.729 | 380.69 | 2.39 | 13.02 | 32.55 | 254,627 | 8,039 | 22,509 |
| 0704 | Samut Sakhon | 1.042 | 398.10 | 2.40 | 13.10 | 32.75 | 411,326 | 12,914 | 36,159 |
| 0705 | Nakhon Pathom | 1.186 | 332.63 | 2.06 | 11.26 | 28.15 | 308,167 | 10,074 | 28,207 |
| 0706 | Nonthaburi | 1.722 | 316.63 | 1.92 | 10.49 | 26.22 | 204,404 | 6,513 | 18,236 |
| 0600 | Central Thailand | 3.176 | 838.31 | 6.12 | 27.80 | 69.55 | 267,162 | 9,045 | 25,326 |
| 0601 | Saraburi | 0.758 | 236.64 | 1.45 | 7.93 | 18.82 | 330,750 | 10,844 | 30,363 |
| 0602 | Sing Buri | 0.190 | 26.50 | 0.16 | 0.89 | 2.22 | 129,095 | 5,146 | 14,409 |
| 0603 | Chainat | 0.314 | 31.85 | 0.20 | 1.13 | 2.89 | 101,282 | 4,316 | 12,089 |
| 0604 | Ang Thong | 0.259 | 27.79 | 0.18 | 0.99 | 2.47 | 107,129 | 4,390 | 12,292 |
| 0605 | Lopburi | 0.777 | 111.92 | 0.66 | 3.58 | 8.98 | 144,041 | 5,045 | 14,126 |
| 0606 | Phra Nakhon Si Ayutthaya | 0.907 | 403.60 | 2.38 | 13.31 | 33.27 | 465,972 | 14,988 | 41,966 |
| 0400 | Eastern Thailand | 6.056 | 2,857.30 | 18.02 | 98.20 | 245.50 | 500,676 | 16,749 | 46,897 |
| 0401 | Chonburi | 1.819 | 976.46 | 6.10 | 33.25 | 83..12 | 581,475 | 18,550 | 51,940 |
| 0402 | Chachoengsao | 0.823 | 341.12 | 2.29 | 12.47 | 31.17 | 427,409 | 15,453 | 43,268 |
| 0403 | Rayong | 0.980 | 984.98 | 6.12 | 33.73 | 84.32 | 1,095,667 | 34,995 | 97,986 |
| 0404 | Trat | 0.274 | 46.96 | 0.25 | 1.38 | 3.45 | 171,189 | 5,637 | 15,784 |
| 0405 | Chanthaburi | 0.553 | 138.44 | 0.75 | 4.08 | 11.11 | 254,582 | 7,423 | 20,784 |
| 0406 | Nakhon Nayok | 0.278 | 26.84 | 0.18 | 0.96 | 2.40 | 96,589 | 4,217 | 11,808 |
| 0407 | Prachinburi | 0.621 | 297.25 | 1.89 | 10.29 | 25.72 | 486,601 | 16,862 | 47,214 |
| 0408 | Sa Kaeo | 0.630 | 45.25 | 0.34 | 1.63 | 4.07 | 72,555 | 3,170 | 8,876 |
| 0100 | Northeastern Thailand | 18.523 | 1,496.07 | 9.44 | 51.50 | 128.75 | 80,352 | 2,872 | 7,916 |
| 0101 | Khon Kaen | 1.736 | 204.12 | 1.25 | 6.81 | 17.02 | 117,560 | 4,466 | 12,505 |
| 0102 | Udon Thani | 1.255 | 111.26 | 0.66 | 3.60 | 9.00 | 88,673 | 3,344 | 9,363 |
| 0103 | Loei | 0.543 | 52.67 | 0.33 | 1.78 | 4.45 | 97,903 | 3,751 | 10,503 |
| 0104 | Nong Khai | 0.456 | 40.05 | 0.26 | 1.37 | 3.42 | 89,913 | 3,494 | 9,783 |
| 0105 | Mukdahan | 0.345 | 25.80 | 0.17 | 0.82 | 2.07 | 74,729 | 2,524 | 7,067 |
| 0106 | Nakhon Phanom | 0.564 | 42.89 | 0.28 | 1.43 | 3.57 | 76,000 | 3,142 | 8,798 |
| 0107 | Sakon Nakhon | 0.925 | 55.63 | 0.36 | 1.91 | 4.77 | 68,887 | 2,567 | 7,188 |
| 0108 | Kalasin | 0.914 | 55.84 | 0.36 | 1.91 | 4.77 | 61,084 | 2,887 | 8,084 |
| 0109 | Nakhon Ratchasima | 2.515 | 274.90 | 1.75 | 9.53 | 23.82 | 110,301 | 4,290 | 12,012 |
| 0110 | Chaiyaphum | 0.954 | 60.09 | 0.39 | 2.12 | 5.30 | 63,010 | 2,749 | 7,697 |
| 0111 | Yasothon | 0.481 | 26.04 | 0.17 | 0.90 | 2.25 | 54,183 | 2,437 | 6,824 |
| 0112 | Ubon Ratchathani | 1.738 | 120.49 | 0.73 | 4.00 | 10.00 | 70,551 | 2,805 | 7,854 |
| 0113 | Roi Et | 1.069 | 73.48 | 0.48 | 2.43 | 6.07 | 68,751 | 2,883 | 8,072 |
| 0114 | Buriram | 1.247 | 84.33 | 0.55 | 2.66 | 6.65 | 67,621 | 2,665 | 7,462 |
| 0115 | Surin | 1.107 | 72.88 | 0.47 | 2.44 | 6.10 | 65,810 | 2,776 | 7,772 |
| 0116 | Maha Sarakham | 0.826 | 56.00 | 0.36 | 1.92 | 4.80 | 67,784 | 3,082 | 8,630 |
| 0117 | Sisaket | 1.033 | 69.57 | 0.45 | 2.33 | 5.82 | 67,362 | 2,885 | 8,078 |
| 0118 | Nong Bua Lamphu | 0.478 | 25.19 | 0.16 | 0.94 | 2.35 | 53,416 | 2,460 | 6,888 |
| 0119 | Amnat Charoen | 0.282 | 17.65 | 0.11 | 0.60 | 1.50 | 63,860 | 2,717 | 7,608 |
| 0120 | Bueng Kan | 0.360 | 27.17 | 0.18 | 0.80 | 2.18 | 78,022 | 2,676 | 7,493 |
| 0200 | Northern Thailand | 11.422 | 1,182.87 | 7.69 | 41.90 | 104.75 | 103,760 | 3,810 | 10,668 |
| 0201 | Chiang Mai | 1.805 | 231.73 | 1.47 | 7.99 | 19.97 | 135,991 | 4,873 | 13,644 |
| 0202 | Lampang | 0.735 | 68.20 | 0.42 | 2.32 | 5.80 | 92,749 | 3,707 | 10,380 |
| 0203 | Uttaradit | 0.433 | 38.11 | 0.25 | 1.26 | 3.15 | 87,982 | 3,502 | 9,806 |
| 0204 | Mae Hong Son | 0.235 | 13.00 | 0.08 | 0.44 | 1.10 | 65,448 | 2,358 | 6,602 |
| 0205 | Chiang Rai | 1.156 | 104.44 | 0.65 | 3.57 | 8.92 | 91,308 | 3,553 | 9,948 |
| 0206 | Phrae | 0.423 | 28.38 | 0.18 | 0.98 | 2.45 | 67,057 | 3,120 | 8,736 |
| 0207 | Lamphun | 0.406 | 77.85 | 0.50 | 2.72 | 6.80 | 191,568 | 7,235 | 20,258 |
| 0208 | Nan | 0.445 | 31.31 | 0.20 | 1.09 | 2.72 | 71,121 | 3,031 | 8,487 |
| 0209 | Phayao | 0.410 | 36.02 | 0.23 | 1.20 | 3.00 | 87,858 | 3,598 | 10,074 |
| 0210 | Nakhon Sawan | 0.975 | 107.18 | 0.69 | 3.74 | 9.35 | 109,977 | 4,444 | 12,443 |
| 0211 | Phitsanulok | 0.896 | 93.05 | 0.59 | 3.23 | 8.07 | 104,175 | 4,062 | 11,374 |
| 0212 | Kamphaeng Phet | 0.781 | 110.25 | 0.71 | 3.80 | 9.50 | 142,660 | 5,302 | 14,846 |
| 0213 | Uthai Thani | 0.292 | 28.59 | 0.19 | 0.96 | 2.40 | 97,948 | 3,887 | 10,884 |
| 0214 | Sukhothai | 0.616 | 45.15 | 0.29 | 1.62 | 4.05 | 73,251 | 3,216 | 9,005 |
| 0215 | Tak | 0.532 | 47.80 | 0.31 | 1.69 | 4.22 | 94,902 | 3,653 | 10,228 |
| 0216 | Phichit | 0.539 | 45.04 | 0.29 | 1.56 | 3.90 | 83,504 | 3,470 | 9,716 |
| 0217 | Phetchabun | 0.921 | 76.80 | 0.50 | 2.64 | 6.60 | 84,058 | 3,333 | 9,332 |
| 0300 | Southern Thailand | 9.590 | 1,371.18 | 8.37 | 45.60 | 114.00 | 148,067 | 5,122 | 14,342 |
| 0301 | Phuket | 0.580 | 209.01 | 1.38 | 7.54 | 18.85 | 388,559 | 13,351 | 37,383 |
| 0302 | Surat Thani | 1.134 | 211.05 | 1.22 | 6.67 | 16.94 | 200,471 | 6,307 | 17,660 |
| 0303 | Ranong | 0.269 | 26.77 | 0.17 | 0.90 | 2.25 | 104,517 | 3,811 | 10,678 |
| 0304 | Phang Nga | 0.270 | 71.76 | 0.46 | 2.53 | 6.32 | 265,768 | 10,497 | 29,392 |
| 0305 | Krabi | 0.418 | 89.70 | 0.58 | 2.79 | 6.97 | 239,309 | 7,105 | 19,894 |
| 0306 | Chumphon | 0.498 | 79.40 | 0.51 | 2.83 | 7.07 | 161,626 | 6,111 | 17,111 |
| 0307 | Nakhon Si Thammarat | 1.537 | 153.57 | 0.97 | 5.30 | 13.25 | 99,899 | 4,042 | 11,267 |
| 0308 | Songkhla | 1.635 | 241.84 | 1.47 | 8.01 | 20.02 | 156,245 | 5,338 | 14,946 |
| 0309 | Satun | 0.290 | 36.56 | 0.24 | 1.00 | 2.99 | 129,565 | 4,023 | 11,264 |
| 0310 | Yala | 0.468 | 43.37 | 0.28 | 1.39 | 3.47 | 96,867 | 3,424 | 9,587 |
| 0311 | Trang | 0.630 | 73.20 | 0.47 | 2.08 | 5.20 | 116,394 | 3,767 | 10,548 |
| 0312 | Narathiwat | 0.721 | 42.74 | 0.28 | 1.44 | 3.60 | 61,765 | 2,476 | 6,933 |
| 0313 | Phattalung | 0.512 | 36.48 | 0.24 | 1.16 | 2.93 | 71,298 | 2,831 | 7,927 |
| 0314 | Pattani | 0.641 | 55.74 | 0.36 | 1.64 | 4.47 | 88,442 | 3,010 | 8,428 |
| 0500 | Western Thailand | 3.665 | 539.11 | 3.54 | 19.30 | 48.25 | 149,827 | 5,438 | 15,226 |
| 0501 | Ratchaburi | 0.813 | 172.59 | 1.12 | 6.12 | 15.30 | 214,742 | 8,028 | 22,478 |
| 0502 | Kanchanaburi | 0.829 | 97.29 | 0.63 | 3.46 | 8.65 | 121,570 | 4,617 | 12,928 |
| 0503 | Prachuap Khiri Khan | 0.488 | 92.11 | 0.60 | 3.01 | 7.52 | 198,434 | 6,592 | 18,458 |
| 0504 | Phetchaburi | 0.499 | 68.49 | 0.44 | 2.32 | 5.80 | 143,460 | 5,098 | 14,274 |
| 0505 | Suphan Buri | 0.862 | 86.74 | 0.56 | 2.95 | 7.37 | 100,595 | 4,014 | 11,239 |
| 0506 | Samut Songkhram | 0.190 | 21.88 | 0.14 | 0.84 | 2.10 | 114,990 | 5,048 | 14,134 |