
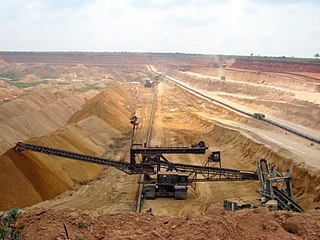
The economy of Brunei, a small and wealthy country, is a mixture of foreign and domestic entrepreneurship, government regulation and welfare measures, and village traditions. It is almost entirely supported by exports of crude oil and natural gas, with revenues from the petroleum sector accounting for over half of GDP. Per capita GDP is high, and substantial income from overseas investment supplements income from domestic production. The government provides for all medical services and subsidizes food and housing. The government has shown progress in its basic policy of diversifying the economy away from oil and gas. Brunei's leaders are concerned that steadily increased integration in the world economy will undermine internal social cohesion although it has taken steps to become a more prominent player by serving as chairman for the 2000 APEC forum. Growth in 1999 was estimated at 2.5% due to higher oil prices in the second half.

The economy of Burundi is $3.436 billion by gross domestic product as of 2018, being heavily dependent on agriculture, which accounts for 32.9% of gross domestic product as of 2008. Burundi itself is a landlocked country lacking resources, and with almost nonexistent industrialization. Agriculture supports more than 70% of the labor force, the majority of whom are subsistence farmers.

The economy of Ecuador is the eighth largest in Latin America and the 69th largest in the world by total GDP. Ecuador's economy is based on the export of oil, bananas, shrimp, gold, other primary agricultural products and money transfers from Ecuadorian emigrants employed abroad. In 2017, remittances constituted 2.7% of Ecuador's GDP. The total trade amounted to 42% of the Ecuador's GDP in 2017.
The economy of Togo has struggled greatly. The International Monetary Fund (IMF) ranks it as the tenth poorest country in the world, with development undercut by political instability, lowered commodity prices, and external debts. While industry and services play a role, the economy is dependent on subsistence agriculture, with industrialization and regional banking suffering major setbacks.
A developed country, or advanced country, is a sovereign state that has a high quality of life, developed economy, and advanced technological infrastructure relative to other less industrialized nations. Most commonly, the criteria for evaluating the degree of economic development are the gross domestic product (GDP), gross national product (GNP), the per capita income, level of industrialization, amount of widespread infrastructure and general standard of living. Which criteria are to be used and which countries can be classified as being developed are subjects of debate. Different definitions of developed countries are provided by the International Monetary Fund and the World Bank; moreover, HDI ranking is used to reflect the composite index of life expectancy, education, and income per capita. Another commonly used measure of a developed country is the threshold of GDP (PPP) per capita of at least US$22,000. In 2023, 40 countries fit all four criteria, while an additional 15 countries fit three out of four.

The net international investment position (NIIP) is the difference in the external financial assets and liabilities of a country. External debt of a country includes government debt and private debt. External assets publicly and privately held by a country's legal residents are also taken into account when calculating NIIP. Commodities and currencies tend to follow a cyclical pattern of significant valuation changes, which is also reflected in NIIP.

The Tiger Cub Economies collectively refer to the economies of the developing countries of Indonesia, Malaysia, the Philippines, Thailand and Vietnam, the five dominant countries in Southeast Asia.
Thailand joined the IMF on May 3, 1949 and has been the recipient of numerous IMF programs, most notably in its role as the source of contagion in the 1997 Asian financial crisis. Thailand currently has a quota of 3,211.9 million SDR's, which gives it the second most voting power in its constituency after Turkey. The IMF opened a technical assistance office in Thailand in 2012 to provide technical assistance and training to the Lao PDR and the Republic of the Union of Myanmar.