List of governorates of Egypt by GDP

Last updated

This is a list of governorates of Egypt by GDP and GDP per capita. The Egyptian pound (EGP) has been converted to the international dollar using the IMF's Purchasing Power Parity conversion rate (one International dollar per 4.538 EGP in 2021). [1]

Contents

Governorates by GDP

The following table is the list of the governorates of Egypt by GDP in 2021 according to data by the Ministry of Planning and Development. [2]

RankGovernorateGDP in millions of EGP
(Nominal)
GDP in millions of Int$
(PPP)
1 Flag of cairo.png Cairo 1,876,650413,541
2 Flag of Giza Governorate.png Giza 770,071169,694
3 Flag of Alexandria.svg Alexandria 565,875124,697
4 Governadorat de Qalyubiya.png Qalyubia 339,31674,772
5 Flag Of Sharqia Governorate.png Sharqia 302,06566,563
6 DakahliaFlag.svg Dakahlia 294,01664,790
7 Flag of Behira Govenorate.svg Beheira 288,85763,653
8 Port Said Flag Version 2.svg Port Said 190,15441,903
9 Flag of Gharbia Governorate.png Gharbia 173,76238,290
10 Flag of Menoufia Governorate.PNG Monufia 157,26734,656
11 Flag of Kafr El-Sheikh Governorate.svg Kafr El Sheikh 151,05333,286
12 Governadorat de Faium.png Faiyum 133,50429,419
13 Flag of Minya Governorate.jpg Minya 130,97628,862
14 Flag of Asyut Governorate.png Asyut 126,14327,797
15 Flag of Suez Governorate.svg Suez 119,12926,251
16 Flag Of The Matrouh Governorate (High resolution).png Matrouh 115,55225,463
17 Flag of Damietta Governorate.svg Damietta 110,34024,314
18 Governadorat de Suhaj.png Sohag 107,75623,745
19 Governadorat d'Ismailiya.png Ismailia 91,12720,910
20 Beni Suef Governorate New Flag.svg Beni Suef 87,19419,214
21 Flag of Qena Governorate.png Qena 80,39517,716
22 Flag of Aswan Governorate.png Aswan 76,26516,806
23 Red sea governorate flag.png Red Sea 75,87216,719
24 Flag of South Sinai Governorate.png South Sinai 58,38612,866
25 North Sinai (New Flag).svg North Sinai 48,93210,783
26 Eg luxor1.png Luxor 46,63410,276
27 Flag of New Valley Governorate.png New Valley 16,9633,738
Flag of Egypt.svg  Egypt 6,627,0281,460,341

Governorates by GDP per capita

The following table is the list of the governorates of Egypt by GDP per capita in 2021 according to data by the Ministry of Planning and Development. [2]

RankGovernorateGDP in millions of EGP
(Nominal)
Population (2021) [3] GDP per capita in EGP
(Nominal)
GDP per capita in USD
(PPP)
1 Flag of South Sinai Governorate.png South Sinai 58,386112,672518,194114,190
2 Port Said Flag Version 2.svg Port Said 190,154780,515243,62653,686
3 Flag Of The Matrouh Governorate (High resolution).png Matrouh 115,552511,545225,88849,777
4 Red sea governorate flag.png Red Sea 75,872390,070194,50942,862
5 Flag of cairo.png Cairo 1,876,65010,044,894186,82641,169
6 Flag of Suez Governorate.svg Suez 119,129773,840153,94533,923
7 Flag of Alexandria.svg Alexandria 565,8755,441,866103,98522,914
8 North Sinai (New Flag).svg North Sinai 48,932492,55599,34321,891
9 Flag of Giza Governorate.png Giza 770,0719,250,79183,24418,347
10 Flag of Damietta Governorate.svg Damietta 110,3401,585,25369,60415,338
11 Flag of New Valley Governorate.png New Valley 16,963259,17465,45014,423
12 Governadorat d'Ismailiya.png Ismailia 91,1271,408,84764,68214,253
13 Governadorat de Qalyubiya.png Qalyubia 339,3165,982,56756,71712,498
14 Flag of Aswan Governorate.png Aswan 76,2651,600,21047,65910,502
15 Flag of Behira Govenorate.svg Beheira 288,8576,676,85843,2629,533
16 DakahliaFlag.svg Dakahlia 294,0166,889,96242,6739,403
17 Flag of Kafr El-Sheikh Governorate.svg Kafr El Sheikh 151,0533,620,88741,7179,193
18 Flag Of Sharqia Governorate.png Sharqia 302,0657,682,77039,3178,663
19 Eg luxor1.png Luxor 46,6341,352,81834,4727,596
20 Flag of Menoufia Governorate.PNG Monufia 157,2674,604,59934,1547,526
21 Governadorat de Faium.png Faiyum 133,5043,928,02033,9887,490
22 Flag of Gharbia Governorate.png Gharbia 173,7625,309,44032,7277,212
23 Flag of Asyut Governorate.png Asyut 126,1434,847,73526,0215,734
24 Beni Suef Governorate New Flag.svg Beni Suef 87,1943,455,73325,2325,560
25 Flag of Qena Governorate.png Qena 80,3953,492,86723,0175,072
26 Flag of Minya Governorate.jpg Minya 130,9766,077,79121,5504,749
27 Governadorat de Suhaj.png Sohag 107,7565,486,40919,6414,328
Flag of Egypt.svg  Egypt 6,627,028102,060,68864,93214,308

Related Research Articles

<span class="mw-page-title-main">Economy of Nauru</span>

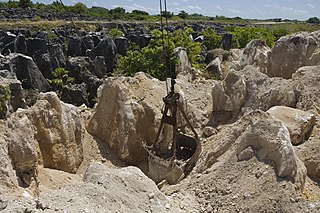
The economy of Nauru is tiny, based on a population in 2019 of only 11,550 people. The economy has historically been based on phosphate mining. With primary phosphate reserves exhausted by the end of the 2010s, Nauru has sought to diversify its sources of income. In 2020, Nauru's main sources of income were the sale of fishing rights in Nauru's territorial waters, and revenue from the Regional Processing Centre.

<span class="mw-page-title-main">Economy of Qatar</span>

The Economy of Qatar is one of the highest in the world based on GDP per capita, ranking generally among the top ten richest countries on world rankings for 2015 and 2016 data compiled by the World Bank, the United Nations, and the International Monetary Fund (IMF). The country's economy has grown despite sanctions by its neighbors, Saudi Arabia and the United Arab Emirates. Mainly because the country exports primarily to Japan, South Korea, India and China, making the sanctions effectively redundant as neither Saudi Arabia nor the United Arab Emirates have imposed trading penalties such as tariffs or embargoes on any of these countries for trading with Qatar, or offering incentives such as discounts for their own energy exports to reduce Qatari exports.

<span class="mw-page-title-main">Economy of Tanzania</span>

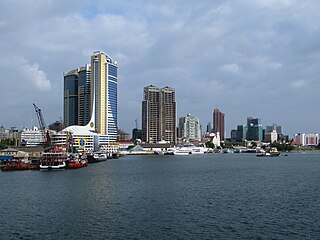
The economy of Tanzania is a lower-middle income economy that is overwhelmingly dependent on agriculture. Tanzania's economy has been transitioning from a planned economy to a market economy since 1985. Although total GDP has increased since these reforms began, GDP per capita dropped sharply at first, and only exceeded the pre-transition figure in around 2007.

The gross world product (GWP), also known as gross world income (GWI), is the combined gross national income of all the countries in the world. Because imports and exports balance exactly when considering the whole world, this also equals the total global gross domestic product (GDP). According to the World Bank, the 2013 nominal GWP was approximately 75.59 trillion United States dollars. In 2017, according to the CIA's World Factbook, the GWP was around $80.27 trillion in nominal terms and totaled approximately 127.8 trillion international dollars in terms of purchasing power parity (PPP). The per capita PPP GWP in 2017 was approximately 17,500 international dollars according to the World Factbook. According to the World Bank, the 2020 GWP in current dollars was approximately $84.705 trillion.

<span class="mw-page-title-main">Developed country</span> Country with a developed industry and infrastructure

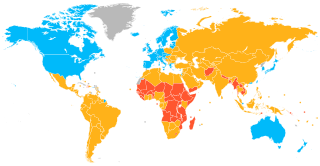
A developed country, or advanced country, is a sovereign state that has a high quality of life, developed economy, and advanced technological infrastructure relative to other less industrialized nations. Most commonly, the criteria for evaluating the degree of economic development are the gross domestic product (GDP), gross national product (GNP), the per capita income, level of industrialization, amount of widespread infrastructure and general standard of living. Which criteria are to be used and which countries can be classified as being developed are subjects of debate. Different definitions of developed countries are provided by the International Monetary Fund and the World Bank; moreover, HDI ranking is used to reflect the composite index of life expectancy, education, and income per capita. Another commonly used measure of a developed country is the threshold of GDP (PPP) per capita of at least US$22,000. In 2023, 40 countries fit all four criteria, while an additional 15 countries fit three out of four.

<span class="mw-page-title-main">Qena Governorate</span> Governorate of Egypt

Qena Governorate is one of the governorates of Egypt. Its located in Upper Egypt, the southern part of the country, it covers a stretch of the Nile valley. Its capital is the city of Qena.

<span class="mw-page-title-main">Historical GDP of China</span> Overview of economic growth and decline in the East Asian country

This article includes a list of China's historical gross domestic product (GDP) values, the market value of all final goods and services produced by a nation in a given year. The GDP dollar estimates presented here are either calculated at market or government official exchange rates (nominal), or derived from purchasing power parity (PPP) calculations. This article also includes historical GDP growth.

References

  1. "Report for Selected Countries and Subjects". IMF. Retrieved 2024-01-28.
  2. 1 2 "GDP by Governorate". mped.gov.eg. Retrieved 2024-01-28.
  3. "Egypt: Governorates, Major Cities & Towns - Population Statistics, Maps, Charts, Weather and Web Information". www.citypopulation.de. Retrieved 2024-01-28.