Gross domestic product (GDP) is a monetary measure of the market value of all the final goods and services produced and rendered in a specific time period by a country or countries. GDP is more often used by the government of a single country to measure its economic health. Due to its complex and subjective nature, this measure is often revised before being considered a reliable indicator.

Per capita income (PCI) or average income measures the average income earned per person in a given area in a specified year.
A variety of measures of national income and output are used in economics to estimate total economic activity in a country or region, including gross domestic product (GDP), gross national product (GNP), net national income (NNI), and adjusted national income. All are specially concerned with counting the total amount of goods and services produced within the economy and by various sectors. The boundary is usually defined by geography or citizenship, and it is also defined as the total income of the nation and also restrict the goods and services that are counted. For instance, some measures count only goods & services that are exchanged for money, excluding bartered goods, while other measures may attempt to include bartered goods by imputing monetary values to them.
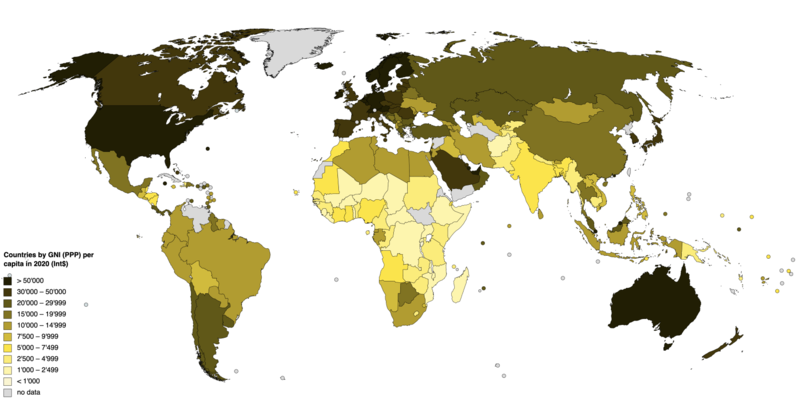
Purchasing power parity (PPP) is a measure of the price of specific goods in different countries and is used to compare the absolute purchasing power of the countries' currencies. PPP is effectively the ratio of the price of a market basket at one location divided by the price of the basket of goods at a different location. The PPP inflation and exchange rate may differ from the market exchange rate because of tariffs, and other transaction costs.

The gross national income (GNI), previously known as gross national product (GNP), is the total domestic and foreign output claimed by residents of a country, consisting of gross domestic product (GDP), plus factor incomes earned by foreign residents, minus income earned in the domestic economy by nonresidents.
The international dollar, also known as Geary–Khamis dollar, is a hypothetical unit of currency that has the same purchasing power parity that the U.S. dollar had in the United States at a given point in time. It is mainly used in economics and financial statistics for various purposes, most notably to determine and compare the purchasing power parity and gross domestic product of various countries and markets. The year 1990 or 2000 is often used as a benchmark year for comparisons that run through time. The unit is often abbreviated, e.g. 2000 US dollars or 2000 International$.
Income in India discusses the financial state in India. With rising economic growth and prosperity, India's income is also rising rapidly. As an overview, India's per capita net national income or NNI was around Rs. 98,374 in 2022-23. The per-capita income is a crude indicator of the prosperity of a country. In contrast, the gross national income at constant prices stood at over 128 trillion rupees. The same year, GRI growth rate at constant prices was around 6.6 percent. While GNI and NNI are both indicators for a country's economic performance and welfare, the GNI is related to the GDP or the Gross Domestic Product plus the net receipts from abroad, including wages and salaries, property income, net taxes and subsidies receivable from abroad. On the other hand, the NNI of a country is equal to its GNI net of depreciation.
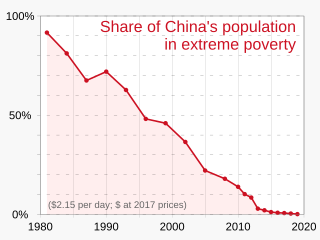
In China today, poverty refers mainly to the rural poor. Decades of economic development has reduced urban extreme poverty. According to the World Bank, more than 850 million Chinese people have been lifted out of extreme poverty; China's poverty rate fell from 88 percent in 1981 to 0.7 percent in 2015, as measured by the percentage of people living on the equivalent of US$1.90 or less per day in 2011 purchasing price parity terms, which still stands in 2022.
This article includes several ranked indicators for Chile's regions.
The Penn World Table (PWT) is a set of national-accounts data developed and maintained by scholars at the University of California, Davis and the Groningen Growth Development Centre of the University of Groningen to measure real GDP across countries and over time. Successive updates have added countries, years (1950-2019), and data on capital, productivity, employment and population. The current version of the database, version 10, thus allows for comparisons of relative GDP per capita, as a measure of standard of living, the productive capacity of economies and their productivity level. Compared to other databases, such as the World Bank's World Development Indicators, the time period covered is larger and there is more data that is useful for comparing productivity across countries and over time.
The International Comparison Program is a partnership of various statistical administrations of up to 199 countries guided by the World Bank. The main partners of this program are the World Bank, IMF, UN, ADB, OECD, CISSTAT, Eurostat, AfDB ESCWA, ECLAC, DFID, ABS, IDB, NMoFA who are also all part of the executive board.