List of countries by smartphone penetration

Last updated

This is a list of countries by smartphone penetration. These numbers are based on the top countries by percentage of population owning a smartphone (so smaller countries are absent) and come from Newzoo's Global Mobile Market Report (the numbers were last updated in June 2021). [1]

Contents

2022 rankings

[2]

RankCountry/RegionTotal populationSmartphone usersSmartphone penetration
1Flag of the People's Republic of China.svg  PRC 1430.00M974.69M68.4%
2Flag of India.svg  India 1420.00M659.00M46.5%
3Flag of the United States.svg  United States 338.29M276.14M81.6%
4Flag of Indonesia.svg  Indonesia 275.50M187.70M68.1%
5Flag of Brazil.svg  Brazil 215.31M143.43M66.6%
6Flag of Russia.svg  Russia 144.71M106.44M73.6%
7Flag of Japan.svg  Japan 123.95M97.44M78.6%
8Flag of Nigeria.svg  Nigeria 218.54M83.34M38.1%
9Flag of Mexico.svg  Mexico 127.50M78.37M61.5%
10Flag of Pakistan.svg  Pakistan 235.82M72.99M31%

2021 rankings

[2]

RankCountry/RegionTotal populationSmartphone usersSmartphone penetration
1Flag of the People's Republic of China.svg  PRC 1440M865.04M59.9%
2Flag of India.svg  India 1390M606.57M43.5%
3Flag of the United States.svg  United States 332.92M240.15M72.1%
4Flag of Indonesia.svg  Indonesia 276.36M178.96M64.8%
5Flag of Brazil.svg  Brazil 212.56M109.34M51.4%
6Flag of Russia.svg  Russia 145.91M102.24M70.1%
7Flag of Japan.svg  Japan 126.05M94.78M75.2%
8Flag of Mexico.svg  Mexico 130.26M77.31M59.4%
9Flag of Nigeria.svg  Nigeria 211.4M72.03M34.1%
10Flag of the Philippines.svg  Philippines 111.05M67.37M60.7%

2020 rankings

Newzoo's 2020 Global Mobile Market Report shows countries/markets sorted by smartphone penetration (percentage of population actively using a smartphone). These numbers come from Newzoo's Global Mobile Market Report 2020 - Light Version. [3]

RankCountry/RegionTotal populationSmartphone penetrationSmartphone users
1Flag of the United States.svg  United States 331M81.6%270M
2Flag of the United Kingdom.svg  United Kingdom 67.89M78.9%53.58M
3Flag of Germany.svg  Germany 83.78M77.9%65.24M
4Flag of France.svg  France 65.27M77.6%50.66M
5Flag of South Korea.svg  South Korea 51.27M76.5%39.2M
6Flag of Italy.svg  Italy 60.94M85%52.4M
7Flag of Russia.svg  Russia 145.93M68.5%99.93M
8Flag of the People's Republic of China.svg  China 1.44B63.4%911.92M
9Flag of Vietnam.svg  Vietnam 97.34M63.1%61.37M
10Flag of Iran.svg  Iran 83.99M62.9%52.81M
11Flag of Turkey.svg  Turkey 84.34M61.7%52.06M
12Flag of Japan.svg  Japan 126.48M59.9%75.77M
13Flag of Indonesia.svg  Indonesia 273.52M58.6%160.23M
14Flag of Mexico.svg  Mexico 128.93M54.4%70.14M
15Flag of Thailand.svg  Thailand 69.8M54.3%37.88M
16Flag of Brazil.svg  Brazil 212.56M51.4%109.34M
17Flag of the Philippines.svg  Philippines 109.58M37.7%41.31M
18Flag of Bangladesh.svg  Bangladesh 164.69M32.4%53.3M
19Flag of India.svg  India 1.38B31.8%439.42M
20Flag of Pakistan.svg  Pakistan 220.89M18.4%40.59M

2019 rankings

Newzoo's 2019 Global Mobile Market Report shows countries/markets sorted by smartphone penetration (percentage of population actively using a smartphone). These numbers come from Newzoo's Global Mobile Market Report 2019 - Light Version. [4]

RankCountry/RegionTotal populationSmartphone penetrationSmartphone users
1Flag of the United Kingdom.svg  United Kingdom 67.0m82.9%55.5m
2Flag of Germany.svg  Germany 82.4m79.9%65.9m
3Flag of the United States.svg  United States 329.1m79.1%260.2m
4Flag of France.svg  France 65.5m77.5%50.7m
5Flag of Spain.svg  Spain 46.4m74.3%34.5m
6Flag of South Korea.svg  South Korea 51.3m70.4%36.1m
7Flag of Russia.svg  Russia 143.9m66.3%95.4m
8Flag of Italy.svg  Italy 59.2m60.8%36.0m
9Flag of the People's Republic of China.svg  China 1.42b59.9%851.2m
10Flag of Japan.svg  Japan 126.9m57.2%72.6m
11Flag of Iran.svg  Iran 82.8m54.8%45.4m
12Flag of Turkey.svg  Turkey 83.0m54.0%44.8m
13Flag of Mexico.svg  Mexico 132.3m49.5%65.6m
14Flag of Brazil.svg  Brazil 212.4m45.6%96.9m
15Flag of Vietnam.svg  Vietnam 97.4m44.9%43.7m
16Flag of the Philippines.svg  Philippines 108.1m33.6%36.3m
17Flag of Indonesia.svg  Indonesia 269.5m31.1%83.9m
18Flag of India.svg  India 1.3b25.3%345.9m
19Flag of Bangladesh.svg  Bangladesh 168.1m18.5%31.0m
20Flag of Pakistan.svg  Pakistan 204.6m15.9%32.5m

2018 rankings

Newzoo's 2018 Global Mobile Market Report shows countries/markets sorted by smartphone penetration (percentage of population). These numbers come from Newzoo's Global Mobile Market Report 2018. [5] By total number of smartphone users, "China by far has the most, boasting 783 million users. India took the #2 spot with 375 million users (less than half of China’s number). However, that gap will decrease by 2021, when we expect India to have 601 million smartphone users. The U.S. came in at #3, accounting for 252 million of the world’s smartphones."

RankCountry/RegionTotal populationSmartphone penetrationSmartphone users
1Flag of the United Kingdom.svg  United Kingdom 66,574,00083%54,713,000
2Flag of the Netherlands.svg  Netherlands 17,084,00079.3%13,547,000
3Flag of Sweden.svg  Sweden 9,983,00078.8%7,864,000
4Flag of Germany.svg  Germany 82,293,00078.8%64,830,000
5Flag of the United States.svg  United States 326,767,00077.0%251,688,000
6Flag of Belgium (civil).svg  Belgium 11,499,00076.6%8,813,000
7Flag of France.svg  France 65,233,00076.0%32,598,000
8Flag of Spain.svg  Spain 46,397,00072.5%33,631,000
9Flag of Canada (Pantone).svg  Canada 36,954,00072.1%26,635,000
10Flag of Australia (converted).svg  Australia 24,772,00068.6%16,999,000
11Flag of South Korea.svg  South Korea 51,164,00068.0%34,562,000
12Flag of Kazakhstan.svg  Kazakhstan 18,404,00064.9%11,938,000
13Flag of Poland.svg  Poland 38,105,00064.0%24,371,000
14Flag of Russia.svg  Russia 143,965,00063.8%91,865,000
15Flag of the Republic of China.svg  Taiwan 23,694,00060.0%14,223,000
16Flag of Italy.svg  Italy 59,291,00058.0%34,394,000
17Flag of Malaysia.svg  Malaysia 32,042,00057.5%18,437,000
18Flag of Japan.svg  Japan 127,185,00055.3%70,327,000
19Flag of the People's Republic of China.svg  China 1,415,046,00055.3%782,848,000
20Flag of Romania.svg  Romania 19,581,00053.8%10,538,000
21Flag of Ukraine.svg  Ukraine 44,009,00048.3%21,276,000
22Flag of Argentina.svg  Argentina 44,689,00046.9%20,979,000
23Flag of Saudi Arabia.svg  Saudi Arabia 33,554,00046.0%15,449,000
24Flag of Mexico.svg  Mexico 130,759,00045.6%59,597,000
25Flag of the Philippines.svg  Philippines 106,512,00044.9%47,858,000
26Flag of Chile.svg  Chile 18,197,00044.2%8,049,000
27Flag of Thailand.svg  Thailand 69,183,00043.7%30,217,000
28Flag of Brazil.svg  Brazil 210,868,00041.3%87,172,000
29Flag of Venezuela.svg  Venezuela 32,381,00040.8%13,224,000
30Flag of Colombia.svg  Colombia 49,465,00039.8%19,669,000
31Flag of Morocco.svg  Morocco 36,192,00037.9%13,707,000
32Flag of Turkey.svg  Turkey 81,917,00037.9%31,060,000
33Flag of Vietnam.svg  Vietnam 96,491,00037.7%36,378,000
34Flag of South Africa.svg  South Africa 57,398,00035.5%20,371,000
35Flag of Iran.svg  Iran , Republic of82,012,00064.6%53,200,000
36Flag of Peru.svg  Peru 32,552,00032.1%10,462,000
37Flag of Uzbekistan.svg  Uzbekistan 32,365,00031.3%10,142,000
38Flag of Algeria.svg  Algeria 42,008,00029.1%12,204,000
39Flag of Egypt.svg  Egypt 99,376,00028.0%27,852,000
40Flag of India.svg  India 1,354,052,00027.7%374,893,000
41Flag of Indonesia.svg  Indonesia 266,795,00027.4%73,155,000
42Flag of Ghana.svg  Ghana 29,464,00024.0%7,060,000
43Flag of Myanmar.svg  Myanmar 53,856,00021.8%11,722,000
44Flag of Kenya.svg  Kenya 50,951,00020.9%10,668,000
45Flag of Sudan.svg  Sudan 41,512,00019.7%8,176,000
46Flag of Bangladesh.svg  Bangladesh 166,368,00016.1%26,827,000
47Flag of Uganda.svg  Uganda 44,271,00015.6%6,922,000
48Flag of Pakistan.svg  Pakistan 200,814,00013.8%27,730,000
49Flag of Nigeria.svg  Nigeria 195,875,00013.0%25,552,000
50Flag of Ethiopia.svg  Ethiopia 107,535,00011.2%12,014,000

2017 rankings

Newzoo's 2017 Global Mobile Market Report shows countries/markets sorted by smartphone penetration (percentage of population). These numbers come from Newzoo's Global Mobile Market Report 2017 [6]

RankCountry/RegionTotal PopulationSmartphone PenetrationSmartphone Users
1Flag of the United Arab Emirates.svg  United Arab Emirates 9,398,00080.6%7,573,000
2Flag of Sweden.svg  Sweden 9,921,00072.2%7,167,000
3Flag of Switzerland (Pantone).svg   Switzerland 8,454,00071.7%6,061,000
4Flag of South Korea.svg  South Korea 50,705,00071.5%36,262,000
5Flag of the Republic of China.svg  Taiwan 23,564,00070.4%16,596,000
6Flag of Canada (Pantone).svg  Canada 36,626,00069.8%25,556,000
7Flag of the United States.svg  United States 326,474,00069.3%226,289,000
8Flag of the Netherlands.svg  Netherlands 17,033,00068.8%11,720,000
9Flag of Germany.svg  Germany 80,636,00068.8%55,492,000
10Flag of the United Kingdom.svg  United Kingdom 65,511,00068.6%44,953,000
11Flag of Australia (converted).svg  Australia 24,642,00067.7%16,671,000
12Flag of Belgium (civil).svg  Belgium 11,444,00067.3%7,706,000
13Flag of Spain.svg  Spain 46,070,00066.8%30,771,000
14Flag of Azerbaijan.svg  Azerbaijan 9,974,00066.4%6,619,000
15Flag of Italy.svg  Italy 59,798,00065.8%39,323,000
16Flag of France.svg  France 64,939,00065.3%42,399,000
17Flag of Saudi Arabia.svg  Saudi Arabia 32,743,00065.2%21,337,000
18Flag of Portugal.svg  Portugal 10,265,00065.0%6,672,000
19Flag of the Czech Republic.svg  Czech Republic 10,555,00064.8%6,835,000
20Flag of Malaysia.svg  Malaysia 31,164,00064.1%19,967,000
21Flag of Poland.svg  Poland 38,564,00063.4%24,431,000
22Flag of Greece.svg  Greece 10,893,00059.5%6,484,000
23Flag of Chile.svg  Chile 18,313,00056.0%10,254,000
24Flag of Romania.svg  Romania 19,238,00056.0%10,772,000
25Flag of Russia.svg  Russia 143,375,00054.7%78,364,000
26Flag of the People's Republic of China.svg  China 1,388,233,00051.7%717,310,000
27Flag of Japan.svg  Japan 126,045,00050.1%63,089,000
28Flag of Turkey.svg  Turkey 80,418,00049.8%40,010,000
29Flag of Argentina.svg  Argentina 44,272,00048.2%21,329,000
30Flag of Mexico.svg  Mexico 130,223,00040.7%52,993,000
31Flag of Thailand.svg  Thailand 68,298,00040.5%27,628,000
32Flag of Kazakhstan.svg  Kazakhstan 18,064,00039.2%7,078,000
33Flag of Brazil.svg  Brazil 211,243,00037.7%79,578,000
34Flag of Iran.svg  Iran 80,946,00037.1%30,000,000
35Flag of Venezuela.svg  Venezuela 31,926,00036.2%11,559,000
36Flag of South Africa.svg  South Africa 55,436,00036.2%20,089,000
37Flag of Peru.svg  Peru 32,166,00036.0%11,585,000
38Flag of Colombia.svg  Colombia 49,068,00035.4%17,361,000
39Flag of Morocco.svg  Morocco 35,241,00033.4%11,755,000
40Flag of Algeria.svg  Algeria 41,064,00032.4%13,293,000
41Flag of Egypt.svg  Egypt 95,215,00030.4%28,958,000
42Flag of Vietnam.svg  Vietnam 95,415,00026.4%25,162,000
43Flag of Ukraine.svg  Ukraine 44,405,00023.5%10,448,000
44Flag of the Philippines.svg  Philippines 103,797,00023.3%24,173,000
45Flag of India.svg  India 1,342,513,00022.3%300,124,000
46Flag of Indonesia.svg  Indonesia 263,510,00020.7%54,494,000
47Flag of Iraq.svg  Iraq 38,654,00019.9%7,709,000
48Flag of Nigeria.svg  Nigeria 191,836,00014.8%28,381,000
49Flag of Pakistan.svg  Pakistan 200,814,0006.7%13,505,343
50Flag of Bangladesh.svg  Bangladesh 164,828,0005.2%8,578,000

2016 rankings

The following list of countries by smartphone penetration was measured by the Pew Research Center survey conducted in 40 nations among 45,435 respondents from March 25 to May 27, 2015. [7]

RankCountry % of adults
owning a smartphone
Relative size
1Flag of South Korea.svg  South Korea 8888
 
2Flag of Australia (converted).svg  Australia 7777
 
3Flag of Israel.svg  Israel 7474
 
4Flag of the United States.svg  United States 7272
 
5Flag of Spain.svg  Spain 7171
 
6Flag of New Zealand.svg  New Zealand 70
 
7Flag of the United Kingdom.svg  United Kingdom 6868
 
8Flag of Canada (Pantone).svg  Canada 6767
 
9Flag of Chile.svg  Chile 6565
 
10Flag of Malaysia.svg  Malaysia 6565
 
11Flag of Germany.svg  Germany 6060
 
12Flag of Italy.svg  Italy 6060
 
13Flag of Turkey.svg  Turkey 5959
 
14Flag of the People's Republic of China.svg  China 5959
 
15Flag of Palestine.svg  Palestine 5757
 
16Flag of Lebanon.svg  Lebanon 5252
 
17Flag of Jordan.svg  Jordan 5151
 
18Flag of France.svg  France 4949
 
19Flag of Argentina.svg  Argentina 4848
 
20Flag of India.svg  India 4545
 
21Flag of Russia.svg  Russia 4545
 
22Flag of Brazil.svg  Brazil 4141
 
23Flag of Poland.svg  Poland 4141
 
24Flag of Japan.svg  Japan 3939
 
25Flag of South Africa.svg  South Africa 3737
 
26Flag of Vietnam.svg  Vietnam 3535
 
27Flag of Mexico.svg  Mexico 3535
 
28Flag of Nigeria.svg  Nigeria 2828
 
29Flag of Ukraine.svg  Ukraine 2727
 
30Flag of Kenya.svg  Kenya 2626
 
31Flag of Peru.svg  Peru 2525
 
32Flag of the Philippines.svg  Philippines 2222
 
33Flag of Ghana.svg  Ghana 2121
 
34Flag of Indonesia.svg  Indonesia 2121
 
38Flag of Pakistan.svg  Pakistan 1919
 
35Flag of Senegal.svg  Senegal 1919
 
36Flag of Fiji.svg  Fiji 1717
 
37Flag of Burkina Faso.svg  Burkina Faso 1414
 
39Flag of Tanzania.svg  Tanzania 1111
 
40Flag of Ethiopia.svg  Ethiopia 44
 
41Flag of Uganda.svg  Uganda 44
 

A different research performed by eMarketer indicates that the smartphone penetration in Denmark is 81%. [8]

2015 rankings

The following list of countries by smartphone penetration was measured by the Pew Research Center survey conducted in 40 nations among 45,435 respondents from March 25 to May 27, 2015. [7]

RankCountry % of adults
owning a smartphone
Relative size
1Flag of South Korea.svg  South Korea 8888
 
2Flag of Australia (converted).svg  Australia 7777
 
3Flag of Israel.svg  Israel 7474
 
4Flag of the United States.svg  United States 7272
 
5Flag of Spain.svg  Spain 7171
 
6Flag of New Zealand.svg  New Zealand 70
 
7Flag of the United Kingdom.svg  United Kingdom 6868
 
8Flag of Canada (Pantone).svg  Canada 6767
 
9Flag of Chile.svg  Chile 6565
 
10Flag of Malaysia.svg  Malaysia 6565
 
11Flag of Germany.svg  Germany 6060
 
12Flag of Italy.svg  Italy 6060
 
13Flag of Turkey.svg  Turkey 5959
 
14Flag of the People's Republic of China.svg  China 5858
 
15Flag of Palestine.svg  Palestine 5757
 
16Flag of Lebanon.svg  Lebanon 5252
 
17Flag of Jordan.svg  Jordan 5151
 
18Flag of France.svg  France 4949
 
19Flag of Argentina.svg  Argentina 4848
 
20Flag of Venezuela.svg  Venezuela 4545
 
21Flag of Russia.svg  Russia 4545
 
22Flag of Brazil.svg  Brazil 4141
 
23Flag of Poland.svg  Poland 4141
 
24Flag of Japan.svg  Japan 3939
 
25Flag of South Africa.svg  South Africa 3737
 
26Flag of Vietnam.svg  Vietnam 3535
 
27Flag of Mexico.svg  Mexico 3535
 
28Flag of Nigeria.svg  Nigeria 2828
 
29Flag of Ukraine.svg  Ukraine 2727
 
30Flag of Kenya.svg  Kenya 2626
 
31Flag of Peru.svg  Peru 2525
 
32Flag of the Philippines.svg  Philippines 2222
 
33Flag of Ghana.svg  Ghana 2121
 
34Flag of Indonesia.svg  Indonesia 2121
 
35Flag of Senegal.svg  Senegal 1919
 
36Flag of India.svg  India 1717
 
37Flag of Burkina Faso.svg  Burkina Faso 1414
 
38Flag of Pakistan.svg  Pakistan 1414
 
39Flag of Tanzania.svg  Tanzania 1111
 
40Flag of Ethiopia.svg  Ethiopia 44
 
41Flag of Uganda.svg  Uganda 44
 

A different research performed by eMarketer indicates that the smartphone penetration in Denmark is 81%. [8]

2013 rankings

The following list of the countries by smartphone penetration was measured by Google's Our Mobile Planet in 2013. [9] [10]

RankCountry/TerritoryPenetration
1Flag of the United Arab Emirates.svg  United Arab Emirates 73.8%
2Flag of South Korea.svg  South Korea 73.0%
3Flag of Saudi Arabia.svg  Saudi Arabia 72.8%
4Flag of Singapore.svg  Singapore 71.7%
5Flag of Norway.svg  Norway 67.5%
6Flag of Australia (converted).svg  Australia 64.6%
7Flag of Sweden.svg  Sweden 62.9%
8Flag of Hong Kong.svg  Hong Kong 62.8%
9Flag of the United Kingdom.svg  United Kingdom 62.2%
10Flag of Denmark.svg  Denmark 59.0%
11Flag of Ireland.svg  Ireland 57.0%
12Flag of Israel.svg  Israel 56.6%
13Flag of Canada (Pantone).svg  Canada 56.4%
14Flag of the United States.svg  United States 56.4%
15Flag of Spain.svg  Spain 55.4%
16Flag of Switzerland (Pantone).svg   Switzerland 54.0%
17Flag of New Zealand.svg  New Zealand 53.6%
18Flag of the Netherlands.svg  Netherlands 52.0%
19Flag of the Republic of China.svg  Taiwan 50.8%
20Flag of Austria.svg  Austria 48.0%
21Flag of the People's Republic of China.svg  China 46.9%
22Flag of Slovakia.svg  Slovakia 45.9%
23Flag of Finland.svg  Finland 45.5%
24Flag of France.svg  France 42.3%
25Flag of the Czech Republic.svg  Czech Republic 41.6%
26Flag of Italy.svg  Italy 41.3%
27Flag of Germany.svg  Germany 39.8%
28Flag of South Africa.svg  South Africa 39.8%
29Flag of the Philippines.svg  Philippines 38.7%
30Flag of Mexico.svg  Mexico 36.8%
31Flag of Russia.svg  Russia 36.2%
32Flag of Poland.svg  Poland 35.0%
33Flag of Malaysia.svg  Malaysia 34.5%
34Flag of Hungary.svg  Hungary 34.4%
35Flag of Belgium (civil).svg  Belgium 33.5%
36Flag of Greece.svg  Greece 32.5%
37Flag of Portugal.svg  Portugal 32.1%
38Flag of Thailand.svg  Thailand 31.0%
39Flag of Argentina.svg  Argentina 30.7%
40Flag of Turkey.svg  Turkey 29.6%
41Flag of Romania.svg  Romania 27.9%
42Flag of Brazil.svg  Brazil 26.3%
43Flag of Japan.svg  Japan 24.7%
44Flag of Vietnam.svg  Vietnam 19.7%
45Flag of Indonesia.svg  Indonesia 14.0%
46Flag of Ukraine.svg  Ukraine 14.4%
47Flag of India.svg  India 12.8%

See also

Related Research Articles

<span class="mw-page-title-main">Digital media</span> Any media that are encoded in machine-readable formats

In mass communication, digital media is any communication media that operates in conjunction with various encoded machine-readable data formats. Digital content can be created, viewed, distributed, modified, listened to, and preserved on a digital electronic device, including digital data storage media and digital broadcasting. Digital is defined as any data represented by a series of digits, and media refers to methods of broadcasting or communicating this information. Together, digital media refers to mediums of digitized information broadcast through a screen and/or a speaker. This also includes text, audio, video, and graphics that are transmitted over the internet for viewing or listening to on the internet.

<span class="mw-page-title-main">Smartphone</span> Handheld mobile device

A smartphone is a mobile device that combines the functionality of a traditional mobile phone with advanced computing capabilities. It typically has a touchscreen interface, allowing users to access a wide range of applications and services, such as web browsing, email, and social media, as well as multimedia playback and streaming. Smartphones have built-in cameras, GPS navigation, and support for various communication methods, including voice calls, text messaging, and internet-based messaging apps.

The digital divide is the unequal access to digital technology, including smartphones, tablets, laptops, and the internet. The digital divide creates a division and inequality around access to information and resources. In the Information Age in which information and communication technologies (ICTs) have eclipsed manufacturing technologies as the basis for world economies and social connectivity, people without access to the Internet and other ICTs are at a socio-economic disadvantage, for they are unable or less able to find and apply for jobs, shop and learn.

A landline is a telephone connection that uses metal wires from the owner's premises also referred to as: POTS, Twisted pair, telephone line or public switched telephone network (PSTN).

<span class="mw-page-title-main">Mobile game</span> Video game played on a mobile device

A mobile game is a video game that is typically played on a mobile phone. The term also refers to all games that are played on any portable device, including from mobile phone, tablet, PDA to handheld game console, portable media player or graphing calculator, with and without network availability. The earliest known game on a mobile phone was a Tetris variant on the Hagenuk MT-2000 device from 1994.

<span class="mw-page-title-main">Information and communications technology</span> Extensional term for information technology

Information and communications technology (ICT) is an extensional term for information technology (IT) that stresses the role of unified communications and the integration of telecommunications and computers, as well as necessary enterprise software, middleware, storage and audiovisual, that enable users to access, store, transmit, understand and manipulate information.

<span class="mw-page-title-main">Telecommunications in Turkey</span> Overview of telecommunications in Turkey

Telecommunications in Turkey provides information about television, radio, fixed and mobile telephones, and the Internet in Turkey.

<span class="mw-page-title-main">Usage share of web browsers</span> Relative market adoption of web browsers

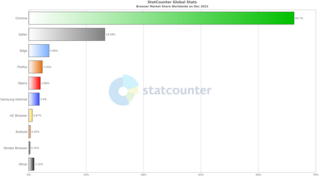
The usage share of web browsers is the portion, often expressed as a percentage, of visitors to a group of web sites that use a particular web browser.

Accurate demographics of atheism are difficult to obtain since conceptions of atheism vary considerably across different cultures and languages, ranging from an active concept to being unimportant or not developed. Also in some countries and regions atheism carries a strong stigma, making it harder to count atheists in these countries. In global studies, the number of people without a religion is usually higher than the number of people without a belief in a deity and the number of people who agree with statements on lacking a belief in a deity is usually higher than the number of people who self-identify as "atheists".

Before the era of internet business in Indonesia, internet connections could only be found at a few leading universities. By using UUCP, university servers in Indonesia exchange information with other university servers in the world through their respective gateways. In 1994, the internet business in Indonesia was started, marked by the granting of an internet service provider (ISP) company license issued by the Indonesian government to PT. Rahajasa Media Internet or RADNET.

The usage share of an operating system is the percentage of computers that run that operating system (OS). These statistics are estimates as wide scale OS usage data is difficult to obtain and measure. Reliable primary sources are limited and data collection methodology is not formally agreed. Currently devices connected to the internet allow for web data collection to approximately measure OS usage.

Use of the Internet in Venezuela has greatly expanded, but is mostly concentrated among younger, educated city residents, and centered on the capital, Caracas. According to several experts, the lack of quality Internet in Venezuela, which includes the slowest speed in Latin America and one of the slowest Internet speeds in the world, is due to the poor infrastructure of the country.

The Internet in Vietnam is growing rapidly. Between 2001 and 2005, the number of Internet users increased from 800,000 to 3 million. By 2007, Vietnam reported Internet penetration levels of 11.5%, rising to 22.4 percent in 2008 and 45.2% in 2010. By 2013, Vietnam officials reported Internet penetration levels of 75.2%, which is about 68 million users with Wifi signals that can be found anywhere in every commercial and residential area. As of January 2021, out of its population of over 96 million people, the number of internet users reached approximately 69 million. Internet usage in Vietnam is predominantly mobile-based, thanks to the high smartphone penetration rate. Using the internet has become a daily habit among many Vietnamese people, with multiple purposes including work, study, entertainment, and more.

<span class="mw-page-title-main">Mobile phone</span> Portable device to make telephone calls using a radio link

A mobile phone is a portable telephone that can make and receive calls over a radio frequency link while the user is moving within a telephone service area, as opposed to a fixed-location phone. The radio frequency link establishes a connection to the switching systems of a mobile phone operator, which provides access to the public switched telephone network (PSTN). Modern mobile telephone services use a cellular network architecture, and therefore mobile telephones are called cellphones in North America. In addition to telephony, digital mobile phones support a variety of other services, such as text messaging, multimedia messaging, email, Internet access, short-range wireless communications, satellite access, business applications, payments, multimedia playback and streaming, digital photography, and video games. Mobile phones offering only basic capabilities are known as feature phones ; mobile phones that offer greatly advanced computing capabilities are referred to as smartphones.

With the application of probability sampling in the 1930s, surveys became a standard tool for empirical research in social sciences, marketing, and official statistics. The methods involved in survey data collection are any of a number of ways in which data can be collected for a statistical survey. These are methods that are used to collect information from a sample of individuals in a systematic way. First there was the change from traditional paper-and-pencil interviewing (PAPI) to computer-assisted interviewing (CAI). Now, face-to-face surveys (CAPI), telephone surveys (CATI), and mail surveys are increasingly replaced by web surveys. In addition, remote interviewers could possibly keep the respondent engaged while reducing cost as compared to in-person interviewers.

The Latin American video game market has been rapidly growing since the early 2010's. In 2016, the market had already overtaken those in music, magazines and radio.

The Global Social Mobility Index is an index prepared by the World Economic Forum. The inaugural index from 2020 ranked 82 countries and has not been updated since. The Index measures social mobility holistically through 5 determinants. The findings from the index were then used in the World Economic Forum's Global Social Mobility Report 2020, which provided recommendations for governments and businesses. Researchers have used the index to analyze income inequality and have determined reasons for countries to improve social mobility.

References

  1. "Newzoo | The Destination for Games Market Insights". Newzoo. Retrieved 2021-07-18.
  2. 1 2 newzoo. "Top Countries by Smartphone Users". newzoo. Retrieved 16 November 2022.
  3. "Top Countries/Markets by Smartphone Penetration & Users". Newzoo. Retrieved 2021-07-18.
  4. "Newzoo Global Mobile Market Report 2019 - Light Version". Archived from the original on 3 August 2020. Retrieved 26 June 2020.
  5. "Newzoo Global Mobile Market Report 2018 - Light Version". Archived from the original on 8 January 2020. Retrieved 26 June 2020.
  6. "Newzoo Global Mobile Market Report 2017 - Light Version". Archived from the original on 3 August 2020. Retrieved 26 June 2020.
  7. 1 2 Poushter, Jacob (22 February 2016). "Smartphone Ownership and Internet Usage Continues to Climb in Emerging Economies | Pew Research Center". Pewglobal.org. Archived from the original on 2016-02-23. Retrieved 2016-02-23.
  8. 1 2 "Denmark's Smartphone Market Nears Saturation". eMarketer. Archived from the original on 2015-06-21. Retrieved 2015-06-18.
  9. "Think with Google". Think with Google. Archived from the original on 2015-11-08. Retrieved 2016-03-20.
  10. By Zoe Fox2013-08-27 14:52:34 UTC (2013-08-27). "The 15 Countries With the Highest Smartphone Pentration". Mashable.com. Archived from the original on 2018-12-26. Retrieved 2016-03-20.{{cite web}}: CS1 maint: numeric names: authors list (link)