List of Croatian counties by GDP

Last updated
The share of individual county GDPs in Croatia's total GDP, 2009. Croatia counties GDP share 2009.png
The share of individual county GDPs in Croatia's total GDP, 2009.

Gross domestic product (GDP) of the counties of Croatia significantly varies from one county to another as economic development of Croatia varies substantially between Croatia's geographic regions reflecting historic developments, infrastructure available, especially routes of transportation, and diverse geographic setting of various parts of the country, especially in respect of areas situated along the Adriatic Sea shores, where tourism represents a major source of income.

Contents

Croatian counties by GDP (PPS) per inhabitant

Croatian counties by GDP (PPS) per capita, 2018 Croatian counties by GDP (PPS) per capita, 2019.png
Croatian counties by GDP (PPS) per capita, 2018
RankCounty2022
(in EUR) [1] [2]
2022
(in percentage of EU average)
1 Flag of Zagreb.svg City of Zagreb 44,700126
2 Zastava Istarske zupanije.svg Istria 30,50086
3 Flag of Primorje-Gorski Kotar County.png Primorje-Gorski Kotar 29,80084
4 Flag of Dubrovnik-Neretva County.png Dubrovnik-Neretva 26,30074
-Flag of Croatia.svg  Croatia 26,20074
5 Flag of Varazdin County.png Varaždin 22,90065
6 Flag of Medjimurje.svg Međimurje 22,50063
7 Flag of Zadar County.png Zadar 22,20063
8 Flag of Lika-Senj County.svg Lika-Senj 22,20063
9 Flag of Sibenik County.svg Šibenik-Knin 21,50061
10 Flag of Zagreb County.svg Zagreb County 21,30060
11 Zastava Osjecko-baranjske zupanije.png Osijek-Baranja 20,70058
12 Flag of Split-Dalmatia County.svg Split-Dalmatia 20,40058
13 Flag of Karlovac county.svg Karlovac 19,20054
14 Flag of Koprivnica-Krizevci County.png Koprivnica-Križevci 19,20054
15 Zastava bjelovarsko bilogorske zupanije.gif Bjelovar-Bilogora 18,60053
16 Flag of Sisak-Moslavina County.png Sisak-Moslavina 18,20051
17 Flag of Vukovar-Syrmia County.svg Vukovar-Syrmia 16,80047
18 Flag of Krapina-Zagorje-County.svg Krapina-Zagorje 16,50047
19 Flag of Brod-Posavina County.svg Brod-Posavina 15,90045
20 Flag of Virovitica-Podravina County.png Virovitica-Podravina 15,60044
21 Flag of Pozega-Slavonia County.png Požega-Slavonia 15,00042

Dynamics

The Croatian economy is significantly centralized, as the bulk of its GDP (31.4%) is generated within the nation's capital and the most populous city—Zagreb. [3] The city administered area covers 1.1% of territory, [4] and encompasses 18.4% of Croatia's population. [5]

According to 2009 data, by far the largest GDP is generated in the city of Zagreb, which is constituted as a county and a city at the same time. [4] GDP of the city of Zagreb amounts to 14,079 billion Euro, surpassing the second ranked county in terms of GDP—Split-Dalmatia County—by more than 10 billion Euro. The Split-Dalmatia is closely followed by Primorje-Gorski Kotar County, the two counties centering on the second and third largest cities in Croatia—Split and Rijeka—and benefiting from considerable trade, processing industry, and tourism. [6] [7]

The two counties contribute 8.6% and 8.4% of Croatia's GDP respectively. Three following counties, ranked by the GDP, are Istria, Osijek-Baranja and Zagreb counties—the latter encompassing territory surrounding the capital. The lowest GDP is achieved by Lika-Senj, Požega-Slavonia and Virovitica-Podravina counties. The low figures, ranging from 435 to 561 million Euro are consequence of not only low level of economic development, but also of low populations of the counties.

All the counties recorded steady growth of their GDP until 2008, when the values peaked. Between 2000 and 2008 Croatian GDP grew by 105%, but growth of economy in the individual counties was not uniform—the growth in the period ranged from 60% recorded in the Sisak-Moslavina County to as much as 154% in the Zadar County. The greatest growth rate in the period, besides the Zadar County, was achieved by Dubrovnik-Neretva (135%) and Šibenik-Knin counties as well as the city of Zagreb (120%). In 2009, Croatian GDP fell by 5.5%, with similarly uneven variation of the county GDP figures. The largest drops were recorded in Virovitica-Podravina (−15.1%), Lika-Senj (−11.6%), Šibenik-Knin (−11.4%) and Krapina-Zagorje (−11.3%) counties. The lowest rate of economic decline was observed in Istria (−2.5%), Zagreb (−2.6%) and Sisak-Moslavina (−2.6%) counties. [8]

Croatian counties by GDP

Counties of Croatia by GDP, in million Euro
County20002001200220032004200520062007200820092010201120122013201420152016201720182019
Zastava bjelovarsko bilogorske zupanije.gif Bjelovar-Bilogora 520569639645688698800804953917834823786790789809855874925971
Flag of Brod-Posavina County.svg Brod-Posavina 5646286877137797718499181,0329529149178958888538799179691,0161,130
Flag of Dubrovnik-Neretva County.png Dubrovnik-Neretva 5736306767548839771,0831,2921,3401,2671,2481,2081,2021,2341,2601,3131,4031,5321,5871,789
Zastava Istarske zupanije.svg Istria 1,4201,6141,8141,9802,1822,2912,4822,7292,8422,7682,7732,7622,6352,6312,6662,7472,9473,1063,1623,343
Flag of Karlovac county.svg Karlovac 5867137857587778359431,0481,1079989699789489619349611,0081,0311,0351,098
Flag of Koprivnica-Krizevci County.png Koprivnica-Križevci 7237628308458538559881,0461,0699989359269069199059169619919791,076
Flag of Krapina-Zagorje-County.svg Krapina-Zagorje 5696556817067298158589479748688078158038238378679289901,0211,116
Flag of Lika-Senj County.svg Lika-Senj 235250309384522407429417491445416405382388379388402427436478
Flag of Medjimurje.svg Međimurje 5105626446546917378418921,0349779339419291,0889599861,0451,1091,1421,255
Zastava Osjecko-baranjske zupanije.png Osijek-Baranja 1,3521,4591,6681,7001,8722,0432,2492,6002,8342,6422,5072,5142,4212,4382,3752,4362,5442,5812,5722,793
Flag of Pozega-Slavonia County.png Požega-Slavonia 325355380420451464478508554504497482458461433440453466499545
Flag of Primorje-Gorski Kotar County.png Primorje-Gorski Kotar 2,1112,1382,2612,5432,6853,0663,3713,5604,0603,8203,8223,9053,9813,8493,8493,8543,9614,1774,2704,306
Flag of Sisak-Moslavina County.png Sisak-Moslavina 9259389729891,0331,1371,3351,2621,4351,4471,4511,4391,4341,3061,2211,2681,2471,2661,3091,416
Flag of Split-Dalmatia County.svg Split-Dalmatia 1,9242,1182,3182,5292,8983,0613,4273,9344,1153,8043,7883,6953,5783,5833,5813,7123,9134,1334,2784,819
Flag of Sibenik County.svg Šibenik-Knin 4234505115816597487659029238028598568358518528629039881,0271,124
Flag of Varazdin County.png Varaždin 8949961,1391,1751,1661,2291,3471,4511,6371,5491,4631,4561,4361,4671,4621,5061,6011,7181,8652,014
Flag of Virovitica-Podravina County.png Virovitica-Podravina 357406438458471476555590615546516526504496455460485500536580
Flag of Vukovar-Syrmia County.svg Vukovar-Syrmia 6246867628168649281,0791,1091,2601,1711,0901,0921,0491,0489991,0311,0761,1201,1711,299
Flag of Zadar County.png Zadar 6277338299821,0551,1661,2381,4431,6181,4781,4051,3831,3661,3861,3951,4451,5271,6711,7971,940
Flag of Zagreb County.svg Zagreb County 1,2841,2721,5831,6531,8232,0592,1282,4192,6532,5552,3982,4492,4392,4502,4662,5492,6512,8323,0113,333
Flag of Zagreb.svg City of Zagreb 6,9127,8068,5699,45810,40011,71712,95414,05915,43914,56115,58615,38315,05514,77814,75415,20615,81816,78217,54419,178
Source: Croatian Bureau of Statistics [9]

County nominal GDP per capita

The ranking of individual county GDP per capita within Croatia, 2000-2009. Croatia counties GDP per capita rank 2000 2009.png
The ranking of individual county GDP per capita within Croatia, 2000–2009.

The highest nominal GDP per capita is recorded in the City of Zagreb at 22,695  Euro in 2018. The second, third and fourth ranked counties in terms of the GDP per capita are Istria, Primorje-Gorski Kotar and Dubrovnik-Neretva, at 15,570 Euro, 14,797 Euro and 13,277 Euro respectively. The four are the only counties of Croatia enjoying GDP per capita exceeding national average of 12,270 Euro. The lowest GDP per capita is recorded in the Virovitica-Podravina (6,525 Euro), Brod-Posavina (6,607 Euro) and Požega-Slavonia (6,620 Euro) counties. [10] The city of Zagreb ranks first among and the counties of Croatia in terms of the GDP per capita continuously since 2000. The Istria County or the Primorje-Gorski Kotar County rank the second and third throughout the period except in 2004, when the Lika-Senj County takes third place. The largest net change of the ranking was achieved by the Šibenik-Knin County, improving its ranking by 11 places since 2000 when its GDP per capita was the 19th largest in Croatia. The Brod-Posavina, Požega-Slavonia, Virovitica-Podravina and Vukovar-Syrmia counties occupy the last four rankings continuously since 2000. [11]

Counties of Croatia by GDP per capita, in Euro
County20002001200220032004200520062007200820092010201120122013201420152016201720182019
Zastava bjelovarsko bilogorske zupanije.gif Bjelovar-Bilogora 4,0074,3834,9515,0425,4175,5396,3956,4897,7567,5226,9076,8886,6576,7666,8297,1077,6477,9587,9869,132
Flag of Brod-Posavina County.svg Brod-Posavina 3,4253,8124,1714,3454,7664,7315,2235,6606,3845,9215,7315,7895,6915,7005,5395,8106,1956,7266,6078,211
Flag of Dubrovnik-Neretva County.png Dubrovnik-Neretva 4,8865,3735,7386,3787,4428,1979,02510,69811,02410,35110,1749,8559,81210,08310,29710,73711,50012,60813,27714,673
Zastava Istarske zupanije.svg Istria 7,1848,1609,1179,88010,81311,26712,11613,22113,69113,28513,29713,27012,68412,66512,81113,19914,16514,91515,57015,960
Flag of Karlovac county.svg Karlovac 4,1815,0825,6355,4915,6666,1396,9897,8308,3417,5987,4587,6157,4617,6517,5417,8688,3738,7018,3019,510
Flag of Koprivnica-Krizevci County.png Koprivnica-Križevci 5,9556,2696,8587,0257,1347,1818,3358,8789,1088,5458,0528,0207,8908,0397,9698,1498,6609,0668,71110,110
Flag of Krapina-Zagorje-County.svg Krapina-Zagorje 4,0894,7024,9195,1295,3235,9726,3137,0087,2506,4796,0496,1426,0916,2876,4396,7217,2657,8307,9198,954
Flag of Lika-Senj County.svg Lika-Senj 4,2194,4935,5826,9659,4667,4467,9277,7839,2778,5158,0917,9847,6527,8747,8128,1348,5719,2978,87810,725
Flag of Medjimurje.svg Međimurje 4,4724,9305,6445,7296,0566,4597,3757,8309,0868,5838,1968,2738,1769,5928,4808,7519,3289,98910,30211,476
Zastava Osjecko-baranjske zupanije.png Osijek-Baranja 4,2474,5825,2395,3545,9146,4807,1748,3539,1628,5788,1838,2497,9908,1057,9658,2708,7799,0988,68410,232
Flag of Pozega-Slavonia County.png Požega-Slavonia 3,9044,2554,5725,0665,4795,6585,8746,2866,8976,3306,3146,1945,9716,0815,7745,9736,3076,6816,6208,217
Flag of Primorje-Gorski Kotar County.png Primorje-Gorski Kotar 7,1237,2107,6228,5759,05110,32611,33711,95913,64212,84712,87313,18513,47413,06113,10313,20413,68614,55914,79715,232
Flag of Sisak-Moslavina County.png Sisak-Moslavina 4,8844,9525,1585,2855,5526,1567,2926,9668,0188,1848,3218,3728,4657,8327,4597,8997,9398,2847,8689,706
Flag of Split-Dalmatia County.svg Split-Dalmatia 4,4224,8665,2785,7236,5086,8207,5938,6849,0598,3618,3238,1217,8667,8767,8768,1848,6559,1839,63610,759
Flag of Sibenik County.svg Šibenik-Knin 3,8554,0944,6315,2545,9466,7336,8638,0818,2627,2027,7887,8557,7647,9988,0868,2678,7769,7379,71311,325
Flag of Varazdin County.png Varaždin 4,9525,5166,3276,5506,5256,8907,5648,1659,2338,7588,2988,2818,1938,4128,4348,7529,38910,17610,89912,112
Flag of Virovitica-Podravina County.png Virovitica-Podravina 3,8874,4164,7935,0295,2225,3296,2536,7037,0486,3266,0376,2136,0125,9795,5425,7046,1356,4806,5257,869
Flag of Vukovar-Syrmia County.svg Vukovar-Syrmia 3,2773,6044,0184,3304,6174,9855,8256,0126,8536,4016,0166,0945,8565,9615,7726,0826,4986,9996,7308,606
Flag of Zadar County.png Zadar 4,0504,7265,2896,1936,5797,1867,5348,6769,6408,7528,2818,1147,9858,0848,1468,4789,0039,90110,80311,544
Flag of Zagreb County.svg Zagreb County 4,3274,2835,2795,4595,9666,6866,8597,7458,4438,0897,5657,7037,6607,6877,7488,0508,4349,0839,71010,769
Flag of Zagreb.svg City of Zagreb 8,96210,11411,09112,23813,41815,08216,64218,00519,70918,52619,76519,45318,98618,57818,47918,99219,71120,87922,69523,742
Source: [12]

See also

Related Research Articles

<span class="mw-page-title-main">Slavonia</span> Historical region of Croatia

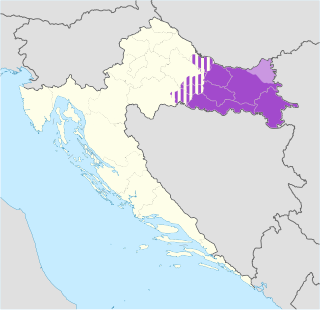
Slavonia is, with Dalmatia, Croatia proper, and Istria, one of the four historical regions of Croatia. Located in the Pannonian Plain and taking up the east of the country, it roughly corresponds with five Croatian counties: Brod-Posavina, Osijek-Baranja, Požega-Slavonia, Virovitica-Podravina, and Vukovar-Syrmia, although the territory of the counties includes Baranya, and the definition of the western extent of Slavonia as a region varies. The counties cover 12,556 square kilometres or 22.2% of Croatia, inhabited by 806,192—18.8% of Croatia's population. The largest city in the region is Osijek, followed by Slavonski Brod and Vinkovci.

<span class="mw-page-title-main">Primorje-Gorski Kotar County</span> County in western Croatia

Primorje – Gorski Kotar County is a county in western Croatia, most of it based in the historical and cultural region called Croatia proper and some of it in Istria, that includes the Bay of Kvarner, the surrounding Northern Croatian Littoral, and the mountainous region of Gorski Kotar. Its center is Rijeka. The county's population was 296,195 at the 2011 census.

<span class="mw-page-title-main">Modruš-Rijeka County</span> Historic county of the Kingdom of Croatia-Slavonia

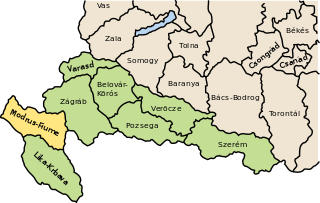
The Modruš-Rijeka County was a historic administrative subdivision of the Kingdom of Croatia-Slavonia. Croatia-Slavonia was an autonomous kingdom within the Lands of the Crown of Saint Stephen (Transleithania), the Hungarian part of the dual Austro-Hungarian Empire. Its territory is now in western Croatia. Modruš is a small town near Ogulin; Rijeka is a large city on the Adriatic coast. However, Rijeka was not part of the Modruš-Rijeka County, but under the direct administration of Hungary. The capital of the county was Ogulin.

A Kraj is the highest-level administrative unit in the Czech Republic and the Slovak Republic. For lack of other English expressions, the Slavic term is often translated as "province", "region", or "territory", although it approximately means "(part of) country", or "(part of) countryside". A kraj is subdivided into okresy ("districts").

<span class="mw-page-title-main">Regions of Croatia</span> Historical and cultural division of Croatia

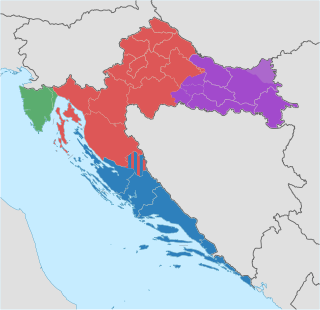
The Republic of Croatia is administratively organised into twenty counties, and is also traditionally divided into four historical and cultural regions: Croatia proper, Dalmatia, Istria, and Slavonia. These are further divided into other, smaller regions.

<span class="mw-page-title-main">Counties of Croatia</span> First-level administrative division of Croatia

The counties of Croatia are the first-level administrative subdivisions of the Republic of Croatia. Since they were re-established in 1992, Croatia has been divided into 20 counties and the capital city of Zagreb, which has the authority and legal status of both a county and a city. As of 2015, the counties are subdivided into 128 cities and 428 municipalities. The divisions have changed over time since the medieval Croatian state. They reflected territorial losses and expansions; changes in the political status of Dalmatia, Dubrovnik and Istria; and political circumstances, including the personal union and subsequent development of relations between the Kingdom of Croatia-Slavonia and the Kingdom of Hungary.

<span class="mw-page-title-main">Croatian Littoral</span> Geographical region of Croatia

Croatian Littoral is a historical name for the region of Croatia comprising mostly the coastal areas between traditional Dalmatia to the south, Mountainous Croatia to the north, Istria and the Kvarner Gulf of the Adriatic Sea to the west. The term "Croatian Littoral" developed in the 18th and 19th centuries, reflecting the complex development of Croatia in historical and geographical terms.

<span class="mw-page-title-main">Central Croatia</span> Historical region of Croatia

In contemporary geography, the terms Central Croatia and Mountainous Croatia are used to describe most of the area sometimes historically known as Croatia or Croatia proper, one of the four historical regions of the Republic of Croatia, together with Dalmatia, Istria, and Slavonia. It is located between Slavonia in the east, the Adriatic Sea in the west, and Dalmatia to the south. The region is not officially defined, and its borders and extent are described differently by various sources. The term Central Croatia refers to the northeastern part, and the term Mountainous Croatia refers to the southwestern part of the territory; the far western part is known as the Croatian Littoral; likewise the terms 'Zagreb macroregion' and 'Rijeka macroregion' can be used instead. Central Croatia is the most significant economic area of the country, contributing well over 50% of Croatia's gross domestic product. The capital of the Republic of Croatia, Zagreb, is the largest city and most important economic centre in Central Croatia.

The subdivisions of Croatia on the first level are the 20 counties and one city-county.

Knežević is a Serbian, Croatian, Montenegrin and Bosnian surname, derived from the title of knez. It may refer to:

<span class="mw-page-title-main">Outline of Croatia</span> Overview of and topical guide to Croatia

The following outline is provided as an overview of and topical guide to Croatia:

<span class="mw-page-title-main">Croatian Parliament electoral districts</span> Territorial subdivisions of Croatia for parliamentary elections

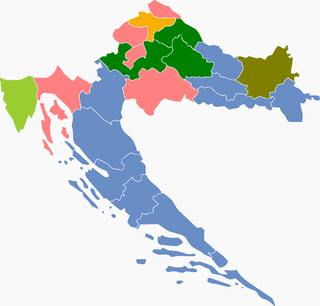
The Croatian Parliament electoral districts are the special territorial subdivision of Croatia used for the country's parliamentary elections.

<span class="mw-page-title-main">2009 Croatian local elections</span>

Local elections were held in Croatia on 17 May 2009, with the second round held on 31 May where necessary.

Local elections were held in Croatia on 15 May 2005. This was fourth local elections in Croatian since independence.

The Fourth Football League Rijeka or Četvrta nogometna liga Rijeka (Croatian), or simply 4. NL Rijeka, is a fifth tier league competition in the Croatian football league system. The league was formed in 2014, after two divisions of 3. HNL were merged into a new 3. HNL West, resulting in relegation of numerous clubs. The league covers clubs from Istria County, Primorje-Gorski Kotar County and Lika-Senj county.

<span class="mw-page-title-main">Industry of Croatia</span>

Industry of Croatia plays an important role in the country's economy. It has a longstanding tradition based since the 19th century on agriculture, forestry and mining. Many industrial branches developed at that time, like wood industry, food manufacturing, potash production, shipbuilding, leather and footwear production, textile industry, and others. Today, the industrial sectors in Croatia are food and beverage industry, metal processing and machine industry, including vehicles (20%), coke and refined petroleum production (17%), chemical, pharmaceutical, rubber and plastics industry (11%), wood, furniture and paper manufacturing (9%), electrical equipment, electronics and optics fabrication (9%), textile, clothing and footwear industry (5%) as well as construction and building materials production (5%).

This article documents the timeline of the COVID-19 pandemic in Croatia.

Local elections were held in Croatia on 7 February 1993. This was first local elections in Croatia after declaration of independence and breakaway from Yugoslavia. Also this was first election under new law which abolished the Council of Local Communities, the Socio-Political Council and the Council of Associated Labor at the level of towns and municipalities, and introduced counties into use.

Local elections were held in Croatia on 13 April 1997. This was first local elections in Croatia after the end of war and unification of the territory. In the area of Eastern Slavonia, Baranja and Western Syrmia the elections were conducted with the support and supervision of the United Nations Transitional Administration for Eastern Slavonia, Baranja and Western Sirmium.

Local elections were held in Croatia on 25 May 2001. This was third local elections in Croatian since independence and for the first time since democratization.

References

  1. "Popularion estimte of Republic of Croatia, 2021" (PDF). dzs.hr/. Retrieved 2024-02-20.
  2. "GDP (PPS) per inhabitant (Euro)". ec.europa.eu/. Retrieved 2024-02-20.
  3. "Gross domestic product for Republic of Croatia, statistical regions at level 2 and counties, 2009". Priopćenje DZS. Zagreb: Croatian Bureau of Statistics. 49 (12.1.2). 14 March 2012. ISSN   1330-0350.
  4. 1 2 Ostroški, Ljiljana, ed. (December 2015). Statistički ljetopis Republike Hrvatske 2015 [Statistical Yearbook of the Republic of Croatia 2015](PDF). Statistical Yearbook of the Republic of Croatia (in Croatian and English). Vol. 47. Zagreb: Croatian Bureau of Statistics. p. 62. ISSN   1333-3305 . Retrieved 27 December 2015.
  5. "Population by Age and Sex, by Settlements, 2011 Census". Census of Population, Households and Dwellings 2011. Zagreb: Croatian Bureau of Statistics. December 2012.
  6. "Gospodarski profil županije" [Economic profile of the county] (in Croatian). Croatian Chamber of Economy . Retrieved 9 June 2012.
  7. "Gospodarski profil županije Splitsko-dalmatinske" [Economic profile of the Split-Dalmatia County](PDF) (in Croatian). Croatian Chamber of Economy. Archived from the original (PDF) on 3 December 2008. Retrieved 9 June 2012.
  8. "Gross domestic product - Review by countries 2000-2018". dzs.hr. Retrieved 19 July 2021.
  9. "Gross domestic product - Review by countries 2000-2019". dzs.hr/ (in Croatian). Retrieved 2022-02-15.
  10. "Gross domestic product - Review by countries 2000-2018". dzs.hr. Retrieved 19 July 2021.
  11. "Gross domestic product - Review by countries 2000-2018". dzs.hr. Retrieved 19 July 2021.
  12. "Gross domestic product - Review by countries 2000-2019". dzs.hr/ (in Croatian). Retrieved 2022-02-15.