List of Asian states by GDP growth

Last updated

This is a list of estimates of the real gross domestic product growth rate (not rebased GDP) in Asian states for the latest years recorded in the CIA World Factbook. All sovereign states with United Nations membership and territory in Asia are included on the list apart from those who are also members of the Council of Europe. In addition, the list includes the special administrative regions of China (Hong Kong and Macao) and Taiwan. [1] Dependent territories of non-Asian states are excluded.

Contents

List

Real GDP Growth Rates in Asia [2]
RankCountryGDP growth
rate (%)
Year
1Flag of the Philippines.svg  Philippines 6.92017 est.
2Flag of Bangladesh.svg  Bangladesh 8.132017 est.
3Flag of Nepal.svg    Nepal 7.92017 est.
3Flag of Bhutan.svg  Bhutan 7.42017 est.
5Flag of Tajikistan.svg  Tajikistan 7.12017 est.
6Flag of Cambodia.svg  Cambodia 6.92017 est.
6Flag of the People's Republic of China.svg  China 6.92017 est.
6Flag of Laos.svg  Laos 6.92017 est.
9Flag of Myanmar.svg  Myanmar 6.82017 est.
9Flag of Vietnam.svg  Vietnam 6.82017 est.
11Flag of India.svg  India 6.72017 est.
11Flag of Macau.svg  Macau 6.72017 est.
13Flag of Turkmenistan.svg  Turkmenistan 6.52017 est.
14Flag of Malaysia.svg  Malaysia 5.92017 est.
15Flag of Pakistan.svg  Pakistan 5.42017 est.
16Flag of Uzbekistan.svg  Uzbekistan 5.32017 est.
17Flag of Indonesia.svg  Indonesia 5.12017 est.
17Flag of Mongolia.svg  Mongolia 5.12017 est.
19Flag of Maldives.svg  Maldives 4.82017 est.
20Flag of Kyrgyzstan.svg  Kyrgyzstan 4.62017 est.
21Flag of Kazakhstan.svg  Kazakhstan 4.02017 est.
22Flag of Thailand.svg  Thailand 3.92017 est.
23Flag of Bahrain.svg  Bahrain 3.82017 est.
23Flag of Hong Kong.svg  Hong Kong 3.82017 est.
25Flag of Iran.svg  Iran 3.72017 est.
26Flag of Singapore.svg  Singapore 3.62017 est.
27Flag of Israel.svg  Israel 3.32017 est.
27Flag of Sri Lanka.svg  Sri Lanka 3.32017 est.
29Flag of South Korea.svg  Korea, South 3.12017 est.
30Flag of the Republic of China.svg  Taiwan 2.92017 est.
31Flag of the Taliban.svg  Afghanistan 2.72017 est.
32Flag of Jordan.svg  Jordan 2.02017 est.
33Flag of Brunei.svg  Brunei 1.32017 est.
33Flag of Japan.svg  Japan 1.72017 est.
35Flag of Qatar.svg  Qatar 1.62017 est.
36Flag of Lebanon.svg  Lebanon 1.52017 est.
37Flag of the United Arab Emirates.svg  United Arab Emirates 0.82017 est.
38Flag of Oman.svg  Oman -0.92017 est.
38Flag of Saudi Arabia.svg  Saudi Arabia -0.92017 est.
40Flag of North Korea.svg  Korea, North -1.12015 est.
41Flag of Iraq.svg  Iraq -2.12017 est.
42Flag of Kuwait.svg  Kuwait -3.32017 est.
43Flag of East Timor.svg  Timor-Leste -4.62017 est.
44Flag of Yemen.svg  Yemen -5.92016 est.
45Flag of Syria.svg  Syria -36.52014 est.

Regions

Middle East
RankCountryGDP growth
rate (%)
1Flag of Bahrain.svg  Bahrain 3.8
2Flag of Iran.svg  Iran 3.7
3Flag of Israel.svg  Israel 3.3
4Flag of Jordan.svg  Jordan 2.0
5Flag of Qatar.svg  Qatar 1.6
6Flag of Lebanon.svg  Lebanon 1.5
7Flag of the United Arab Emirates.svg  United Arab Emirates 0.8
8Flag of Oman.svg  Oman -0.9
9Flag of Saudi Arabia.svg  Saudi Arabia -0.9
10Flag of Iraq.svg  Iraq -2.1
11Flag of Kuwait.svg  Kuwait -3.3
12Flag of Yemen.svg  Yemen -5.9
13Flag of Palestine.svg  Palestine -21.59
14Flag of Syria.svg  Syria -36.5
South Asia
RankCountryGDP growth
rate (%)
1Flag of Nepal.svg    Nepal 7.9
2Flag of Bangladesh.svg  Bangladesh 7.4
3Flag of Bhutan.svg  Bhutan 7.4
4Flag of India.svg  India 6.7
5Flag of Pakistan.svg  Pakistan 5.4
6Flag of Maldives.svg  Maldives 4.8
7Flag of Sri Lanka.svg  Sri Lanka 3.3
8Flag of the Taliban.svg  Afghanistan 2.7
Southeast Asia
RankCountryGDP growth
rate (%)
1Flag of the Philippines.svg  Philippines 6.9
1Flag of Laos.svg  Laos 6.9
3Flag of Myanmar.svg  Myanmar 6.8
3Flag of Vietnam.svg  Vietnam 6.8
5Flag of Cambodia.svg  Cambodia 6.7
6Flag of Malaysia.svg  Malaysia 5.9
7Flag of Indonesia.svg  Indonesia 5.1
8Flag of Thailand.svg  Thailand 3.9
9Flag of Singapore.svg  Singapore 3.6
10Flag of Brunei.svg  Brunei 1.3
11Flag of East Timor.svg  Timor-Leste -4.6

See also

Related Research Articles

The World Factbook, also known as the CIA World Factbook, is a reference resource produced by the Central Intelligence Agency (CIA) with almanac-style information about the countries of the world. The official print version is available from the Government Publishing Office. The Factbook is available in the form of a website that is partially updated every week. It is also available for download for use off-line. It provides a two- to three-page summary of the demographics, geography, communications, government, economy, and military of 266 international entities including U.S.-recognized countries, dependencies, and other areas in the world.

<span class="mw-page-title-main">Developed country</span> Country with a developed industry and infrastructure

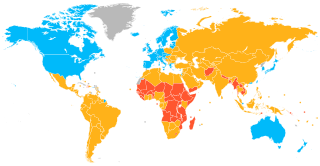
A developed country is a sovereign state that has a high quality of life, developed economy and advanced technological infrastructure relative to other less industrialized nations. Most commonly, the criteria for evaluating the degree of economic development are gross domestic product (GDP), gross national product (GNP), the per capita income, level of industrialization, amount of widespread infrastructure and general standard of living. Which criteria are to be used and which countries can be classified as being developed are subjects of debate. Different definitions of developed countries are provided by the International Monetary Fund and the World Bank; moreover, HDI ranking is used to reflect the composite index of life expectancy, education, and income per capita. Another commonly used measure of a developed country is the threshold of GDP (PPP) per capita of at least USD$22,000. In 2022, 36 countries fit all four criteria, while an additional 17 countries fit three out of four.

<span class="mw-page-title-main">Financial and social rankings of sovereign states in Europe</span> Overview of financial and social rankings of the sovereign states in Europe

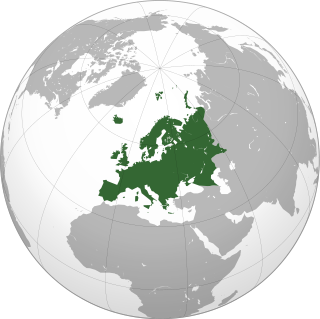
This page compares the sovereign states of Europe on economic, financial and social indicators.

<span class="mw-page-title-main">Economy of Central America</span> Overview of the economy of Central America

The economy of Central America is the eleventh-largest economy in Latin America, behind Brazil, Mexico, Argentina and Colombia. According to the World Bank, the nominal GDP of Central America reached 204 billion US dollar in 2010, as recovery from the crisis of 2009, where gross domestic product (GDP) suffered a decline to 3.8%. The major economic sectors are agriculture and tourism, although the industrial sector has shown strong growth, mainly in Panama.

<span class="mw-page-title-main">Islam by country</span>

Adherents of Islam constitute the world's second largest religious group. A projection by the PEW suggests that Muslims numbered approximately 1.9 billion followers in 2020. Studies in the 21st century suggest that, in terms of percentage and worldwide spread, Islam is the fastest-growing major religion in the world, mostly because Muslims have more children than other major religious groups. Most Muslims are either of two denominations: Sunni or Shia. Islam is the majority religion in several subregions: Central Asia, West Asia, North Africa, West Africa, the Sahel, and the Middle East. The diverse Asia-Pacific region contains the highest number of Muslims in the world, easily surpassing the combined Middle East and North Africa.

References

  1. The recognition of Taiwan is disputed; most UN-member states officially recognise the sovereignty of the People's Republic of China over Taiwan, however, many maintain non-diplomatic relations with the Republic of China. See Foreign relations of Taiwan.
  2. ""Country Comparison : GDP - Real Growth Rate", CIA World Factbook, accessed 28 November 2018". Cia.gov. Archived from the original on June 13, 2007. Retrieved 2018-11-28.