List of countries by GDP (PPP) per person employed

Last updated

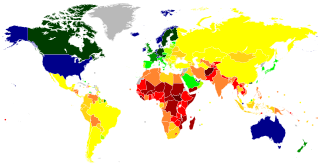
This is a list of countries by their gross domestic product at purchasing power parity per person currently employed.

International Labour Organization (2020−2022) CIA World Factbook [1] [2]
RankCountryGDP per 
person
employed
(2017  Intl. $)
Year
1Flag of Luxembourg.svg  Luxembourg 240,9952022
2Flag of Ireland.svg  Ireland 222,0162022
3Flag of Singapore.svg  Singapore 165,4512022
4Flag of Switzerland (Pantone).svg   Switzerland 131,6942022
5Flag of Brunei.svg  Brunei 130,0832022
6Flag of Qatar.svg  Qatar 129,0262022
7Flag of the United States.svg  United States 128,5022022
8Flag of Norway.svg  Norway 128,0942022
10Flag of Belgium (civil).svg  Belgium 121,4092022
Flag of Hong Kong.svg  Hong Kong 119,4012022
11Flag of Denmark.svg  Denmark 117,1652022
12Flag of Saudi Arabia.svg  Saudi Arabia 114,2152022
13Flag of the Republic of China.svg  Taiwan 113,2092022
14Flag of Guyana.svg  Guyana 113,1752022
15Flag of Austria.svg  Austria 112,5892022
16Flag of Sweden.svg  Sweden 109,7732022
17Flag of the Netherlands.svg  Netherlands 109,5582022
18Flag of Italy.svg  Italy 108,8002022
19Flag of France.svg  France 108,7112022
20Flag of the United Arab Emirates.svg  United Arab Emirates 108,2202022
Flag of Puerto Rico.svg  Puerto Rico 106,0642022
21Flag of Finland.svg  Finland 105,2032022
22Flag of Germany.svg  Germany 105,0322022
23Flag of Israel.svg  Israel 104,2232022
24Flag of Australia (converted).svg  Australia 97,2502022
25Flag of the United Kingdom.svg  United Kingdom 95,4562022
26Flag of Iceland.svg  Iceland 95,2492022
27Flag of Canada (Pantone).svg  Canada 94,6712022
28Flag of Spain.svg  Spain 91,2832022
29Flag of Turkey.svg  Turkey 90,4932022
30Flag of Bahrain.svg  Bahrain 89,9532022
31Flag of Kuwait.svg  Kuwait 89,3512022
32Flag of Slovenia.svg  Slovenia 87,1472022
Flag of Macau.svg  Macao 86,3332022
33Flag of Malta.svg  Malta 85,9672022
34Flag of the Czech Republic.svg  Czech Republic 84,1302022
35Flag of South Korea.svg  Korea, South 82,4082022
36Flag of Greece.svg  Greece 81,3592022
37Flag of Lithuania.svg  Lithuania 80,0962022
38Flag of New Zealand.svg  New Zealand 78,4832022
39Flag of Japan.svg  Japan 78,3552022
40Flag of Estonia.svg  Estonia 77,0762022
41Flag of Croatia.svg  Croatia 75,9642022
42Flag of Romania.svg  Romania 75,8952022
43Flag of Portugal.svg  Portugal 74,3602022
44Flag of Oman.svg  Oman 73,8772022
45Flag of Poland.svg  Poland 70,5232022
46Flag of Hungary.svg  Hungary 69,9582022
47Flag of Panama.svg  Panama 69,3172022
48Flag of Latvia.svg  Latvia 68,5052022
49Flag of Slovakia.svg  Slovakia 63,3432022
50Flag of the Bahamas.svg  Bahamas, The 61,7162022
51Flag of Cyprus.svg  Cyprus 60,5472022
52Flag of Libya.svg  Libya 59,3192022
53Flag of Gabon.svg  Gabon 58,3212022
54Flag of Chile.svg  Chile 58,0712022
55Flag of Russia.svg  Russia 57,6762021
56Flag of Kazakhstan.svg  Kazakhstan 56,0572022
57Flag of Malaysia.svg  Malaysia 55,9332022
58Flag of Montenegro.svg  Montenegro 55,9152022
59Flag of Trinidad and Tobago.svg  Trinidad and Tobago 54,9982022
60Flag of Iran.svg  Iran 53,6822022
61Flag of Bulgaria.svg  Bulgaria 53,5272022
62Flag of Argentina.svg  Argentina 52,0122022
63Flag of Uruguay.svg  Uruguay 50,8042022
64Flag of Costa Rica.svg  Costa Rica 50,5502022
65Flag of Turkmenistan.svg  Turkmenistan 48,7582022
66Flag of Equatorial Guinea.svg  Equatorial Guinea 47,8002022
67Flag of South Africa.svg  South Africa 47,2012022
68Flag of Egypt.svg  Egypt 46,4022022
69Flag of Mauritius.svg  Mauritius 46,0672022
70Flag of Algeria.svg  Algeria 45,6192022
71Flag of Iraq.svg  Iraq 44,9522022
72Flag of Bosnia and Herzegovina.svg  Bosnia and Herzegovina 44,7012022
73Flag of the Dominican Republic.svg  Dominican Republic 44,4602022
74Flag of Serbia.svg  Serbia 44,3242022
75Flag of Botswana.svg  Botswana 43,7712022
76Flag of Mexico.svg  Mexico 43,5152022
77Flag of North Macedonia.svg  North Macedonia 42,9842022
78Flag of Jordan.svg  Jordan 41,9722022
79Flag of Maldives.svg  Maldives 41,3982022
80Flag of Suriname.svg  Suriname 39,5782022
81Flag of Cuba.svg  Cuba 38,3092022
82Flag of Georgia.svg  Georgia 37,4992022
83Flag of Lebanon.svg  Lebanon 37,0852022
84Flag of Tunisia.svg  Tunisia 36,1392022
85Flag of Eswatini.svg  Swaziland 36,0712022
86Flag of Belarus.svg  Belarus 35,7742022
87Flag of Saint Vincent and the Grenadines.svg  Saint Vincent and the Grenadines 35,2482022
88Flag of Colombia.svg  Colombia 35,2002022
89Flag of Armenia.svg  Armenia 34,8692022
90Flag of the People's Republic of China.svg  China 34,1642022
91Flag of Albania.svg  Albania 34,0182022
92Flag of Moldova.svg  Moldova 33,7262022
93Flag of Brazil.svg  Brazil 32,7612022
94Flag of Barbados.svg  Barbados 32,6132022
95Flag of Sri Lanka.svg  Sri Lanka 32,4552022
96Flag of Mongolia.svg  Mongolia 32,0122022
97Flag of Djibouti.svg  Djibouti 31,8712022
98Flag of Thailand.svg  Thailand 31,5232022
99Flag of Namibia.svg  Namibia 31,1992022
100Flag of Azerbaijan.svg  Azerbaijan 30,5822022
101Flag of Saint Lucia.svg  Saint Lucia 30,3942022
102Flag of Fiji.svg  Fiji 29,9852022
103Flag of Ukraine.svg  Ukraine 29,4422021
104Flag of Paraguay.svg  Paraguay 28,8302022
105Flag of Palestine.svg  Palestine 27,1452022
106Flag of Indonesia.svg  Indonesia 25,8292022
107Flag of Venezuela.svg  Venezuela 25,6872022
108Flag of Mauritania.svg  Mauritania 25,4242022
109Flag of Morocco.svg  Morocco 25,1632022
110Flag of Peru.svg  Peru 24,8012022
111Flag of Bhutan.svg  Bhutan 24,4612022
112Flag of Ecuador.svg  Ecuador 22,9032022
113Flag of Guatemala.svg  Guatemala 22,8572022
114Flag of Uzbekistan.svg  Uzbekistan 22,1632022
115Flag of El Salvador.svg  El Salvador 21,9972022
116Flag of the Philippines.svg  Philippines 21,3642022
117Flag of India.svg  India 20,4222022
118Flag of Vietnam.svg  Vietnam 20,1282022
119Flag of Laos.svg  Laos 19,6232022
120Flag of Jamaica.svg  Jamaica 18,8712022
121Bandera de Bolivia (Estado).svg  Bolivia 18,0162022
122Flag of Cape Verde.svg  Cape Verde 17,6062022
123Flag of Tonga.svg  Tonga 17,5892022
124Flag of Pakistan.svg  Pakistan 17,3102022
125Flag of Belize.svg  Belize 16,9122022
126Flag of Samoa.svg  Samoa 16,6792022
127Flag of Tajikistan.svg  Tajikistan 16,6692022
128Flag of Sudan.svg  Sudan 15,7242022
129Flag of Nigeria.svg  Nigeria 15,6952022
130Flag of Nepal.svg    Nepal 15,5122022
131Flag of Angola.svg  Angola 15,4562022
132Flag of Bangladesh.svg  Bangladesh 15,1302022
133Flag of Cote d'Ivoire.svg  Côte d'Ivoire 14,6892022
134Flag of Sao Tome and Principe.svg  São Tomé and Príncipe 14,6252022
135Flag of Yemen.svg  Yemen 13,9282022
136Flag of Honduras.svg  Honduras 13,8252022
137Flag of Kyrgyzstan.svg  Kyrgyzstan 13,5502022
138Flag of Ghana.svg  Ghana 13,2342022
139Flag of Nicaragua.svg  Nicaragua 13,1902022
140Flag of the Comoros.svg  Comoros 13,0842022
141Flag of Papua New Guinea.svg  Papua New Guinea 12,5112022
142Flag of Senegal.svg  Senegal 12,3072022
143Flag of Kenya.svg  Kenya 11,2192022
144Flag of the Republic of the Congo.svg  Congo, Republic of the 10,5442022
145Flag of Zambia.svg  Zambia 9,9582022
146Flag of Benin.svg  Benin 9,6442022
147Flag of the Taliban.svg  Afghanistan 9,5422020
148Flag of Cameroon.svg  Cameroon 9,4292022
149Flag of Guinea.svg  Guinea 9,3342022
150Flag of Syria.svg  Syria 8,9602022
151Flag of Cambodia.svg  Cambodia 8,4432022
152Flag of East Timor.svg  Timor-Leste 8,0622022
153Flag of Rwanda.svg  Rwanda 7,8892022
154Flag of Somalia.svg  Somalia 7,5932022
155Flag of Haiti.svg  Haiti 7,3862022
156Flag of South Sudan.svg  South Sudan 7,3222022
157Flag of Lesotho.svg  Lesotho 6,8902022
158Flag of Vanuatu.svg  Vanuatu 6,7402022
159Flag of Togo.svg  Togo 6,5472022
160Flag of The Gambia.svg  Gambia 6,3832022
161Flag of Burkina Faso.svg  Burkina Faso 6,2932022
162Flag of Uganda.svg  Uganda 6,0942022
163Flag of Mali.svg  Mali 6,0822022
164Flag of Guinea-Bissau.svg  Guinea-Bissau 6,0592022
165Flag of Zimbabwe.svg  Zimbabwe 6,0132022
166Flag of Tanzania.svg  Tanzania 5,7772022
167Flag of Sierra Leone.svg  Sierra Leone 5,1602022
168Flag of Ethiopia.svg  Ethiopia 5,0572022
169Flag of Chad.svg  Chad 4,6112022
170Flag of the Solomon Islands.svg  Solomon Islands 4,5192022
171Flag of Eritrea.svg  Eritrea 4,2792022
172Flag of Malawi.svg  Malawi 3,9872022
173Flag of North Korea.svg  Korea, North 3,9252022
174Flag of Liberia.svg  Liberia 3,2942022
175Flag of the Democratic Republic of the Congo.svg  Congo, Democratic Republic of the 3,2792022
176Flag of Niger.svg  Niger 3,2662022
177Flag of Mozambique.svg  Mozambique 2,9072022
178Flag of Madagascar.svg  Madagascar 2,9052022
179Flag of the Central African Republic.svg  Central African Republic 2,4292022
180Flag of Burundi.svg  Burundi 1,6782022
RankCountryGDP per 
person
employed
(current  Intl. $)
GDP per
capita
(current  Intl. $)
Employed /
total pop.
(%)
Year
1Flag of Luxembourg.svg  Luxembourg 223,30086,500392011 est.
2Flag of Liechtenstein.svg  Liechtenstein 149,900139,500932009
3Flag of Qatar.svg  Qatar 138,20098,300712011 est.
Flag of Bermuda.svg  Bermuda 119,80068,900572004 est.
4Flag of the United States.svg  United States 107,90048,400452011 est.
5Flag of Norway.svg  Norway 104,60056,400542011 est.
6Flag of Austria.svg  Austria 101,40042,800422011 est.
7Flag of Ireland.svg  Ireland 99,80038,900392011 est.
8Flag of Singapore.svg  Singapore 99,80059,900602011 est.
9Flag of Saudi Arabia.svg  Saudi Arabia 99,50025,900262011 est.
Flag of Hong Kong.svg  Hong Kong 98,00049,200502011 est.
10Flag of the Netherlands.svg  Netherlands 95,60042,400442011 est.
11Flag of Belgium (civil).svg  Belgium 88,00039,500452011 est.
12Flag of the Republic of China.svg  Taiwan 82,90038,400462011 est.
13Flag of France.svg  France 82,40034,000412011 est.
14Flag of Switzerland (Pantone).svg   Switzerland 82,30044,600542011 est.
15Flag of Sweden.svg  Sweden 81,90041,700512011 est.
16Flag of Australia (converted).svg  Australia 80,40042,200522011 est.
17Flag of Canada (Pantone).svg  Canada 80,30040,800512011 est.
18Flag of Italy.svg  Italy 79,60029,900382011 est.
19Flag of Finland.svg  Finland 79,50037,400472011 est.
20Flag of Israel.svg  Israel 77,20031,500412011 est.
21Flag of Denmark.svg  Denmark 77,10037,400492011 est.
22Flag of Spain.svg  Spain 77,00030,200392011 est.
23Flag of the United Kingdom.svg  United Kingdom 76,90035,900472011 est.
24Flag of Germany.svg  Germany 75,10037,900502011 est.
25Flag of Greece.svg  Greece 74,70028,700382011 est.
26Flag of Iceland.svg  Iceland 74,70039,600532011 est.
Flag of Europe.svg  European Union 74,40030,600412011 est.
27Flag of Slovenia.svg  Slovenia 69,90029,300422011 est.
28Flag of South Korea.svg  Korea, South 63,90031,800502011 est.
29Flag of Cyprus.svg  Cyprus 60,90021,200352011 est.
30Flag of Croatia.svg  Croatia 57,20018,000322011 est.
31Flag of the Czech Republic.svg  Czech Republic 56,50026,700472011 est.
32Flag of New Zealand.svg  New Zealand 56,00028,700512011 est.
33Flag of Slovakia.svg  Slovakia 54,10023,200432011 est.
34Flag of Hungary.svg  Hungary 51,30019,600382011 est.
35Flag of Portugal.svg  Portugal 51,00022,900452011 est.
Flag of Curacao.svg  Curacao 50,20020,200402008 est.
36Flag of Poland.svg  Poland 48,50019,900412011 est.
37Flag of Argentina.svg  Argentina 45,60017,000372011 est.
38Flag of Estonia.svg  Estonia 44,80021,100472011 est.
39Flag of Lithuania.svg  Lithuania 44,70017,300392011 est.
40Flag of Bulgaria.svg  Bulgaria 43,80014,300332011 est.
41Flag of Trinidad and Tobago.svg  Trinidad and Tobago 43,80021,300492011 est.
42Flag of Turkey.svg  Turkey 41,70013,000312011 est.
43Flag of Iran.svg  Iran 41,60011,900292011 est.
44Flag of South Africa.svg  South Africa 41,20011,300272011 est.
45Flag of Malaysia.svg  Malaysia 38,80015,600402011 est.
Flag of Sint Maarten.svg  Sint Maarten 38,30021,900572008 est.
46Flag of Chile.svg  Chile 37,50016,600442011 est.
47Flag of Mexico.svg  Mexico 36,60014,600402011 est.
48Flag of Mauritius.svg  Mauritius 34,40014,800432011 est.
49Flag of Latvia.svg  Latvia 34,00015,700462011 est.
50Flag of Uruguay.svg  Uruguay 33,90015,700462011 est.
51Flag of Russia.svg  Russia 33,90017,200512011 est.
52Flag of Panama.svg  Panama 33,50014,500432011 est.
53Flag of North Macedonia.svg  North Macedonia 32,00010,300322011 est.
54Flag of Montenegro.svg  Montenegro 31,30010,500342011 est.
55Flag of Tunisia.svg  Tunisia 31,0009,600312011 est.
56Flag of Romania.svg  Romania 30,70012,000392011 est.
57Flag of Peru.svg  Peru 29,80010,200342011 est.
Flag of Kosovo.svg  Kosovo 29,4007,000242011 est.
58Flag of Ecuador.svg  Ecuador 28,9008,300292011 est.
59Flag of Costa Rica.svg  Costa Rica 27,20011,900442011 est.
60Flag of Algeria.svg  Algeria 26,3007,500292011 est.
61Flag of Kazakhstan.svg  Kazakhstan 26,20012,500482011 est.
62Flag of Colombia.svg  Colombia 26,00010,500402011 est.
63Flag of Jordan.svg  Jordan 23,7005,700242011 est.
64Flag of Brazil.svg  Brazil 23,30011,200482011 est.
65Flag of the Dominican Republic.svg  Dominican Republic 22,7009,400412011 est.
66Flag of Jamaica.svg  Jamaica 21,3008,600402011 est.
67Flag of Egypt.svg  Egypt 21,2006,300302011 est.
68Flag of Syria.svg  Syria 20,8004,800232011 est.
69Flag of El Salvador.svg  El Salvador 18,7007,400392011 est.
70Flag of Ukraine.svg  Ukraine 16,2007,300452011 est.
71Flag of Armenia.svg  Armenia 16,0006,000382011 est.
72Flag of Morocco.svg  Morocco 15,5005,100332011 est.
73Flag of Azerbaijan.svg  Azerbaijan 15,4009,900642011 est.
74Flag of Thailand.svg  Thailand 15,3009,000592011 est.
75Flag of the People's Republic of China.svg  China 14,8008,400572011 est.
76Flag of Sri Lanka.svg  Sri Lanka 14,6005,500372011 est.
77Flag of Guatemala.svg  Guatemala 14,0005,400392011 est.
78Flag of Paraguay.svg  Paraguay 12,6005,600452011 est.
79Bandera de Bolivia (Estado).svg  Bolivia 11,8005,100432011 est.
80Flag of Honduras.svg  Honduras 10,8004,400402011 est.
81Flag of the Philippines.svg  Philippines 10,6003,800362011 est.
82Flag of Indonesia.svg  Indonesia 10,3004,600442011 est.
83Flag of Nigeria.svg  Nigeria 10,2002,500252011 est.
84Flag of India.svg  India 10,1003,800372011 est.
85Flag of Pakistan.svg  Pakistan 8,9002,600292011 est.
Flag of the United Kingdom.svg  Saint Helena, Ascension and Tristan da Cunha 8,4002,500301998 est.
86Flag of Nicaragua.svg  Nicaragua 7,0003,300472011 est.
87Flag of Vietnam.svg  Vietnam 6,6003,300502011 est.
88Flag of Uzbekistan.svg  Uzbekistan 5,8003,300572011 est.
89Flag of Bangladesh.svg  Bangladesh 3,9001,800452011 est.
90Flag of Myanmar.svg  Burma 2,7001,500572011 est.

See also

Related Research Articles

<span class="mw-page-title-main">Per capita income</span> Average income of an economy

Per capita income (PCI) or total income measures the average income earned per person in a given area in a specified year. It is calculated by dividing the area's total income by its total population.

<span class="mw-page-title-main">Economy of Romania</span> National economy of Romania

The economy of Romania is a complex high-income economy with a skilled labour force, ranked 12th in the European Union by total nominal GDP and 7th largest when adjusted by purchasing power parity. The World Bank notes that Romania's efforts are focused on accelerating structural reforms and strengthening institutions in order to further converge with the European Union. The country's economic growth has been one of the highest in the EU since 2010, with 2022 seeing a better-than-expected 4.8% increase.

<span class="mw-page-title-main">Unemployment</span> People without work and actively seeking work

Unemployment, according to the OECD, is people above a specified age not being in paid employment or self-employment but currently available for work during the reference period.

The economies of Canada and the United States are similar because both are developed countries. While both countries feature in the top ten economies in the world in 2022, the U.S. is the largest economy in the world, with US$24.8 trillion, with Canada ranking ninth at US$2.2 trillion.

<span class="mw-page-title-main">Economy of North America</span> Overview of the economy of North America

The economy of North America comprises more than 596 million people in its 24 sovereign states and 15 dependent territories. It is marked by a sharp division between the predominantly English speaking countries of Canada and the United States, which are among the wealthiest and most developed nations in the world, and countries of Central America and the Caribbean in the former Latin America that are less developed. Mexico and Caribbean nations of the Commonwealth of Nations are between the economic extremes of the development of North America.

<span class="mw-page-title-main">Misery index (economics)</span> Economic indicator measuring economic and social cost

The misery index is an economic indicator, created by economist Arthur Okun. The index helps determine how the average citizen is doing economically and is calculated by adding the seasonally adjusted unemployment rate to the annual inflation rate. It is assumed that both a higher rate of unemployment and a worsening of inflation create economic and social costs for a country.

This is a list of lists of countries and territories by various criteria. A country or territory is a geographical area, either in the sense of nation or state.

<span class="mw-page-title-main">Employment-to-population ratio</span> Statistical ratio; proportion of a working age population that is employed

The Organisation for Economic Co-operation and Development defines the employment rate as the employment-to-population ratio. This is a statistical ratio that measures the proportion of a country's working age population that is employed. This includes people that have stopped looking for work. The International Labour Organization states that a person is considered employed if they have worked at least 1 hour in "gainful" employment in the most recent week.

This is a comparison between Argentine provinces and countries by gross domestic product (PPP) per capita. All data is for the year 2008.

This article includes several ranked indicators for Chile's regions.

<span class="mw-page-title-main">Unemployment in the United States</span> Explanation of unemployment in the United States, presently and historically

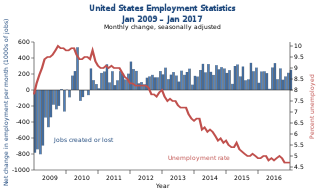
Unemployment in the United States discusses the causes and measures of U.S. unemployment and strategies for reducing it. Job creation and unemployment are affected by factors such as economic conditions, global competition, education, automation, and demographics. These factors can affect the number of workers, the duration of unemployment, and wage levels.

References

  1. The World Factbook, United States Central Intelligence Agency (GDP (PPP), labor force and unemployment rate). Accessed on March 30, 2012. Note: The GDP (PPP) per person employed was calculated by dividing the GDP (PPP) by the employed population. The employed population was obtained by subtracting the unemployed population from the labor force. The unemployed population was calculated by multiplying the unemployment rate by the labor force and dividing the result by 100. The GDP (PPP) per capita was calculated by dividing the GDP (PPP) by the total population.
  2. Population data obtained from International Data Base (IDB), United States Census Bureau. Accessed on March 30, 2012.