Election results
Elections in the 2020s
2022
|
| ||||||||||||||||||||||||||||||||||||||||||||||||||||||||||||||||||||||||||||||||||||||||||||||||||||||||||||||||||||||||||||||||||||||||||||||||||||||||||||||||||||||||||||||||||||||||||||||||||||||||||||||||||||||||||||||||||||||||||||||||||||
Elections in the 2010s
2019
|
| ||||||||||||||||||||||||||||||||||||||||||||||||||||||||||||||||||||||||||||||||||||||||||||||||||||||||||||||||||||||||||||||||||||||||||||||||||||||||||||||||||||||||||||||||||||||||||||||||||||||||||||||||||||||||||||||||||||||||||||||||||||||||||||||||||||||
2016
|
| ||||||||||||||||||||||||||||||||||||||||||||||||||||||||||||||||||||||||||||||||||||||||||||||||||||||||||||||||||||||||||||||||||||||||||||||||||||||||||||||||||||||||||||||||||||||||||||||||||||||||||||||||||||||||||||||||||||||||||||||||||||||||||||||||||||||||||||||||||||||||||||||||||||||||||||||||||||||||||||
2013
|
| ||||||||||||||||||||||||||||||||||||||||||||||||||||||||||||||||||||||||||||||||||||||||||||||||||||||||||||||||||||||||||||||||||||||||||||||||||||||||||||||||||||||||||||||||||||||||||||||||||||||||||||||||||||||||||||||||||||||||||||||||||||||||||||||||||||||||||||||||||||||||||||||||||||||||||||||||||||||||||||
2010
|
| ||||||||||||||||||||||||||||||||||||||||||||||||||||||||||||||||||||||||||||||||||||||||||||||||||||||||||||||||||||||||||||||||||||||||||||||||||||||||||||||||||||||||||||||||||||||||||||||||||||||||||||||||||||||||||||||||||||||||||||||||||||||||||||||||||||||||||||||||||
Elections in the 2000s
2007
| Elected | # | Senator | Party | |
| 2007 | 1 | Ian Macdonald | Liberal | |
| 2007 | 2 | John Hogg | Labor | |
| 2007 | 3 | Sue Boyce | Liberal | |
| 2007 | 4 | Claire Moore | Labor | |
| 2007 | 5 | Ron Boswell | National | |
| 2007 | 6 | Mark Furner | Labor | |
| 2004 | ||||
| 2004 | 1 | Brett Mason | Liberal | |
| 2004 | 2 | Jan McLucas | Labor | |
| 2004 | 3 | George Brandis | Liberal | |
| 2004 | 4 | Joe Ludwig | Labor | |
| 2004 | 5 | Barnaby Joyce | National | |
| 2004 | 3 | Russell Trood | Liberal | |
| Party | Candidate | Votes | % | ±% | |
|---|---|---|---|---|---|
| Quota | 345,559 | ||||
| Liberal/National Coalition | 1. Ian Macdonald (Lib) (elected 1) 2. Sue Boyce (Lib) (elected 3) 3. Ron Boswell (Nat) (elected 5) 4. Mark Powell (Lib) 5. David Goodwin (Nat) 6. Scott Buchholz (Nat) | 977,316 | 40.40 | -4.50 | |
| Labor | 1. John Hogg (elected 2) 2. Claire Moore (elected 4) 3. Mark Furner (elected 6) 4. Diana O'Brien | 948,145 | 39.20 | +7.55 | |
| Greens | 1. Larissa Waters 2. Anja Light 3. Darryl Rosin | 177,063 | 7.32 | +1.92 | |
| Pauline's UAP | 1. Pauline Hanson 2. David Saville | 101,461 | 4.19 | +4.19 | |
| Family First | 1. Jeff Buchanan 2. Beryl Spencer 3. Merlin Manners 4. Cathy Eaton 5. Shaun Hart 6. Elizabeth Benson-Scott | 53,249 | 2.20 | -1.17 | |
| Democrats | 1. Andrew Bartlett 2. Sharon Neill | 45,584 | 1.88 | -0.32 | |
| Fishing Party | 1. Bob Smith 2. Elizabeth Stocker | 20,290 | 0.84 | -0.44 | |
| Fishing and Lifestyle | 1. Kevin Collins 2. Dave Donald | 19,131 | 0.79 | +0.79 | |
| What Women Want | 1. Anne Bousfield 2. Sonya Beutel | 17,370 | 0.72 | +0.72 | |
| Shooters | 1. Paul Feeney 2. Allen Hrstich | 12,845 | 0.53 | +0.53 | |
| Climate Change | 1. Phil Johnson 2. Steve Posselt | 8,818 | 0.36 | +0.36 | |
| Democratic Labor | 1. Noel Jackson 2. Brian Dowling | 7265 | 0.30 | +0.30 | |
| Christian Democrats | 1. Linda Brice 2. Malcolm Brice | 6,289 | 0.26 | +0.26 | |
| Carers Alliance | 1. Felicity Maddison 2. Robert Gow | 4,822 | 0.20 | +0.20 | |
| One Nation | 1. Ian Nelson 2. Lew Arroita | 4,174 | 0.17 | -2.97 | |
| Liberty & Democracy | 1. John Humphreys 2. Joseph Clark | 3,890 | 0.16 | +0.16 | |
| Socialist Alliance | 1. Sam Watson 2. Amelia Taylor | 1,941 | 0.08 | -0.02 | |
| FreeMatilda | 1. Richard Hackett-Jones 2. John Rivett | 1,738 | 0.07 | +0.07 | |
| Group X | 1. James Baker 2. Louise Fitzgerald-Baker | 1,506 | 0.06 | +0.06 | |
| Non-Custodial Parents | 1. Bill Healey 2. Doug Thompson | 1,390 | 0.06 | -0.13 | |
| Senator On-Line | 1. Ben Peake 2. Sharon Bateson | 1,251 | 0.05 | +0.05 | |
| Citizens Electoral Council | 1. Jan Pukallus 2. Maurice Hetherington | 1,155 | 0.05 | -0.10 | |
| Group N | 1. David Couper 2. Michael Brown | 826 | 0.03 | +0.03 | |
| Secular | 1. Katrina Alberts 2. Martin Rady | 493 | 0.02 | +0.02 | |
| Independent | John Duggan | 406 | 0.02 | +0.02 | |
| Independent | Robin Petersen | 198 | 0.01 | +0.01 | |
| Independent | Leo DeMarchi | 144 | 0.01 | +0.01 | |
| Independent | James Reid | 70 | 0.00 | +0.00 | |
| Independent | Marsileo Traversari | 52 | 0.00 | +0.00 | |
| Independent | Pilly Low | 25 | 0.00 | +0.00 | |
| Total formal votes | 2,418,907 | 97.66 | +0.45 | ||
| Informal votes | 57,912 | 2.34 | -0.45 | ||
| Turnout | 2,476,819 | 94.81 | +0.68 | ||
2004
| Elected | # | Senator | Party | |
| 2004 | 1 | Brett Mason | Liberal | |
| 2004 | 2 | Jan McLucas | Labor | |
| 2004 | 3 | George Brandis | Liberal | |
| 2004 | 4 | Joe Ludwig | Labor | |
| 2004 | 5 | Barnaby Joyce | National | |
| 2004 | 3 | Russell Trood | Liberal | |
| 2001 | ||||
| 2001 | 1 | Ian Macdonald | Liberal | |
| 2001 | 2 | John Hogg | Labor | |
| 2001 | 3 | Santo Santoro | Liberal | |
| 2001 | 4 | Claire Moore | Labor | |
| 2001 | 5 | Andrew Bartlett | Democrats | |
| 2001 | 6 | Ron Boswell | National | |
| Party | Candidate | Votes | % | ±% | |
|---|---|---|---|---|---|
| Quota | 323,611 | ||||
| Liberal | 1. Brett Mason (elected 1) 2. George Brandis (elected 3) 3. Russell Trood (elected 6) 4. Sue Boyce | 867,276 | 38.29 | +3.39 | |
| Labor | 1. Jan McLucas (elected 2) 2. Joe Ludwig (elected 4) 3. Frank Gilbert | 717,005 | 36.12 | -0.08 | |
| National | 1. Barnaby Joyce (elected 5) 2. James Baker 3. Stewart Gillies | 149,719 | 6.61 | -2.55 | |
| Greens | 1. Drew Hutton 2. Sarah Moles 3. Theresa Millard | 122,393 | 5.40 | +2.09 | |
| Group K | 1. Pauline Hanson 2. Judy Smith | 102,824 | 4.54 | +4.54 | |
| Family First | 1. John Lewis 2. Tracy Skellern-Smith | 76,309 | 3.37 | +3.37 | |
| One Nation | 1. Len Harris 2. Ian Nelson 3. James Savage | 71,043 | 3.14 | -6.88 | |
| Democrats | 1. John Cherry 2. Bonny Bauer | 49,898 | 2.20 | -4.49 | |
| Fishing Party | 1. Kevin Collins 2. Darryl Whitford | 29,034 | 1.28 | +1.28 | |
| Liberals for Forests | 1. Joseph Clark 2. Archie Chapman | 22,283 | 0.98 | +0.98 | |
| HEMP | 1. Guy Freemarijuana 2. Tony Kneipp | 17,485 | 0.77 | -0.54 | |
| Group O | 1. Hetty Johnston 2. Diana Scott | 15,596 | 0.69 | +0.69 | |
| Group A | 1. Terry Rushton 2. Eamon Coll | 5,152 | 0.23 | +0.23 | |
| Non-Custodial Parents | 1. Geoff Webster 2. Doug Thompson | 4,226 | 0.19 | +0.19 | |
| Citizens Electoral Council | 1. Maurice Hetherington 2. Ray Gillham | 3,359 | 0.15 | +0.05 | |
| New Country | 1. Lorraine Wheeldon 2. Rowell Walton | 2,841 | 0.13 | +0.13 | |
| Socialist Alliance | 1. Sam Watson 2. Nicole Clevens | 2,334 | 0.10 | +0.10 | |
| Great Australians | 1. John Rivett 2. Mal McKenzie | 2,293 | 0.10 | +0.10 | |
| Group D | 1. Selwyn Johnston 2. Susan Harvey | 1,408 | 0.06 | +0.06 | |
| Group G | 1. Gail Duncan 2. Kim McIntosh | 1,015 | 0.04 | +0.04 | |
| Progressive Alliance | 1. Tony Newman 2. Darrell Morris | 921 | 0.04 | +0.04 | |
| Independent | Darryl McArthur | 568 | 0.03 | +0.03 | |
| Independent | Hassan Ghulam | 295 | 0.01 | +0.01 | |
| Total formal votes | 2,265,274 | 97.21 | +0.16 | ||
| Informal votes | 65,037 | 2.79 | -0.16 | ||
| Turnout | 2,330,311 | 94.13 | -1.10 | ||
2001
| Elected | # | Senator | Party | |
| 2001 | 1 | Ian Macdonald | Liberal | |
| 2001 | 2 | John Hogg | Labor | |
| 2001 | 3 | John Herron | Liberal | |
| 2001 | 4 | Claire Moore | Labor | |
| 2001 | 5 | Andrew Bartlett | Democrats | |
| 2001 | 6 | Ron Boswell | National | |
| 1998 | ||||
| 1998 | 1 | Jan McLucas | Labor | |
| 2000* | 2 | George Brandis | Liberal | |
| 1999† | 3 | Len Harris | One Nation | |
| 1998 | 4 | Joe Ludwig | Labor | |
| 1998 | 5 | Brett Mason | Liberal | |
| 2001‡ | 6 | John Cherry | Democrats | |
| Party | Candidate | Votes | % | ±% | |
|---|---|---|---|---|---|
| Quota | 307,154 | ||||
| Liberal | 1. Ian Macdonald (elected 1) 2. John Herron (elected 3) 3. Russell Trood 4. Deborah Kember | 750,416 | 34.90 | +9.0 | |
| Labor | 1. John Hogg (elected 2) 2. Claire Moore (elected 4) 3. Brenda Gibbs | 682,239 | 31.73 | -0.9 | |
| One Nation | 1. Pauline Hanson 2. Trevor Hansen 3. Morrie Marsden 4. John Slack-Smith | 215,400 | 10.02 | -4.8 | |
| National | 1. Ron Boswell (elected 6) 2. Pam Stallman 3. Barnaby Joyce | 196,845 | 9.16 | -0.3 | |
| Democrats | 1. Andrew Bartlett (elected 5) 2. Liz Oss-Emer 3. Megan Bathurst | 143,942 | 6.69 | -1.0 | |
| Greens | 1. Sarah Moles 2. Desiree Mahoney 3. Mark Taylor | 71,102 | 3.31 | +1.2 | |
| HEMP | 1. Nigel Freemarijuana 2. Guy Freemarijuana | 28,122 | 1.31 | +1.3 | |
| No GST | 1. David Ettridge 2. Richard Gooch | 24,319 | 1.13 | -1.0 | |
| Christian Democrats | 1. Kerry Blackman 2. Geoffrey Bullock | 22,703 | 1.06 | -0.3 | |
| Group A | 1. Sam Watson 2. Karen Fletcher | 8,553 | 0.40 | +0.40 | |
| Republican | 1. John Pyke 2. Malcolm Simpson | 2,553 | 0.12 | +0.1 | |
| Citizens Electoral Council | 1. Danny Hope 2. Nick Contarino | 2,226 | 0.10 | +0.10 | |
| Independent | Derek Rosborough | 700 | 0.03 | +0.03 | |
| Independent | Phillip Riley | 263 | 0.01 | +0.01 | |
| Independent | George Szentes | 180 | 0.01 | +0.01 | |
| Independent | Oni Kirwin | 173 | 0.01 | +0.01 | |
| Independent | Anthony Melrose | 105 | 0.01 | +0.01 | |
| Independent | John Jones | 86 | 0.01 | +0.01 | |
| Independent | David Howse | 78 | 0.01 | +0.01 | |
| Independent | Walter Philippi | 72 | 0.01 | +0.01 | |
| Total formal votes | 2,150,077 | 97.05 | +0.09 | ||
| Informal votes | 65,450 | 2.95 | -0.09 | ||
| Turnout | 2,215,527 | 95.23 | +0.33 | ||
Elections in the 1990s
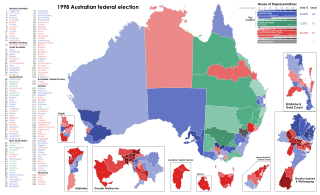
1998
| Elected | # | Senator | Party | |
| 1998 | ||||
| 1998 | 1 | Jan McLucas | Labor | |
| 1998 | 2 | Warwick Parer | Liberal | |
| 1998 | 3 | Heather Hill | One Nation | |
| 1998 | 4 | Joe Ludwig | Labor | |
| 1998 | 5 | Brett Mason | Liberal | |
| 1998 | 6 | John Woodley | Democrats | |
| 1996 | ||||
| 1996 | 1 | Ian Macdonald | Liberal | |
| 1996 | 2 | John Hogg | Labor | |
| 1996 | 3 | Ron Boswell | National | |
| 1996 | 4 | John Herron | Liberal | |
| 1996 | 5 | Brenda Gibbs | Labor | |
| 1996 | 6 | Andrew Bartlett | Democrats | |
| Party | Candidate | Votes | % | ±% | |
|---|---|---|---|---|---|
| Quota | 286,245 | ||||
| Labor | 1. Jan McLucas (elected 1) 2. Joe Ludwig (elected 4) 3. Jann Piasecki | 654,623 | 32.7 | +2.3 | |
| Liberal | 1. Warwick Parer (elected 2) 2. Brett Mason (elected 5) 3. David MacGibbon 4. Deborah Kember | 570,692 | 28.5 | -6.9 | |
| One Nation | 1. Heather Hill (elected 3) 2. Len Harris 3. Sue Gordon 4. David Anning 5. Barry Evans | 297,245 | 14.9 | +14.9 | |
| National | 1. Bill O'Chee 2. Thomas Bradley 3. Teresa Cobb | 190,662 | 9.5 | -5.5 | |
| Democrats | 1. John Woodley (elected 6) 2. John Cherry 3. Megan Bathurst | 156,451 | 7.8 | -5.4 | |
| Greens | 1. Drew Hutton 2. Desiree Mahoney 3. Chris Gwin | 42,264 | 2.1 | -0.3 | |
| Christian Democrats | 1. John Bradford 2. Kerry Blackman 3. Judy McKenzie | 28,826 | 1.4 | +0.9 | |
| Queensland First | 1. David Colston 2. Dawn Colston | 11,554 | 0.6 | +0.6 | |
| Unity | 1. Harry Fong 2. Chris Toogood | 9,487 | 0.5 | +0.5 | |
| Women's Party | 1. Mary Kelly 2. Jenny Hughey | 9,103 | 0.5 | -0.2 | |
| One Australia | 1. Mario Zocchi 2. Ray Buckley | 7,572 | 0.4 | +0.2 | |
| Abolish Child Support | 1. Bruce the Family 2. Steve Southall | 4,905 | 0.2 | +0.2 | |
| Australia First | 1. Eric Nagle 2. Klaus Duke | 4,897 | 0.2 | +0.2 | |
| Democratic Socialist | 1. Andy Gianniotis 2. Coral Wynter | 4,394 | 0.2 | +0.2 | |
| Family Law Reform | 1. Barry Weedon 2. Robyn Somers | 2,326 | 0.1 | +0.1 | |
| Reform | 1. Brenda Moloney 2. Terry Fleming | 2,011 | 0.1 | +0.1 | |
| Citizens Electoral Council | 1. Maurice Hetherington 2. Ray Gillham | 1,785 | 0.1 | +0.1 | |
| Natural Law | 1. Geoff Wilson 2. Dorothy McKenzie | 1,782 | 0.1 | +0.1 | |
| Group B | 1. Jan Linsley 2. Percy Meredith | 941 | 0.0 | 0.0 | |
| Group C | 1. Noel Payne 2. Jim Pavier | 685 | 0.0 | 0.0 | |
| Group S | 1. Selwyn Johnston 2. Aaron Johnston | 661 | 0.0 | 0.0 | |
| Independent | Michelle MacNevin | 484 | 0.0 | 0.0 | |
| Independent | Kenny Dalton | 147 | 0.0 | 0.0 | |
| Independent | Bryan Peach | 141 | 0.0 | 0.0 | |
| Independent | Terry Sharples | 51 | 0.0 | 0.0 | |
| Independent | Doug Hodgetts | 21 | 0.0 | 0.0 | |
| Total formal votes | 2,003,710 | 97.0 | +0.3 | ||
| Informal votes | 62,754 | 3.0 | -0.3 | ||
| Turnout | 2,066,464 | 94.9 | -0.2 | ||
1996
| Elected | # | Senator | Party | |
| 1996 | ||||
| 1996 | 1 | Ian Macdonald | Liberal | |
| 1996 | 2 | John Hogg | Labor | |
| 1996 | 3 | Ron Boswell | National | |
| 1996 | 4 | John Herron | Liberal | |
| 1996 | 5 | Brenda Gibbs | Labor | |
| 1996 | 6 | Cheryl Kernot | Democrats | |
| 1993 | ||||
| 1993 | 1 | Margaret Reynolds | Labor | |
| 1993 | 2 | David MacGibbon | Liberal | |
| 1993 | 3 | Bill O'Chee | National | |
| 1993 | 4 | Mal Colston | Labor | |
| 1993 | 5 | John Herron | Liberal | |
| 1993 | 6 | John Woodley | Democrats | |
| Party | Candidate | Votes | % | ±% | |
|---|---|---|---|---|---|
| Quota | 274,924 | ||||
| Liberal | 1. Ian Macdonald (elected 1) 2. John Herron (elected 4) 3. Debbie Kember | 680,553 | 35.4 | +3.9 | |
| Labor | 1. John Hogg (elected 2) 2. Brenda Gibbs (elected 5) 3. Bernadette Callaghan | 583,850 | 30.3 | -9.1 | |
| National | 1. Ron Boswell (elected 3) 2. Teresa Cobb 3. Terry Cranwell | 288,199 | 15.0 | +0.5 | |
| Democrats | 1. Cheryl Kernot (elected 6) 2. Tony Walters 3. Peter Collins 4. Annette Reed | 254,219 | 13.2 | +6.2 | |
| Greens | 1. Angela Jones 2. Desiree Mahoney 3. Libby Connors | 46,285 | 2.4 | -0.8 | |
| Against Further Immigration | 1. Cynthia Mayne 2. John Minogue | 13,117 | 0.7 | +0.7 | |
| Women's Party | 1. Mary Kelly 2. Lizbeth Yuille 3. Jenny Hughey | 13,006 | 0.7 | +0.7 | |
| Shooters | 1. Peter Salisbury 2. Bill Ison | 12,146 | 0.6 | +0.6 | |
| Call to Australia | 1. Harry Cook 2. Nan Cook | 9,543 | 0.5 | -0.1 | |
| Group G | 1. J Freemarijuana 2. Tony Kneipp | 3,836 | 0.2 | +0.2 | |
| Natural Law | 1. Kris Ayyar 2. John Price | 3,656 | 0.2 | 0.0 | |
| One Australia | 1. Perry Jewell 2. Michael Grayson | 3,638 | 0.2 | +0.2 | |
| Group F | 1. Phillip Young 2. Harvie Ladlow | 2,793 | 0.1 | +0.1 | |
| Indigenous Peoples | 1. Sam Watson 2. Netta Tyson | 2,772 | 0.1 | +0.1 | |
| Republican | 1. Brian Buckley 2. David Bailey | 2,683 | 0.1 | +0.1 | |
| Group H | 1. Ian McNiven 2. Ray Smyth 3. Robert Marks | 1,909 | 0.1 | +0.1 | |
| Group M | 1. Maurice Hetherington 2. Ross Russell | 738 | 0.0 | 0.0 | |
| Group E | 1. John Jones 2. Lee Jones | 613 | 0.0 | 0.0 | |
| Independent | Michelle Mac Nevin | 594 | 0.0 | 0.0 | |
| Independent | Ross McKay | 154 | 0.0 | 0.0 | |
| Independent | David Howse | 91 | 0.0 | 0.0 | |
| Independent | Chris Leth | 67 | 0.0 | 0.0 | |
| Total formal votes | 1,924,462 | 96.7 | -1.3 | ||
| Informal votes | 64,979 | 3.3 | +1.3 | ||
| Turnout | 1,989,441 | 95.1 | -0.7 | ||
1993
| Elected | # | Senator | Party | |
|---|---|---|---|---|
| 1993 | 1 | Margaret Reynolds | Labor | |
| 2 | David MacGibbon | Liberal | ||
| 3 | Bill O'Chee | National | ||
| 4 | Mal Colston | Labor | ||
| 5 | Warwick Parer | Liberal | ||
| 6 | John Woodley | Democrats | ||
| 1990 | 1 | Gerry Jones | Labor | |
| 2 | Ian Macdonald | Liberal | ||
| 3 | Gerry Jones | Labor | ||
| 4 | John Herron | Liberal | ||
| 5 | Ron Boswell | National | ||
| 6 | Cheryl Kernot | Democrats | ||
| Party | Candidate | Votes | % | ±% | |
|---|---|---|---|---|---|
| Quota | 264,381 | ||||
| Labor | 1. Margaret Reynolds (elected 1) 2. Mal Colston (elected 4) 3. John Bird 4. Ian McLean | 729,265 | 39.4 | +0.3 | |
| Liberal | 1. David MacGibbon (elected 2) 2. Warwick Parer (elected 5) 3. Ross Cunningham 4. Ann Buchanan 5. Henry Bird 6. Owen Davies | 582,766 | 31.5 | +2.2 | |
| National | 1. Bill O'Chee (elected 3) 2. De-Anne Kelly 3. Teresa Cobb | 268,809 | 14.5 | +0.9 | |
| Democrats | 1. John Woodley (elected 6) 2. Jonathan Cornish 3. Gayle Woodrow 4. Tony Walters | 130,405 | 7.1 | -5.4 | |
| Greens | 1. Drew Hutton 2. Colin Hunt 3. Naomi Spencer | 59,303 | 3.2 | +3.2 | |
| Confederate Action | 1. Perry Jewell 2. Tony Pitt 3. Sandra Hill 4. Mark Geissmann 5. Ryland Gill 6. Richard Teague | 52,942 | 2.9 | +2.9 | |
| Call to Australia | 1. Alan Sims 2. Rona Joyner | 11,546 | 0.6 | -0.5 | |
| Indigenous Peoples | 1. Darby McCarthy 2. Una Branfield | 6,422 | 0.3 | +0.3 | |
| Natural Law | 1. Geoff Wilson 2. Peter Jackson | 3,575 | 0.2 | +0.2 | |
| Group E | 1. Barry Weedon 2. Margaret Crompton | 2,030 | 0.1 | +0.1 | |
| Group H | 1. Ronald Alford 2. Sylvia Smith | 1,272 | 0.1 | +0.1 | |
| Independent | Steve Dimitriou | 1,043 | 0.1 | +0.1 | |
| Citizens Electoral Council | John Koehler | 538 | 0.0 | 0.0 | |
| Citizens Electoral Council | Julie Warner | 254 | 0.0 | 0.0 | |
| Independent | Joe Sherlock | 236 | 0.0 | 0.0 | |
| Independent | Barry Garvey | 150 | 0.0 | 0.0 | |
| Independent | Christopher Beilby | 105 | 0.0 | 0.0 | |
| Total formal votes | 1,850,661 | 98.0 | +0.5 | ||
| Informal votes | 38,491 | 2.0 | -0.5 | ||
| Turnout | 1,889,152 | 95.8 | +0.7 | ||
1990
| Elected | # | Senator | Party | |
|---|---|---|---|---|
| 1990 | ||||
| 1990 | 1 | Gerry Jones | Labor | |
| 1990 | 2 | Ian Macdonald | Liberal | |
| 1990 | 3 | Bryant Burns | Labor | |
| 1990 | 4 | John Herron | Liberal | |
| 1990 | 5 | Ron Boswell | National | |
| 1990 | 6 | Cheryl Kernot | Democrats | |
| 1987 | ||||
| 1987 | 1 | Margaret Reynolds | Labor | |
| 1987 | 2 | Flo Bjelke-Petersen | National | |
| 1987 | 3 | David MacGibbon | Liberal | |
| 1987 | 4 | Mal Colston | Labor | |
| 1987 | 5 | Bill O'Chee | National | |
| 1987 | 6 | Warwick Parer | Liberal | |
| Party | Candidate | Votes | % | ±% | |
|---|---|---|---|---|---|
| Quota | 239,121 | ||||
| Labor | 1. Gerry Jones (elected 1) 2. Bryant Burns (elected 3) 3. John Black 4. Greg Vicary | 653,070 | 39.0 | -3.0 | |
| Liberal | 1. Ian Macdonald (elected 2) 2. John Herron (elected 4) 3. Carmel Draper | 490,523 | 29.3 | +11.3 | |
| National | 1. Ron Boswell (elected 5) 2. Glen Sheil 3. Beth Honeycombe 4. Jim Mason | 227,696 | 13.6 | -15.1 | |
| Democrats | 1. Cheryl Kernot (elected 6) 2. Tony Walters 3. Brian Stockwell 4. John Brown | 209,030 | 12.5 | +5.0 | |
| Environment Inds | 1. Peter James 2. John Jones | 30,967 | 1.8 | +1.8 | |
| Democratic Socialist | 1. Maurice Sibelle 2. Karen Fletcher | 26,300 | 1.6 | +1.6 | |
| Call to Australia | 1. Rona Joyner 2. Wilfred Blake 3. Bernice King 4. Ross Maclean | 18,469 | 1.1 | +1.1 | |
| Grey Power | 1. Ron Alford 2. Felix Cernovs | 9,237 | 0.5 | +0.5 | |
| Conservative | 1. Sydney Volker 2. Loraine Morrison | 4,414 | 0.3 | +0.3 | |
| Group F | 1. Barry Weedon 2. Margaret Crompton | 2,564 | 0.1 | +0.1 | |
| Independent | Vincent Burke | 946 | 0.1 | +0.1 | |
| Independent | Steve Demetriou | 613 | 0.0 | 0.0 | |
| Independent | Clemens Vermeulen | 250 | 0.0 | 0.0 | |
| Independent | Mark Cresswell | 117 | 0.0 | 0.0 | |
| Total formal votes | 1,674,196 | 97.5 | +0.6 | ||
| Informal votes | 42,112 | 2.5 | -0.6 | ||
| Turnout | 1,716,308 | 95.1 | +2.6 | ||
Elections in the 1980s
1987
|
| ||||||||||||||||||||||||||||||||||||||||||||||||||||||||||||||||||||||||||||||||||||||||||||||||||||||||||||||||||||||||||||||||||||||||||||||||||||
1984
| Elected | # | Senator | Party | |
|---|---|---|---|---|
| 1985 | ||||
| 1985 | 1 | Margaret Reynolds | Labor | |
| 1985 | 2 | Ron Boswell | National | |
| 1985 | 3 | David MacGibbon | Liberal | |
| 1985 | 4 | Gerry Jones | Labor | |
| 1985 | 5 | Glen Sheil | National | |
| 1985 | 6 | John Black | Labor | |
| 1985 | 7 | Michael Macklin | Democrats | |
| 1982 | ||||
| 1982 | 1 | George Georges | Labor | |
| 1982 | 2 | Flo Bjelke-Petersen | National | |
| 1982 | 3 | Warwick Parer | Liberal | |
| 1982 | 4 | Mal Colston | Labor | |
| 1982 | 5 | Stan Collard | National | |
| Party | Candidate | Votes | % | ±% | |
|---|---|---|---|---|---|
| Quota | 176,095 | ||||
| Labor | 1. Margaret Reynolds (elected 1) 2. Gerry Jones (elected 4) 3. John Black (elected 6) 4. Bryant Burns | 558,623 | 39.7 | +0.1 | |
| National | 1. Ron Boswell (elected 2) 2. Glen Sheil (elected 5) 3. Patrick Behan 4. Alan Metcalfe | 406,829 | 28.9 | -0.2 | |
| Liberal | 1. David MacGibbon (elected 3) 2. William Everingham 3. Olive-Orme Scott-Young 4. Christopher Gilbert 5. Maurice Thomson | 244,753 | 17.4 | +2.5 | |
| Democrats | 1. Michael Macklin (elected 7) 2. Ray Hollis 3. John Elfick 4. Cheryl Kernot | 129,636 | 9.2 | +1.3 | |
| Nuclear Disarmament | 1. Patsy Goodwin 2. Bernard Hockings | 62,102 | 4.4 | +4.4 | |
| Conservative | 1. Fast Bucks 2. Peter Livesey | 4,731 | 0.3 | +0.3 | |
| Group B | 1. Hugh Bruce 2. Michael Carr | 1,317 | 0.1 | +0.1 | |
| Independent | Frank Bologna | 335 | 0.0 | 0.0 | |
| Independent | Raymond Medwin | 207 | 0.0 | 0.0 | |
| Independent | Norman Eather | 94 | 0.0 | 0.0 | |
| Independent | Cyril McKenzie | 86 | 0.0 | 0.0 | |
| Independent | Dietar Soegemeier | 39 | 0.0 | 0.0 | |
| Total formal votes | 1,408,752 | 97.0 | +5.6 | ||
| Informal votes | 43,919 | 3.0 | -5.6 | ||
| Turnout | 1,452,671 | 93.4 | +0.8 | ||
1983
|
| ||||||||||||||||||||||||||||||||||||||||||||||||||||||||||||||||||||||||||||||||||||||||||||||||||||||||||||||||||||||||||||||||||||||||||||||||||||||||||||||||||||||||||||||||
1980
| Elected | # | Senator | Party | |
|---|---|---|---|---|
| 1981 | ||||
| 1981 | 1 | Jim Keeffe | Labor | |
| 1981 | 2 | Flo Bjelke-Petersen | NCP | |
| 1981 | 3 | Neville Bonner | Liberal | |
| 1981 | 4 | Gerry Jones | Labor | |
| 1981 | 5 | Michael Macklin | Democrat | |
| 1978 | ||||
| 1978 | 1 | Kathy Sullivan | Liberal | |
| 1978 | 2 | George Georges | Labor | |
| 1978 | 3 | Stan Collard | NCP | |
| 1978 | 4 | Mal Colston | Labor | |
| 1978 | 5 | David MacGibbon | Liberal | |
| Party | Candidate | Votes | % | ±% | |
|---|---|---|---|---|---|
| Quota | 192,889 | ||||
| Labor | 1. Jim Keeffe (elected 1) 2. Gerry Jones (elected 4) 3. Robert Gleeson | 445,277 | 38.5 | +3.9 | |
| National Country | 1. Flo Bjelke-Petersen (elected 2) 2. Glen Sheil 3. Ron Maunsell | 309,622 | 26.8 | +26.8* | |
| Liberal | 1. Neville Bonner (elected 3) 2. Yvonne McComb 3. Franz Born | 266,407 | 23.0 | +23.0* | |
| Democrats | 1. Michael Macklin (elected 5) 2. William Elson-Green 3. Gilruth Rees | 115,429 | 10.0 | +1.0 | |
| Progress | 1. Vivian Forbes 2. Frank Paull | 3,399 | 0.3 | -0.5 | |
| Group J | 1. Lionel Fifield 2. Robert McClintock | 3,256 | 0.3 | +0.3 | |
| Group F | 1. John Butler 2. Anne Glew | 3,022 | 0.3 | +0.3 | |
| Socialist | 1. David Ryan 2. Stephen Bulloch 3. Ivan Ivanoff | 2,514 | 0.2 | -2.6 | |
| Independent | Norman Eather | 2,191 | 0.2 | +0.2 | |
| Group G | 1. Sydney Shawcross 2. Cyril McKenzie 3. Michael Dendle | 2,102 | 0.2 | +0.2 | |
| National Front | 1. Rosemary Sisson 2. Victor Robb | 1,467 | 0.1 | +0.1 | |
| Independent | Carlemo Wacando | 1,326 | 0.1 | +0.1 | |
| Group H | 1. James Drabsch 2. Vivien Botterill | 513 | 0.0 | 0.0 | |
| Independent | Neil McKay | 369 | 0.0 | 0.0 | |
| Independent | Anthony Catip | 241 | 0.0 | 0.0 | |
| Independent | Frederick Phillips | 195 | 0.0 | 0.0 | |
| Total formal votes | 1,157,330 | 90.8 | -1.2 | ||
| Informal votes | 117,884 | 9.2 | +1.2 | ||
| Turnout | 1,275,214 | 94.0 | -0.8 | ||
- The Liberal and Country parties contested the previous election as a Coalition, where they obtained 51.3% of the vote. In this election, they contested the election as separate parties.
Elections in the 1960s
1966
| Party | Candidate | Votes | % | ±% | |
|---|---|---|---|---|---|
| Quota | 417,438 | ||||
| Liberal | Bill Heatley (re-elected) | 426,726 | 51.11 | ||
| Labor | Bertie Milliner | 328,289 | 39.32 | ||
| Democratic Labor | Rogers Judge | 62,870 | 7.53 | ||
| Independent | Ian Kent | 16,989 | 2.03 | ||
| Total formal votes | 834,874 | 97.32 | |||
| Informal votes | 22,956 | 2.68 | |||
| Turnout | 857,830 | 95.26 | |||
Elections in the 1910s
1914
Each elector voted for up to six candidates. Percentages refer to the number of voters rather than the number of votes.
| Party | Candidate | Votes | % | ±% | |
|---|---|---|---|---|---|
| Labor | Thomas Givens (re-elected 1) | 152,990 | 57.8 | +7.0 [lower-alpha 3] | |
| Labor | Myles Ferricks (re-elected 2) | 152,469 | 57.6 | +2.8 [lower-alpha 4] | |
| Labor | William Maughan (re-elected 3) | 152,321 | 57.5 | +2.8 [lower-alpha 4] | |
| Labor | James Stewart (re-elected 4) | 151,553 | 57.3 | +7.6 [lower-alpha 3] | |
| Labor | John Mullan (re-elected 5) | 150,703 | 56.9 | +6.4 [lower-alpha 4] | |
| Labor | Harry Turley (re-elected 6) | 150,703 | 56.9 | +6.4 [lower-alpha 3] | |
| Liberal | Thomas Crawford | 114,652 | 43.3 | ||
| Liberal | William Aitchison | 113,317 | 42.8 | ||
| Liberal | Frederick Johnson | 113,230 | 42.8 | ||
| Liberal | Adolphus Jones | 112,640 | 42.6 | ||
| Liberal | Edward Smith | 111,766 | 42.2 | ||
| Liberal | Michael O'Donnell | 111,396 | 42.1 | ||
| Total formal votes | 1,588,266 264,711 voters | 95.77 | +0.90 | ||
| Informal votes | 11,693 | 4.23 | −0.90 | ||
| Turnout | 276,404 | 75.07 | +1.77 | ||
| Party total votes | |||||
| Labor | 911,265 | 57.37 | +3.19 | ||
| Liberal | 677,001 | 42.63 | −3.19 | ||
1913
Each elector voted for up to three candidates. Percentages refer to the number of voters rather than the number of votes.
| Party | Candidate | Votes | % | ±% | |
|---|---|---|---|---|---|
| Labour | William Maughan (elected 1) | 145,477 | 54.7 | ||
| Labour | John Mullan (elected 2) | 143,700 | 54.0 | ||
| Labour | Myles Ferricks (elected 3) | 143,416 | 53.9 | ||
| Liberal | Thomas Chataway (defeated) | 123,621 | 46.5 | −5.3 [lower-alpha 5] | |
| Liberal | Robert Sayers (defeated) | 121,780 | 45.8 | −4.4 [lower-alpha 5] | |
| Liberal | Anthony St Ledger (defeated) | 121,372 | 45.2 | −4.0 [lower-alpha 5] | |
| Total formal votes | 798,366 266,122 voters | 94.9 | +0.1 | ||
| Informal votes | 14,403 | −0.1 | |||
| Turnout | 280,525 | 77.3 | +16.1 | ||
| Party total votes | |||||
| Labour | 432,593 | 54.2 | +3.9 | ||
| Liberal | 365,773 | 45.8 | −1.8 | ||
1910
Each elector voted for up to three candidates. Percentages refer to the number of voters rather than the number of votes.
| Party | Candidate | Votes | % | ±% | |
|---|---|---|---|---|---|
| Labour | Thomas Givens (re-elected 1) | 82,234 | 50.8 | −1.0 [lower-alpha 6] | |
| Labour | Harry Turley (re-elected 2) | 81,719 | 50.5 | −4.6 [lower-alpha 6] | |
| Labour | James Stewart (re-elected 3) | 80,339 | 49.7 | −3.8 [lower-alpha 6] | |
| Liberal | Thomas Glassey | 77,895 | 48.1 | ||
| Liberal | Hugh Macrossan | 77,367 | 47.8 | ||
| Liberal | Joe Millican | 75,707 | 46.8 | ||
| Independent | William Kellett | 6,065 | 3.7 | ||
| Independent | Horace Ransome | 4,014 | 2.5 | ||
| Total formal votes | 485,340 161,780 voters | 94.8 | +0.7 | ||
| Informal votes | 8,854 | 5.2 | −0.7 | ||
| Turnout | 170,634 | 61.2 | +15.3 | ||
| Party total votes | |||||
| Labour | 244,292 | 50.3 | +8.3 | ||
| Liberal | 230,969 | 47.6 | −2.8 [lower-alpha 7] | ||
| Independent | 10,079 | 2.1 | |||
Elections in the 1900s
1906
Each elector voted for up to three candidates. Percentages refer to the number of voters rather than the number of votes.
| Party | Candidate | Votes | % | ±% | |
|---|---|---|---|---|---|
| Anti-Socialist | Thomas Chataway (elected 1) | 60,738 | 51.8 | ||
| Anti-Socialist | Robert Sayers (elected 2) | 58,824 | 50.2 | ||
| Anti-Socialist | Anthony St Ledger (elected 3) | 57,687 | 49.2 | ||
| Labour | William Higgs (defeated) | 54,176 | 46.2 | ||
| Labour | James Griffith | 46,805 | 39.9 | ||
| Labour | Jens Lundager | 46,584 | 39.7 | ||
| Independent Labor | Anderson Dawson (defeated) | 26,771 | 22.8 | ||
| Total formal votes | 351,585 117,195 voters | 94.1 | |||
| Informal votes | 7,344 | 5.9 | |||
| Turnout | 124,539 | 45.9 | |||
| Party total votes | |||||
| Anti-Socialist | 177,249 | 50.4 | |||
| Labour | 147,565 | 42.0 | |||
| Independent Labor | 26,771 | 7.6 | |||
1903
Each elector voted for up to three candidates. Percentages refer to the number of voters rather than the number of votes.
| Party | Candidate | Votes | % | ±% | |
|---|---|---|---|---|---|
| Labour | Harry Turley (elected 1) | 66,074 | 55.1 | ||
| Labour | James Stewart (re-elected 2) | 64,077 | 53.5 | ||
| Labour | Thomas Givens (elected 3) | 62,088 | 51.8 | ||
| Liberal | Walter Tunbridge | 47,927 | 40.0 | ||
| Liberal | John Bartholomew | 47,081 | 39.2 | ||
| Liberal | John Murray | 41,719 | 34.8 | ||
| Ind. Protectionist | Thomas Glassey (defeated) | 30,720 | 25.6 | ||
| Total formal votes | 359,623 119,895 voters | 96.3 | |||
| Informal votes | 4,612 | 3.7 | |||
| Turnout | 124,507 | 54.8 | |||
| Party total votes | |||||
| Labour | 192,239 | 53.5 | |||
| Liberal | 136,664 | 38.0 | |||
| Independent | 30,720 | 8.5 | |||
1901
Each elector voted for up to six candidates; as such percentages are shown of the total number of voters rather than the total number of votes.
There was no protectionist or free trade organisation in Queensland in 1901; the Labour Party was the only formal political party. Candidates' designations are assigned according to whether they publicly identified with the protectionist or free trade cause. Elected candidates sat with their respective parties.
| Party | Candidate | Votes | % | ±% | |
|---|---|---|---|---|---|
| Labour | William Higgs (elected 1) | 29,452 | 62.1 | +62.1 | |
| Labour | Anderson Dawson (elected 2) | 29,350 | 61.9 | +61.9 | |
| Protectionist | James Drake (elected 3) | 26,552 | 56.0 | +56.0 | |
| Labour | James Stewart (elected 4) | 23,736 | 50.0 | +50.0 | |
| Free Trade | John Ferguson (elected 5) | 23,276 | 49.1 | +49.1 | |
| Protectionist | Thomas Glassey (elected 6) | 22,670 | 47.8 | +47.8 | |
| Protectionist | Andrew Thynne | 22,001 | 46.4 | +46.4 | |
| Protectionist | John Bartholomew | 20,624 | 43.5 | +43.5 | |
| Protectionist | John Hamilton | 18,680 | 39.4 | +39.4 | |
| Protectionist | Alfred Cowley | 18,265 | 38.5 | +38.5 | |
| Protectionist | Edmund Plant | 17,028 | 35.9 | +35.9 | |
| Protectionist | Thomas Murray-Prior | 13,236 | 27.9 | +27.9 | |
| Independent | John Hoolan | 7,382 | 15.6 | +15.6 | |
| Protectionist | David Seymour | 4,969 | 10.5 | +10.5 | |
| Free Trade | Joseph Ahearne | 4,516 | 9.5 | +9.5 | |
| Protectionist | Charles Buzacott | 2,918 | 6.2 | +6.2 | |
| Total formal votes | 284,655 ~47,443 ballots | ||||
| Informal votes | unknown | ||||
| Turnout | unknown | ||||
| Party total votes | |||||
| Protectionist | 166,943 | 58.6 | +58.6 | ||
| Labour | 82,538 | 29.0 | +29.0 | ||
| Free Trade | 27,792 | 9.8 | +9.8 | ||
| Independent | 7,382 | 2.6 | +2.6 | ||