Election results
Elections in the 2020s
2022
|
| ||||||||||||||||||||||||||||||||||||||||||||||||||||||||||||||||||||||||||||||||||||||||||||||||||||||||||||||||||||||||||||||||||||||||||||||||||||||||||||||||||||||||||||||||||||||||||||||||||||||||||||||||||||||||||||
Elections in the 2010s
2019
|
| ||||||||||||||||||||||||||||||||||||||||||||||||||||||||||||||||||||||||||||||||||||||||||||||||||||||||||||||||||||||||||||||||||||||||||||||||||||||||||||||||||||||||||||||||||||||||||||||||||||||||||||||||||||||||||||||||||||||||||||||||||||
2016
|
| ||||||||||||||||||||||||||||||||||||||||||||||||||||||||||||||||||||||||||||||||||||||||||||||||||||||||||||||||||||||||||||||||||||||||||||||||||||||||||||||||||||||||||||||||||||||||||||||||||||||||||||||||||||||||||||||||||||||||||||||||||||||||||
2014 special election
[6]
|
| ||||||||||||||||||||||||||||||||||||||||||||||||||||||||||||||||||||||||||||||||||||||||||||||||||||||||||||||||||||||||||||||||||||||||||||||||||||||||||||||||||||||||||||||||||||||||||||||||||||||||||||||||||||||||||||||||||||||||||||||||||||||||||||||||||||||||||||||||||||||||||||||||||||||||||||||||||||||
2013
|
| ||||||||||||||||||||||||||||||||||||||||||||||||||||||||||||||||||||||||||||||||||||||||||||||||||||||||||||||||||||||||||||||||||||||||||||||||||||||||||||||||||||||||||||||||||||||||||||||||||||||||||||||||||||||||||||||||||||||||||||||||||||||||||||||||||||||||||||
2010
|
| ||||||||||||||||||||||||||||||||||||||||||||||||||||||||||||||||||||||||||||||||||||||||||||||||||||||||||||||||||||||||||||||||||||||||||||||||||||||||||||||||||||||||||||||||||||||||||||||||||||||||||||||||||||||||||||||||||||||||||||||
Elections in the 2000s
2007
| Elected | # | Senator | Party | |
| 2007 | 1 | David Johnston | Liberal | |
| 2007 | 2 | Louise Pratt | Labor | |
| 2007 | 3 | Alan Eggleston | Liberal | |
| 2007 | 4 | Mark Bishop | Labor | |
| 2007 | 5 | Michaelia Cash | Liberal | |
| 2007 | 6 | Scott Ludlam | Greens | |
| 2001 | ||||
| 2004 | 1 | Chris Ellison | Liberal | |
| 2004 | 2 | Chris Evans | Labor | |
| 2004 | 3 | Ian Campbell | Liberal | |
| 2004 | 4 | Glenn Sterle | Labor | |
| 2004 | 5 | Judith Adams | Liberal | |
| 2004 | 6 | Rachel Siewert | Greens | |
| Party | Candidate | Votes | % | ±% | |
|---|---|---|---|---|---|
| Quota | 171,822 | ||||
| Liberal | 1. David Johnston (elected 1) 2. Alan Eggleston (elected 3) 3. Michaelia Cash (elected 5) 4. Michael Mischin 5. Jane Mouritz 6. Matt Brown | 555,868 | 46.22 | -3.12 | |
| Labor | 1. Louise Pratt (elected 2) 2. Mark Bishop (elected 4) 3. Ruth Webber | 433,046 | 36.00 | +3.48 | |
| Greens | 1. Scott Ludlam (elected 6) 2. Alison Xamon 3. Brenda Roy | 111,813 | 9.30 | +1.24 | |
| Christian Democrats | 1. Gerard Goiran 2. Peter Watt | 21,179 | 1.76 | -0.12 | |
| National | 1. Tony Crook 2. Wendy Duncan | 17,365 | 1.44 | +0.58 | |
| Democrats | 1. Erica Lewin 2. Rob Olver 3. Don Hoddy | 12,604 | 1.05 | -0.95 | |
| One Nation | 1. James Hopkinson 2. Ron McLean | 11,623 | 0.97 | -1.48 | |
| Democratic Labor | 1. Bob Boulger 2. Eric Miller | 11,390 | 0.95 | +0.95 | |
| Family First | 1. Linda Rose 2. Cathie Fabian 3. Steve Fuhrmann | 10,341 | 0.86 | +0.01 | |
| What Women Want | 1. Meryki Basden 2. Saywood Lane | 3,533 | 0.29 | +0.29 | |
| Climate Change | 1. Gary Warden 2. Sarah Bishop | 3,461 | 0.29 | +0.29 | |
| Group P | 1. Graeme Campbell 2. John Fischer 3. Russell Graham 4. Geoff Gibson | 1,621 | 0.13 | +0.13 | |
| Carers Alliance | 1. Thomas Hoyer 2. Shirley Primeau | 1,571 | 0.13 | +0.13 | |
| Climate Conservatives | 1. Gerard Kettle 2. Shirley Anton | 1,569 | 0.13 | +0.13 | |
| Citizens Electoral Council | 1. Jean Robinson 2. Stuart Smith | 1,002 | 0.08 | -0.11 | |
| Non-Custodial Parents | 1. Geoff Dixon 2. Mike Ward | 946 | 0.08 | -0.07 | |
| Socialist Alliance | 1. Trent Hawkins 2. Julie Gray | 928 | 0.08 | +0.08 | |
| Senator On-Line | 1. Daniel Mayer 2. Zoe Lamont | 824 | 0.07 | +0.07 | |
| Group M | 1. Eric Wynne 2. Kevin Fitzgerald | 819 | 0.07 | +0.07 | |
| Liberty & Democracy | 1. Peter Whelan 2. Daniel Parker | 591 | 0.05 | +0.05 | |
| Independent | Richard McNaught | 291 | 0.02 | +0.02 | |
| Secular | 1. Jennifer Armstrong 2. Michael Tan | 271 | 0.02 | +0.02 | |
| Independent | Edward Dabrowski | 94 | 0.01 | +0.01 | |
| Total formal votes | 1,202,750 | 97.58 | +1.12 | ||
| Informal votes | 29,797 | 2.42 | -1.12 | ||
| Turnout | 1,232,547 | 93.86 | +0.20 | ||
2004
| Elected | # | Senator | Party | |
| 2004 | 1 | Chris Ellison | Liberal | |
| 2004 | 2 | Chris Evans | Labor | |
| 2004 | 3 | Ian Campbell | Liberal | |
| 2004 | 4 | Glenn Sterle | Labor | |
| 2004 | 5 | Judith Adams | Liberal | |
| 2004 | 6 | Rachel Siewert | Greens | |
| 2001 | ||||
| 2001 | 1 | Alan Eggleston | Liberal | |
| 2001 | 2 | Mark Bishop | Labor | |
| 2001 | 3 | David Johnston | Liberal | |
| 2001 | 4 | Ruth Webber | Labor | |
| 2001 | 5 | Ross Lightfoot | Liberal | |
| 2001 | 6 | Andrew Murray | Democrats | |
| Party | Candidate | Votes | % | ±% | |
|---|---|---|---|---|---|
| Quota | 161,166 | ||||
| Liberal | 1. Chris Ellison (elected 1) 2. Ian Campbell (elected 3) 3. Judith Adams (elected 5) 4. Michelle Steck | 556,558 | 49.34 | +9.21 | |
| Labor | 1. Chris Evans (elected 2) 2. Glenn Sterle (elected 4) 3. Emiliano Barzotto | 366,825 | 32.52 | -1.63 | |
| Greens | 1. Rachel Siewert (elected 6) 2. Colin Hughes 3. Christopher Newall 4. Felicity Peterson | 90,956 | 8.06 | +2.21 | |
| One Nation | 1. James Hopkinson 2. Ron McLean | 27,601 | 2.45 | -4.58 | |
| Democrats | 1. Brian Greig 2. Dominika Lisowski 3. Jason Meotti | 22,603 | 2.00 | -3.86 | |
| Christian Democrats | 1. Lachlan Dunjey 2. Peter Watt 3. Norman Gage | 21,234 | 1.88 | +0.63 | |
| National | 1. Geoff Gill 2. Norm Henning | 9,699 | 0.86 | -1.49 | |
| Family First | 1. Nigel Irvine 2. Don Hatch | 9,553 | 0.85 | +0.85 | |
| Liberals for Forests | 1. Lesley McKay 2. Vicki Taylor | 5,680 | 0.50 | -0.92 | |
| Progressive Labour | 1. Mary Lupi 2. Lyn Kearsley | 5,249 | 0.47 | -0.22 | |
| Group A | 1. Alicia Curtis 2. Steven Ogle | 4,122 | 0.37 | +0.37 | |
| Citizens Electoral Council | 1. Jean Robertson 2. Stuart Smith | 2,098 | 0.19 | +0.08 | |
| New Country | 1. Mal Harrington 2. Brendan Mansell | 1,981 | 0.18 | +0.18 | |
| Non-Custodial Parents | 1. Brian Taylor 2. Geoff Dixon | 1,741 | 0.15 | +0.15 | |
| Progressive Alliance | 1. Geoff Gibson 2. Stephen Crabbe | 932 | 0.08 | +0.08 | |
| Independent | Julie Easton | 1,015 | 0.09 | +0.09 | |
| Independent | Jim Jardine | 146 | 0.01 | +0.01 | |
| Independent | Alexander Marsden | 132 | 0.01 | +0.01 | |
| Total formal votes | 1,128,155 | 96.46 | +0.35 | ||
| Informal votes | 41,452 | 3.54 | -0.04 | ||
| Turnout | 1,169,607 | 93.66 | -1.38 | ||
2001
| Elected | # | Senator | Party | |
| 2001 | 1 | Alan Eggleston | Liberal | |
| 2001 | 2 | Mark Bishop | Labor | |
| 2001 | 3 | David Johnston | Liberal | |
| 2001 | 4 | Ruth Webber | Labor | |
| 2001 | 5 | Ross Lightfoot | Liberal | |
| 2001 | 6 | Andrew Murray | Democrats | |
| 1998 | ||||
| 1998 | 1 | Chris Ellison | Liberal | |
| 1998 | 2 | Peter Cook | Labor | |
| 1998 | 3 | Ian Campbell | Liberal | |
| 1998 | 4 | Chris Evans | Labor | |
| 1998 | 5 | Brian Greig | Democrats | |
| 1998 | 6 | Sue Knowles | Liberal | |
| Party | Candidate | Votes | % | ±% | |
|---|---|---|---|---|---|
| Quota | 157,933 | ||||
| Liberal | 1. Alan Eggleston (elected 1) 2. David Johnston (elected 3) 3. Ross Lightfoot (elected 5) 4. Winston Crane 5. Kim Keogh 6. Nigel Hallett | 443,597 | 40.13 | +1.7 | |
| Labor | 1. Mark Bishop (elected 2) 2. Ruth Webber (elected 4) 3. Mark Cuomo 4. Gavin Waugh | 377,547 | 34.15 | -0.4 | |
| One Nation | 1. Graeme Campbell 2. Gerry Kenworthy 3. Marye Daniels 4. Peter David | 77,757 | 7.03 | -3.0 | |
| Democrats | 1. Andrew Murray (elected 6) 2. Helen Hodgson 3. Damian Meyer | 64,773 | 5.86 | -0.5 | |
| Greens | 1. Rachel Siewert 2. Lee Bell 3. Paul Smith 4. Jenna Zed | 64,736 | 5.86 | +0.2 | |
| National | 1. Hendy Cowan 2. Margaret Day | 26,015 | 2.35 | +1.2 | |
| Liberals for Forests | 1. Liz Davenport 2. Arthur Harris | 15,646 | 1.42 | +1.4 | |
| Christian Democrats | 1. Justin Moseley 2. Kerry Watterson | 13,809 | 1.25 | +0.4 | |
| Progressive Labour | 1. Eddie Hwang 2. Nicholas Chin | 7,667 | 0.69 | +0.7 | |
| Group A | 1. Jim Dalton 2. Kate Dalton | 4,495 | 0.41 | +0.4 | |
| Curtin Labor Alliance | 1. Adrian Bennett 2. June Bennett | 3,494 | 0.32 | +0.3 | |
| Group B | 1. Geoff Taylor 2. Henry Sheil | 1,631 | 0.15 | +0.2 | |
| Citizens Electoral Council | 1. Jean Robertson 2. John Watson | 1,243 | 0.11 | +0.0 | |
| Unity | 1. Eddie Hwang 2. Nicholas Chin | 811 | 0.07 | -1.0 | |
| Independent | Jennifer Lee | 804 | 0.07 | +0.1 | |
| Taxi Operators | 1. Alan Bateson 2. Ramon Kennedy | 670 | 0.06 | +0.06 | |
| Group K | 1. Frank Nesci 2. Renu Schneider | 532 | 0.05 | +0.05 | |
| Group M | 1. Clarrie Isaacs 2. Daniel Watson | 302 | 0.03 | +0.03 | |
| Total formal votes | 1,105,529 | 96.42 | -0.63 | ||
| Informal votes | 41,025 | 3.58 | +0.63 | ||
| Turnout | 1,146,554 | 95.04 | -0.78 | ||
Elections in the 1990s
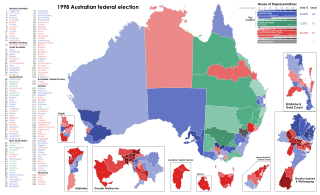
1998
| Elected | # | Senator | Party | |
| 1998 | ||||
| 1998 | 1 | Chris Ellison | Liberal | |
| 1998 | 2 | Peter Cook | Labor | |
| 1998 | 3 | Ian Campbell | Liberal | |
| 1998 | 4 | Chris Evans | Labor | |
| 1998 | 5 | Brian Greig | Democrats | |
| 1998 | 6 | Sue Knowles | Liberal | |
| 1996 | ||||
| 1996 | 1 | Winston Crane | Liberal | |
| 1996 | 2 | Jim McKiernan | Labor | |
| 1996 | 3 | Ross Lightfoot | Liberal | |
| 1996 | 4 | Mark Bishop | Labor | |
| 1996 | 5 | Alan Eggleston | Liberal | |
| 1996 | 6 | Andrew Murray | Democrats | |
| Party | Candidate | Votes | % | ±% | |
|---|---|---|---|---|---|
| Quota | 151,974 | ||||
| Liberal | 1. Chris Ellison (elected 1) 2. Ian Campbell (elected 3) 3. Sue Knowles (elected 6) 4. Ivan Ivankovic | 408,696 | 38.2 | -7.6 | |
| Labor | 1. Peter Cook (elected 2) 2. Chris Evans (elected 4) 3. Rhonda Griffiths 4. Sue Ellery 5. Lois Anderson 6. Chilip Foo | 368,821 | 34.7 | +0.7 | |
| One Nation | 1. John Fischer 2. Colin Tincknell 3. Martin Suter | 110,231 | 10.4 | +10.4 | |
| Democrats | 1. Brian Greig (elected 5) 2. Stephen Crabbe 3. Margot Clifford | 68,057 | 6.4 | -3.0 | |
| Greens | 1. Dee Margetts 2. Kayt Davies 3. Alison Xamon | 61,029 | 5.7 | 0.0 | |
| National | 1. Beryle Morgan 2. Dudley Maslen | 13,428 | 1.3 | -0.8 | |
| Christian Democrats | 1. Justin Moseley 2. Peter Johnson | 10,258 | 1.0 | +0.3 | |
| Group N | 1. Kate Hobbs 2. Morris Bessant | 4,274 | 0.4 | +0.4 | |
| Democratic Socialist | 1. Sarah Stephen 2. Roberto Jorquera | 4,237 | 0.4 | +0.4 | |
| Shooters | 1. Raymond Motteram 2. Ken Taylor | 3,751 | 0.3 | +0.3 | |
| Unity | 1. Ted Wilkes 2. Mai-Yie Leung 3. Michael Carey | 2,270 | 0.2 | +0.2 | |
| Abolish Child Support | 1. Brendan Griffin 2. Sam Johnson | 1,940 | 0.2 | +0.2 | |
| Citizens Electoral Council | 1. Tony Drake 2. Jean Robinson | 1,496 | 0.1 | +0.1 | |
| Group O | 1. Joan Torr 2. Roger Pratt | 1,206 | 0.1 | +0.1 | |
| Republican | 1. Michael O'Donnell 2. Kerry McNally | 1,023 | 0.1 | +0.1 | |
| Taxi Operators | 1. Alan Bateson 2. Rick Finney | 549 | 0.1 | +0.1 | |
| Independent | Rod Garcia | 385 | 0.0 | 0.0 | |
| Total formal votes | 1,063,811 | 97.3 | +0.8 | ||
| Informal votes | 29,352 | 2.7 | -0.8 | ||
| Turnout | 1,093,163 | 95.8 | +0.2 | ||
1996
| Elected | # | Senator | Party | |
| 1996 | ||||
| 1996 | 1 | Winston Crane | Liberal | |
| 1996 | 2 | Jim McKiernan | Labor | |
| 1996 | 3 | John Panizza | Liberal | |
| 1996 | 4 | Mark Bishop | Labor | |
| 1996 | 5 | Alan Eggleston | Liberal | |
| 1996 | 6 | Andrew Murray | Democrats | |
| 1993 | ||||
| 1993 | 1 | Sue Knowles | Liberal | |
| 1993 | 2 | Peter Cook | Labor | |
| 1993 | 3 | Ian Campbell | Liberal | |
| 1993 | 4 | Chris Evans | Labor | |
| 1993 | 5 | Chris Ellison | Liberal | |
| 1993 | 6 | Dee Margetts | Greens | |
| Party | Candidate | Votes | % | ±% | |
|---|---|---|---|---|---|
| Quota | 143,472 | ||||
| Liberal | 1. Winston Crane (elected 1) 2. John Panizza (elected 3) 3. Alan Eggleston (elected 5) 4. Michael Huston 5. Enzo Sirna 6. Clare Thompson | 460,379 | 45.8 | -2.6 | |
| Labor | 1. Jim McKiernan elected 2) 2. Mark Bishop (elected 4) 3. Michael Beahan 4. Catherine Crawford | 341,580 | 34.1 | -4.1 | |
| Democrats | 1. Andrew Murray (elected 6) 2. Don Millar 3. Shirley de la Hunty | 93,937 | 9.4 | +5.3 | |
| Greens | 1. Christabel Chamarette 2. Robin Chapple | 57,006 | 5.7 | +0.1 | |
| National | 1. Kevin McAnuff 2. Lynley Anderson | 20,877 | 2.0 | +0.3 | |
| Against Further Immigration | 1. Richard Haye 2. Robert Hammond | 12,642 | 1.2 | +1.2 | |
| Women's Party | 1. Mattie Turnbull 2. Kate Mudford | 11,169 | 1.1 | +1.1 | |
| Call to Australia | 1. Don Jackson 2. Marj Laurie | 7,028 | 0.7 | -0.5 | |
| Group C | 1. Tony Drake 2. Jean Robinson | 1,518 | 0.1 | +0.1 | |
| Independent | Craig Bradshaw | 1,023 | 0.1 | +0.1 | |
| Natural Law | Ros White | 414 | 0.0 | -0.3 | |
| Independent | Vin Cooper | 376 | 0.0 | 0.0 | |
| Independent | Craig Mackintosh | 346 | 0.0 | 0.0 | |
| Total formal votes | 1,004,299 | 96.5 | -1.4 | ||
| Informal votes | 36,369 | 3.5 | +1.4 | ||
| Turnout | 1,040,668 | 95.6 | -0.3 | ||
1993
| Elected | # | Senator | Party | |
|---|---|---|---|---|
| 1993 | 1 | Sue Knowles | Liberal | |
| 2 | Peter Cook | Labor | ||
| 3 | Ian Campbell | Liberal | ||
| 4 | Chris Evans | Labor | ||
| 5 | Chris Ellison | Liberal | ||
| 6 | Dee Margetts | Greens | ||
| 1990 | 1 | Noel Crichton-Browne | Liberal | |
| 2 | Jim McKiernan | Labor | ||
| 3 | John Panizza | Liberal | ||
| 4 | Michael Beahan | Labor | ||
| 5 | Winston Crane | Liberal | ||
| 6 | Jo Vallentine | Greens | ||
| Party | Candidate | Votes | % | ±% | |
|---|---|---|---|---|---|
| Quota | 139,397 | ||||
| Liberal | 1. Sue Knowles (elected 1) 2. Ian Campbell (elected 3) 3. Chris Ellison (elected 5) 4. Maurice Brockwell 5. Enzo Sirna 6. John McCausland | 472,131 | 48.3 | +5.0 | |
| Labor | 1. Peter Cook (elected 2) 2. Chris Evans (elected 4) 3. Mark Bishop 4. Neil Roberts | 373,247 | 38.3 | +4.7 | |
| Greens | 1. Dee Margetts (elected 6) 2. Chris Williams | 53,757 | 5.6 | -2.8 | |
| Democrats | 1. Jean Jenkins 2. Helen Hodgson | 39,849 | 4.0 | -5.3 | |
| National | 1. Michael Jardine 2. Paul Clune 3. David Lee | 17,075 | 1.7 | -1.2 | |
| Call to Australia | 1. Don Rogers 2. Beryl Rogers | 11,568 | 1.2 | +1.2 | |
| Natural Law | 1. Michael King 2. Philip Jackson 3. Jody Fitzhardinge 4. Peter Coppin | 3,569 | 0.3 | +0.3 | |
| Republican | 1. David Langley 2. Rodney Stratton | 1,519 | 0.2 | +0.2 | |
| Group J | 1. Frank Nesci 2. Paul Nesci | 953 | 0.1 | +0.1 | |
| Citizens Electoral Council | 1. John Seale 2. Laurence Molloy | 876 | 0.1 | +0.1 | |
| Independent | Rick Finney | 549 | 0.1 | +0.1 | |
| Grey Power | Salli Vaughan | 245 | 0.0 | -1.0 | |
| Independent | John Tucak | 226 | 0.0 | 0.0 | |
| Confederate Action | Roland Richardson | 208 | 0.0 | 0.0 | |
| Total formal votes | 975,772 | 97.9 | +0.8 | ||
| Informal votes | 20,983 | 2.1 | -0.8 | ||
| Turnout | 996,755 | 95.9 | +0.8 | ||
1990
| Elected | # | Senator | Party | |
|---|---|---|---|---|
| 1990 | ||||
| 1990 | 1 | Noel Crichton-Browne | Liberal | |
| 1990 | 2 | Jim McKiernan | Labor | |
| 1990 | 3 | John Panizza | Liberal | |
| 1990 | 4 | Michael Beahan | Labor | |
| 1990 | 5 | Winston Crane | Liberal | |
| 1990 | 6 | Jo Vallentine | WA Greens | |
| 1987 | ||||
| 1987 | 1 | Peter Walsh | Labor | |
| 1987 | 2 | Ian Campbell | Liberal | |
| 1987 | 3 | Patricia Giles | Labor | |
| 1987 | 4 | Peter Durack | Liberal | |
| 1987 | 5 | Peter Cook | Labor | |
| 1987 | 6 | Sue Knowles | Liberal | |
| Party | Candidate | Votes | % | ±% | |
|---|---|---|---|---|---|
| Quota | 129,729 | ||||
| Liberal | 1. Noel Crichton-Browne (elected 1) 2. John Panizza (elected 3) 3. Winston Crane (elected 5) 4. Bernie Masters | 392,820 | 43.3 | +4.2 | |
| Labor | 1. Jim McKiernan (elected 2) 2. Michael Beahan (elected 4) 3. Mark Bishop 4. John Cowdell | 304,632 | 33.5 | -9.6 | |
| Democrats | 1. Jean Jenkins 2. Richard Jeffreys 3. Barbara Churchward | 85,324 | 9.4 | +3.7 | |
| Greens WA | 1. Jo Vallentine (elected 6) 2. Christabel Bridge 3. Gladys Yarran | 76,381 | 8.4 | +3.6 | |
| National | 1. Michael Jardine 2. Brian English 3. Josephine Walton | 26,801 | 3.0 | -2.5 | |
| Grey Power | 1. Doug Ratcliffe 2. Jack Webb | 8,781 | 1.0 | +1.0 | |
| Democratic Socialist | 1. Catherine Brown 2. Kylie Budge | 4,883 | 0.5 | +0.5 | |
| Conservative | 1. Brady Williams 2. Charles Bussell 3. Laurence Molloy | 2,967 | 0.3 | +0.3 | |
| Pensioner | 1. Maureen Grierson 2. Gordon Munn | 2,788 | 0.3 | +0.3 | |
| Independent | Phillip Achurch | 1,040 | 0.1 | +0.1 | |
| Independent | Mitchell Faircloth | 958 | 0.1 | +0.1 | |
| Independent | Barbara Stark | 514 | 0.1 | +0.1 | |
| Independent | Ted Quinlan | 209 | 0.0 | 0.0 | |
| Total formal votes | 908,098 | 97.1 | +0.4 | ||
| Informal votes | 26,733 | 2.9 | -0.4 | ||
| Turnout | 934,831 | 95.1 | +0.7 | ||
Elections in the 1980s
1987
|
| ||||||||||||||||||||||||||||||||||||||||||||||||||||||||||||||||||||||||||||||||||||||||||||||||||||||||||||||||||||||||||||||||||||||||||||||||||||
1984
| Elected | # | Senator | Party | |
|---|---|---|---|---|
| 1985 | ||||
| 1985 | 1 | Patricia Giles | Labor | |
| 1985 | 2 | Noel Crichton-Browne | Liberal | |
| 1985 | 3 | Peter Cook | Labor | |
| 1985 | 4 | Reg Withers | Liberal | |
| 1985 | 5 | Jim McKiernan | Labor | |
| 1985 | 6 | Sue Knowles | Liberal | |
| 1985 | 7 | Jo Vallentine | NDP | |
| 1982 | ||||
| 1982 | 1 | Peter Walsh | Labor | |
| 1982 | 2 | Fred Chaney | Liberal | |
| 1982 | 3 | Ruth Coleman | Labor | |
| 1982 | 4 | Peter Durack | Liberal | |
| 1982 | 5 | Gordon McIntosh | Labor | |
| Party | Candidate | Votes | % | ±% | |
|---|---|---|---|---|---|
| Quota | 96,467 | ||||
| Labor | 1. Patricia Giles (elected 1) 2. Peter Cook (elected 3) 3. Jim McKiernan (elected 5) 4. John Crouch | 334,371 | 43.3 | -6.0 | |
| Liberal | 1. Noel Crichton-Browne (elected 2) 2. Reg Withers (elected 4) 3. Sue Knowles (elected 6) 4. Murray Nixon | 313,738 | 40.7 | -0.3 | |
| Nuclear Disarmament | 1. Jo Vallentine (elected 7) 2. Lindsay Matthews | 52,365 | 6.8 | +6.8 | |
| Democrats | 1. Jack Evans 2. Richard Jeffreys 3. Jean Jenkins | 37,369 | 4.8 | -2.0 | |
| Family Movement | 1. Brian Peachey 2. Beryl Van Lyn 3. Nellie Clark 4. John Gilmour 5. Kenneth Wright 6. Roland Bott | 18,041 | 2.3 | +2.3 | |
| National | 1. Bruce Currie 2. Eric Blight 3. Mort Schell 4. Graham Barrett-Lennard | 13,739 | 1.7 | +0.6 | |
| Group E | 1. Frank Nesci 2. Nellie Stuart | 1,033 | 0.1 | +0.1 | |
| Independent | Peter van Tongeren | 861 | 0.1 | +0.1 | |
| Independent | Frank Ash | 154 | 0.0 | 0.0 | |
| Independent | Martin Suter | 62 | 0.0 | 0.0 | |
| Total formal votes | 771,733 | 95.3 | +3.1 | ||
| Informal votes | 37,739 | 4.7 | -3.1 | ||
| Turnout | 809,472 | 94.2 | +1.2 | ||
1983
|
| ||||||||||||||||||||||||||||||||||||||||||||||||||||||||||||||||||||||||||||||||||||||||||||||||||||||||||||||||||||||||||||||||
1980
| Elected | # | Senator | Party | |
|---|---|---|---|---|
| 1981 | ||||
| 1981 | 1 | Reg Withers | Liberal | |
| 1981 | 2 | Gordon McIntosh | Labor | |
| 1981 | 3 | Peter Durack | Liberal | |
| 1981 | 4 | Patricia Giles | Labor | |
| 1981 | 5 | Noel Crichton-Browne | Liberal | |
| 1978 | ||||
| 1978 | 1 | Fred Chaney | Liberal | |
| 1978 | 2 | Peter Walsh | Labor | |
| 1978 | 3 | Andrew Thomas | Liberal | |
| 1978 | 4 | Ruth Coleman | Labor | |
| 1978 | 5 | Allan Rocher | Liberal | |
| Party | Candidate | Votes | % | ±% | |
|---|---|---|---|---|---|
| Quota | 105,085 | ||||
| Liberal | 1. Reg Withers (elected 1) 2. Peter Durack (elected 3) 3. Noel Crichton-Browne (elected 5) | 283,429 | 45.0 | -1.4 | |
| Labor | 1. Gordon McIntosh (elected 2) 2. Patricia Giles (elected 4) 3. Brian Conway | 244,729 | 38.8 | +6.0 | |
| Democrats | 1. Jack Evans 2. Geoffrey Taylor 3. Shirley de la Hunty | 58,538 | 9.3 | -3.2 | |
| National Country | 1. John Patterson 2. John McIntyre 3. Leonard Newing | 25,937 | 4.1 | -2.0 | |
| National | 1. Anthony Overheu 2. Edna Adams 3. Murray Anderson | 7,597 | 1.2 | +1.2 | |
| Progressive Conservative | 1. Syd Negus 2. Peter Harwood | 4,999 | 0.8 | +0.8 | |
| Progress | 1. John Trewick 2. James Jamieson 3. Kenneth Law | 2,593 | 0.4 | -1.3 | |
| Group D | 1. Francesco Nesci 2. Nellie Stuart | 1,570 | 0.2 | +0.2 | |
| Independent | Douglas Thorp | 1,112 | 0.2 | +0.2 | |
| Total formal votes | 630,504 | 90.1 | -1.7 | ||
| Informal votes | 69,453 | 9.9 | +1.7 | ||
| Turnout | 699,957 | 93.2 | -0.8 | ||
Elections in the 1960s
1966
| Party | Candidate | Votes | % | ±% | |
|---|---|---|---|---|---|
| Quota | 121,862 | ||||
| Liberal | 1. Peter Sim (re-elected 1) 2. Reg Withers (defeated) 3. Victor Garland | 161,625 | 44.21 | ||
| Labor | 1. Laurie Wilkinson (elected 2) 2. John Henshaw | 152,809 | 41.80 | ||
| Democratic Labor | 1. Mark Briffa 2. Lydia Obbes | 40,272 | 11.02 | ||
| Independent | 1. Frederick Simpson 2. John Huelin | 10,877 | 2.98 | ||
| Total formal votes | 365,583 | 89.26 | |||
| Informal votes | 43,987 | 10.74 | |||
| Turnout | 409,570 | 94.57 | |||
Elections in the 1910s
1914
Each elector voted for up to six candidates. Percentages refer to the number of voters rather than the number of votes.
| Party | Candidate | Votes | % | ±% | |
|---|---|---|---|---|---|
| Labor | George Pearce (re-elected 1) | 68,245 | 55.4 | −0.2 [lower-alpha 3] | |
| Labor | Patrick Lynch (re-elected 2) | 66,189 | 53.7 | −0.4 [lower-alpha 3] | |
| Labor | Ted Needham (re-elected 3) | 65,960 | 53.5 | −0.5 [lower-alpha 3] | |
| Labor | George Henderson (re-elected 4) | 65,632 | 53.3 | −2.4 [lower-alpha 4] | |
| Labor | Richard Buzacott (re-elected 5) | 65,303 | 53.0 | −1.2 [lower-alpha 3] | |
| Labor | Hugh de Largie (re-elected 6) | 64,452 | 52.3 | +0.4 [lower-alpha 4] | |
| Liberal | William Butcher | 61,288 | 49.7 | +3.9 [lower-alpha 3] | |
| Liberal | William Dempster | 58,208 | 47.2 | ||
| Liberal | George Throssell | 56,973 | 46.2 | ||
| Liberal | John Thomson | 56,290 | 45.7 | ||
| Liberal | Victor Spencer | 55,448 | 45.0 | ||
| Liberal | Charles North | 55,164 | 44.8 | ||
| Total formal votes | 739,152 123,192 voters | 94.67 | +1.3 | ||
| Informal votes | 6,942 | 5.33 | −0.91 | ||
| Turnout | 130,134 | 71.46 | −2.04 | ||
| Party total votes | |||||
| Labor | 395,781 | 53.55 | −1.03 | ||
| Liberal | 343,371 | 46.45 | +1.03 | ||
1913
Each elector voted for up to three candidates. Percentages refer to the number of voters rather than the number of votes.
| Party | Candidate | Votes | % | ±% | |
|---|---|---|---|---|---|
| Labour | George Pearce (re-elected 1) | 68,916 | 55.6 | −3.1 [lower-alpha 5] | |
| Labour | Patrick Lynch (re-elected 2) | 67,039 | 54.1 | +7.1 [lower-alpha 5] | |
| Labour | Ted Needham (re-elected 3) | 66,897 | 54.0 | −0.8 [lower-alpha 5] | |
| Liberal | William Butcher | 56,730 | 45.8 | ||
| Liberal | William Nairn | 56,162 | 45.3 | ||
| Liberal | Charles Davies | 55,950 | 45.2 | ||
| Total formal votes | 371,694 123,898 voters | 93.8 | −0.8 | ||
| Informal votes | 8,251 | 6.2 | +0.8 | ||
| Turnout | 132,149 | 73.5 | +11.3 | ||
| Party total votes | |||||
| Labour | 202,852 | 54.6 | +0.7 | ||
| Liberal | 168,842 | 45.4 | −0.7 | ||
1910
Each elector voted for up to three candidates. Percentages refer to the number of voters rather than the number of votes.
| Party | Candidate | Votes | % | ±% | |
|---|---|---|---|---|---|
| Labour | George Henderson (re-elected 1) | 44,215 | 55.7 | −3.4 [lower-alpha 6] | |
| Labour | Richard Buzacott (elected 2) | 43,032 | 54.2 | ||
| Labour | Hugh de Largie (re-elected 3) | 41,205 | 51.9 | −11.2 [lower-alpha 6] | |
| Liberal | Walter Kingsmill | 37,263 | 46.9 | ||
| Liberal | Archibald Sanderson | 36,453 | 45.9 | ||
| Liberal | Nathaniel Harper | 35,948 | 45.3 | ||
| Total formal votes | 238,116 79,372 voters | 94.6 | +1.3 | ||
| Informal votes | 4,544 | 5.4 | −1.3 | ||
| Turnout | 83,916 | 62.2 | +26.0 | ||
| Party total votes | |||||
| Labour | 128,452 | 53.9 | −1.6 | ||
| Liberal | 109,664 | 46.1 | |||
Elections in the 1900s
1906
Each elector voted for up to three candidates. Percentages refer to the number of voters rather than the number of votes.
| Party | Candidate | Votes | % | ±% | |
|---|---|---|---|---|---|
| Labour | George Pearce (re-elected 1) | 28,852 | 58.7 | ||
| Labour | Ted Needham (elected 2) | 26,938 | 54.8 | ||
| Labour | Patrick Lynch (elected 3) | 26,270 | 47.0 | ||
| Western Australian Party | Henry Mills | 23,121 | 47.0 | ||
| Western Australian Party | Charles Clarke | 21,540 | 43.8 | ||
| Western Australian Party | Edward Wittenoom | 20,765 | 42.2 | ||
| Total formal votes | 147,486 49,162 voters | 93.3 | |||
| Informal votes | 3,550 | 6.7 | |||
| Turnout | 52,712 | 36.2 | |||
| Party total votes | |||||
| Labour | 82,060 | 55.6 | |||
| Western Australian Party | 65,426 | 44.4 | |||
1903
Each elector voted for up to three candidates. Percentages refer to the number of voters rather than the number of votes.
| Party | Candidate | Votes | % | ±% | |
|---|---|---|---|---|---|
| Labour | Hugh de Largie (re-elected 1) | 19,644 | 63.1 | ||
| Labour | George Henderson (elected 2) | 18,414 | 59.1 | ||
| Labour | John Croft (elected 3) | 17,464 | 56.1 | ||
| Free Trade | Henry Saunders (defeated) | 9,979 | 32.0 | ||
| Protectionist | Michael Cavanagh | 8,892 | 28.5 | ||
| Free Trade | William Martin | 7,109 | 22.8 | ||
| Free Trade | Herbert Preston | 6,126 | 19.7 | ||
| Protectionist | Samuel Moore | 5,818 | 18.7 | ||
| Total formal votes | 93,446 ~31,000 voters | ~98 | |||
| Informal votes | 2,001 | ~2 | |||
| Turnout | ~33000 | ~27 | |||
| Party total votes | |||||
| Labour | 55,522 | 59.4 | |||
| Free Trade | 23,214 | 24.8 | |||
| Protectionist | 14,710 | 15.7 | |||
1901
Each elector voted for up to six candidates; as such percentages are shown of the total number of voters rather than the total number of votes.
| Party | Candidate | Votes | % | ±% | |
|---|---|---|---|---|---|
| Free Trade | Staniforth Smith (elected 1) | 15,288 | 69.6 | +69.6 | |
| Free Trade | Alexander Matheson (elected 2) | 14,728 | 67.0 | +67.0 | |
| Labour | George Pearce (elected 3) | 13,109 | 59.6 | +59.6 | |
| Labour | Hugh de Largie (elected 4) | 12,648 | 57.5 | +57.5 | |
| Free Trade | Edward Harney (elected 5) | 11,475 | 52.2 | +52.2 | |
| Free Trade | Norman Ewing (elected 6) | 11,037 | 50.2 | +50.2 | |
| Free Trade | Joseph Thomson | 9,249 | 42.1 | +42.1 | |
| Ind. Free Trade | Henry Saunders | 8,951 | 40.7 | +40.7 | |
| Ind. Free Trade | Henry Ellis | 7,720 | 35.1 | +35.1 | |
| Protectionist | John Phair | 6,191 | 28.2 | +28.2 | |
| Protectionist | Joseph Charles | 5,016 | 22.8 | +22.8 | |
| Ind. Free Trade | Horace Stirling | 4,731 | 21.5 | +21.5 | |
| Free Trade | Louis Wolff | 3,729 | 17.0 | +17.0 | |
| Ind. Free Trade | Richard Gell | 3,548 | 16.1 | +16.1 | |
| Ind. Free Trade | Walter Phillips | 2,261 | 10.3 | +10.3 | |
| Ind. Free Trade | Julius Bowen | 2,184 | 9.9 | +9.9 | |
| Total formal votes | 131,865 ~21,978 ballots | ||||
| Informal votes | 5,793 | ||||
| Turnout | unknown | ||||
| Party total votes | |||||
| Free Trade | 65,506 | 49.7 | +49.7 | ||
| Ind. Free Trade | 29,395 | 22.3 | +22.3 | ||
| Labour | 25,757 | 19.5 | +19.5 | ||
| Protectionist | 11,207 | 8.5 | +8.5 | ||