European Americans

Last updated

European Americans
Largest white alone or in any combination group by county in the United States. US Census 2020.jpg
Largest white alone or in any combination group by county in the 2020 United States census.
Total population
133 million European-diaspora Americans
41% of total U.S. population (2017) [1] [lower-alpha 1]
(as opposed to 235.4 million Americans identifying as White in combination with other races and 204.3 million self-identifying as white) [2]
61.6% of the total U.S. population (2020)
Regions with significant populations
Contiguous United States and Alaska
smaller populations in Hawaii and the territories
Languages
Predominantly English, but also other languages of Europe
Religion
Predominantly Christianity (Mainly Protestantism and Roman Catholicism);
Minority religions: Judaism, Mormonism, Islam, Neo-Paganism, Scientology, Irreligion, Atheism

European Americans, or Americans of European descent, are descendants of European settlers and immigrants. [3] [4] This term includes both people who descend from the first European settlers in the area of the present-day United States and people who descend from more recent European arrivals. Since the 17th century, European Americans have been the largest panethnic group in what are now the United States.

Contents

The Spaniards are thought to have been the first Europeans to establish a continuous presence in what is now the contiguous United States, with Martín de Argüelles (b. 1566) in St. Augustine, then a part of Spanish Florida, [5] [6] and the Russians were the first Europeans to settle in Alaska, establishing Russian America. The first English child born in the Americas was Virginia Dare, born August 18, 1587. She was born in Roanoke Colony, located in present-day North Carolina, which was the first attempt, made during the reign of Queen Elizabeth I, to establish a permanent English settlement in North America.

In the 2020 United States census, English Americans (46.5 million), German Americans (45 million), Irish Americans (38.6 million), Italian Americans (16.8 million) and Polish Americans (8.6 million) were the five largest self-reported European ancestry groups in the United States. [7] However, the number of people with British ancestry is considered to be significantly under-counted, as many people in that demographic tend to identify themselves simply as Americans (20,151,829 or 7.2%). [8] [9] [10] [11] The same applies to Americans of Spanish ancestry, as many people in that demographic tend to identify themselves as Hispanic and Latino Americans (58,846,134 or 16.6%), even though they carry a mean of 65.1% European genetic ancestry, mainly from Spain. [12]

An increasing number of people ignored the ancestry question or chose no specific ancestral group such as "American or United States". In the 2000 census this represented over 56.1 million or 19.9% of the United States population, an increase from 26.2 million (10.5%) in 1990 and 38.2 million (16.9%) in 1980 and are specified as "unclassified" and "not reported". [13] [14]

Terminology

Proportion of Non-Hispanic White Americans in each county of the fifty states, the District of Columbia, and Puerto Rico as of the 2020 United States Census Non-Hispanic White Americans by county.png
Proportion of Non-Hispanic White Americans in each county of the fifty states, the District of Columbia, and Puerto Rico as of the 2020 United States Census
Number of European Americans From 1800 To 2010
YearPopulation % of the United StatesRef(s)
1800 4,306,44681.1%
1850 19,553,06884.3%
1900 66,809,19687.9%
1950 134,942,02889.5%
2000 211,460,62675.1%
2010 223,553,26572.4%

Use

In 1995, as part of a review of the Office of Management and Budget's Statistical Policy Directive No. 15 (Race and Ethnic Standards for Federal Statistics and Administrative Reporting), a survey was conducted of census recipients to determine their preferred terminology for the racial/ethnic groups defined in the Directive. For the White group, European American came a distant third, preferred by only 2.35% of panel interviewees, as opposed to White, which was preferred by 61.66%. [15]

The term is sometimes used interchangeably with Caucasian American, White American, and Anglo American in many places around the United States. [16] However, the terms Caucasian and White are racial terms, not geographic, and include some populations whose origin is outside of Europe; and Anglo-American also has another definition, meaning Americans with English ancestry.

Origin

The term is used by some to emphasize this demographic's European cultural and geographical as well as ancestral origins, parallelling terms such as African Americans and Asian Americans.[ citation needed ]

In contexts such as medical research, terms such as "white" and "European" have been criticized for vagueness and blurring important distinctions between different groups that happen to fit within the label. [17] Margo Adair suggests that viewing Americans of European descent as a single group contributes to the "Wonder breading" of the United States, eradicating the cultural heritage of individual European ethnicities. [18]

Subgroups

Racial types of European Americans as published in "The American Museum journal" between 1900-1918 The American Museum journal (c1900-(1918)) (18161635395).jpg
Racial types of European Americans as published in "The American Museum journal" between 1900-1918

There are a number of subgroupings of European Americans. [19] While these categories may be approximately defined, often due to the imprecise or cultural regionalization of Europe, the subgroups are nevertheless used widely in cultural or ethnic identification. [20] This is particularly the case in diasporic populations, as with European people in the United States generally. [21] In alphabetical order, some of the subgroups are:

History

Historical immigration estimates [22] [23]
CountryImmigration
before 1790
Ancestry 1790
England*230,0001,900,000
Ulster Scotch-Irish*135,000320,000
Germany [lower-alpha 2] 103,000280,000
Scotland*48,500160,000
Ireland8,000200,000
Netherlands6,000100,000
Wales*4,000120,000
France3,00080,000
Sweden and Other [lower-alpha 3] 50020,000
*Totals, British417,5002,500,000+
Flag of the United States (1777-1795).svg United States [lower-alpha 4] 950,0003,929,214

Before the arrival of Europeans, Native Americans predominantly inhabited the United States. The earliest Europeans to invade North America were the Spaniards. The first Spanish invasion was in 1565 at St. Augustine, Florida. [24] One of the most significant Spanish explorers was Hernando De Soto, a conquistador who accompanied Francisco Pizzaro during his conquest of the Inca Empire.

Leaving Havana, Cuba in 1539, De Soto's expedition landed in the state of Florida and explored the southeastern area of the United States. They reached as far as the Mississippi River in search of riches and fortune. Another Spaniard who explored the United States, Francisco Vázquez de Coronado, set out from New Spain in 1540 in search of the mythical Seven Cities of Gold. Coronado's expedition traveled to Kansas and the Grand Canyon, but failed to discover gold or treasure. However, Coronado left a gift of horses to the Plains Indians. Italian explorer Giovanni da Verrazano and Frenchman Jacques Cartier are other Europeans who explored the United States. The Spaniards viewed the French as a threat to their trade route along the Gulf Stream. [25]

Since 1607, some 57 million immigrants have come to the United States from other lands. Approximately 10 million passed through on their way to some other place or returned to their original homelands, leaving a net gain of some 47 million people. [26]

Shifts in European migration

Before 1881, the vast majority of immigrants, almost 86% of the total, arrived from Northwestern Europe, principally Great Britain, Ireland, Germany, and Scandinavia, known as "Old Immigration". The years between 1881 and 1893 the pattern shifted, in the sources of U.S. "New Immigration". Between 1894 and 1914, immigrants from Central, Eastern, and Southern Europe accounted for 69% of the total. [27] [28] [29] Prior to 1960, the overwhelming majority came from Europe or of European descent from Canada. Immigration from Europe as a proportion of new arrivals has been in decline since the mid-20th century, with 75.0% of the total foreign-born population born in Europe compared to 12.1% recorded in the 2010 census. [30]

Immigration since 1820

European immigration to the U.S. 1820–1970 [31] [32] [33] [34] [35]
YearsArrivalsYearsArrivalsYearsArrivals
1820–183098,8161901–19108,136,0161981–1990
1831–1840495,6881911–19204,376,5641991–2000
1841–18501,597,5021921–19302,477,853
1851–18602,452,6571931–1940348,289
1861–18702,064,4071941–1950621,704
1871–18802,261,9041951–19601,328,293
1881–18904,731,6071961–19701,129,670
1891–19003,558,7931971–1980
ArrivalsTotal35,679,763
Country of origin 1820–1978 [36] [37] [38]
CountryArrivals % of totalCountryArrivals % of total
Germany 16,978,00014.3% Norway 856,0001.8%
Italy 5,294,00010.9% France 751,0001.5%
Great Britain 4,898,00010.01% Greece 655,0001.3%
Ireland 4,723,0009.7% Portugal 446,0000.9%
Austria-Hungary 1,24,315,0008.9% Denmark 364,0000.7%
Russia 1,23,374,0006.9% Netherlands 359,0000.7%
Sweden 1,272,0002.6% Finland 33,0000.1%
Total34,318,000
European-born population

The figures below show that of the total population of specified birthplace in the United States. A total of 11.1% were born-overseas of the total population.

Population / Proportion
born in Europe in 1850–2016
YearPopulation% of foreign-born
18502,031,86792.2%
18603,807,06292.1%
18704,941,04988.8%
18805,751,82386.2%
18908,030,34786.9%
19008,881,54886.0%
191011,810,11587.4%
192011,916,04885.7%
193011,784,01083.0%
19607,256,31175.0%
19705,740,89161.7%
19805,149,57239.0%
19904,350,40322.9%
20004,915,55715.8%
20104,817,43712.1%
20164,785,26710.9%
Source: [39] [30] [40] [41]
BirthplacePopulation
in 2010
Percent
in 2010
Population
in 2016
Percent
in 2016
Totals, European-born4,817,43712.0%4,785,26710.9%
Northern Europe 923,5642.3%950,8722.2%
United Kingdom 669,7941.7%696,8961.6%
Ireland 124,4570.3%125,8400.3%
Other Northern Europe129,3130.3%128,1360.3%
Western Europe 961,7912.4%939,3832.1%
Germany 604,6161.5%563,9851.3%
France 147,9590.4%175,2500.4%
Other Western Europe209,2160.5%200,1480.4%
Southern Europe 779,2942.0%760,3521.7%
Italy 364,9720.9%335,7630.8%
Portugal 189,3330.5%176,6380.4%
Other Southern Europe224,9890.6%247,9510.5%
Eastern Europe 2,143,0555.4%2,122,9514.9%
Poland 475,5031.2%424,9281.0%
Russia 383,1661.0%397,2360.9%
Other Eastern Europe1,284,2863.2%1,300,7873.0%
Other Europe (no country specified)9,7330.0%11,7090.0%
Source: 2010 and 2016 [42]

Demographics

The New York City Metropolitan Area is home to the largest European population in the United States. A view of New York City with the Empire State Building and One World Trade Center from the Rockefeller Center.jpg
The New York City Metropolitan Area is home to the largest European population in the United States.

The data below give numbers of European Americans as measured by the U.S. Census in 1980, 1990, 2000 and 2020. The numbers are measured according to declarations in census responses. This leads to uncertainty over the real meaning of the figures: For instance, as can be seen, according to these figures, the European American population dropped 40 million in ten years, but in fact, is a reflection of changing census responses. In particular, it reflects the increased popularity of the "American" option following its inclusion as an example in the 1990 and 2000 census forms.[ citation needed ]

Breakdowns of the European American population into sub-components is a difficult and rather arbitrary exercise. Farley (1991) argues that "because of ethnic intermarriage, the numerous generations that separate respondents from their forebears and the apparent unimportance to many whites of European origin, responses appear quite inconsistent". [44]

In particular, a large majority of European Americans have ancestry from a number of different countries and the response to a single "ancestry" gives little indication of the backgrounds of Americans today. When only prompted for a single response, the examples given on the census forms and a pride in identifying the more distinctive parts of one's heritage are important factors; these will likely adversely affect the numbers reporting ancestries from the British Isles. Multiple response ancestry data often greatly increase the numbers reporting for the main ancestry groups, although Farley goes as far to conclude that "no simple question will distinguish those who identify strongly with a specific European group from those who report symbolic or imagined ethnicity." He highlights responses in the Current Population Survey (1973) where for the main "old" ancestry groups (e.g., German, Irish, English, and French), over 40% change their reported ancestry over the six-month period between survey waves (page 422).[ citation needed ]

The largest self-reported ancestries in 2000, reporting over 5 million members, were in order: German, Irish, English, American, Italian, French, and Polish. They have different distributions within the United States; in general, the northern half of the United States from Pennsylvania westward is dominated by German ancestry, and the southern-half by English and American. Irish may be found throughout the entire country. Italian ancestry is most common in the Northeast, Polish in the Great Lakes Region and the Northeast, and French in New England and Louisiana. U.S. Census Bureau statisticians estimate that approximately 62 percent of European Americans today are either wholly or partly of English, Welsh, Irish, or Scottish ancestry. Approximately 86% of European Americans today are of Central and Northwestern European ancestry, and 14% are of Eastern European, Southern European, Southeastern European, and Euro-Latino descent.[ citation needed ]

Ancestral origins

Ethnic origin 1980 / % [45] 1990 / % [46] [47] 2000 / % [48] 2020 / % [49] [50] change
2000–2020
United States pop.226,545,805100.0248,709,873100.0281,421,906100.0331,449,281100.0Increase2.svg7.4%
At least one ancestry
reported
188,302,43883.1224,788,50290.4225,310,41180.1TBATBA
Acadian/Cajun 668,2710.385,4140.0132,6240.1
Albanian 38,6580.0247,7100.0113,6610.0236,6350.1
Alsatian 42,3900.0216,4650.015,6010.012,0560.00
American [lower-alpha 5] 13,298,7615.912,395,9995.020,625,0937.3--
Austrian 948,5580.42864,7830.3735,1280.3697,4250.3
Basque 43,1400.047,9560.057,7930.052,5590.0
Bavarian 4,3480.0-----
Belarusian 7,3810.004,2770.0--67,5990.0
Belgian 360,2770.16380,498 [lower-alpha 6] 0.2360,6420.1384,2240.2
British 1,119,1540.41,085,7200.4860,3150.4
British Islander 43,6540.0
Bulgarian 42,5040.0229,5950.055,4890.0102,9680.0
Carpatho Rusyn 7,6020.09,7470.00
Celtic 29,6520.065,6380.030,6300.0
Cornish 3,9910.0--6,2570.0
Croatian 252,9700.11544,2700.2374,2410.1448,4790.2
Cypriot 6,0530.004,8970.07,6630.010,3840.00
Czech 1,892,4560.841,296,411 [lower-alpha 7] 0.51,262,5270.41,397,7800.6
Czechoslovakian 315,2850.1441,4030.2--
Danish 1,518,2730.671,634,6690.71,430,8970.51,314,2090.6
Dutch 6,304,4992.786,227,0892.54,542,4941.63,649,1791.6
Eastern European [lower-alpha 8] 62,4040.03132,3320.1----
English 49,598,03521.8932,651,78813.124,515,1388.746,550,96819.8
Estonian 25,9940.0126,7620.025,0340.030,0540.0
European [lower-alpha 8] 175,4610.08466,7180.21,968,6960.7--
Finnish 615,8720.27658,8700.3623,5730.2684,3730.3
Flemish 14,1570.0384,2240.2
French 12,892,2465.6910,320,9354.18,309,9083.07,994,0883.4
French Canadian 780,4880.342,167,1270.92,349,6840.8933,7400.4
German 49,224,14621.7357,947,171 [lower-alpha 9] 23.342,885,16215.244,978,54619.1
German Russian 10,1530.010,5350.0
Greek 959,8560.421,110,3730.41,153,3070.4568,5640.2
Hungarian 1,776,9020.781,582,3020.61,398,7240.5684,3730.3
Icelandic 32,5860.0140,5290.042,7160.055,6020.0
Irish 40,165,70217.7338,735,539 [lower-alpha 10] 15.630,528,49210.838,597,42816.4
Italian 12,183,6925.3814,664,550 [lower-alpha 11] 5.915,723,5555.616,813,2357.1
Latvian 92,1410.04100,3310.087,5640.092,9440.0
Lithuanian 742,7760.33811,8650.3659,9920.2711,0890.3
Luxemburger 49,9940.0249,0610.045,1390.057,3590.0
Macedonian 20,3650.038,0510.051,4010.0
Maltese 31,6450.0139,6000.040,1590.044,8740.0
Manx 9,2200.006,3170.06,9550.08,7040.0
Moravian 3,7810.0----
Northern Irelander 16,4180.014,0090.03,6930.05,1810.0
Norwegian 3,453,8391.523,869,3951.64,477,7251.63,836,8841.6
Pennsylvania German 305,8410.1255,8070.1169,8210.1
Polish 8,228,0373.639,366,1063.88,977,4443.28,599,6013.7
Portuguese 1,024,3510.451,153,3510.51,177,1120.41,454,2620.6
Prussian 25,4690.0----
Romanian 315,2580.14365,5440.1367,3100.1416,5450.2
Russian 2,781,4321.232,952,9871.22,652,2140.92,412,1311.0
Saxon 4,5190.0
Scandinavian 475,0070.21678,8800.3425,0990.21,217,3330.5
Scots-Irish 5,617,7732.34,319,2321.5794,4780.3
Scottish 10,048,8164.445,393,5812.24,890,5811.78,422,6133.6
Serbian 100,9410.04116,7950.0140,3370.0204,3800.1
Sicilian 50,3890.0----
Slavic172,6960.0876,9310.0127,1370.0180,3160.1
Slovak 776,8060.341,882,8970.8797,7640.3691,4550.3
Slovenian 126,4630.06124,4370.1176,6910.1196,5130.1
Soviet 7,7290.0----
Spaniard 94,5280.04360,9350.1299,9480.1978,9780.4
Spanish 2,686,680-2,024,0040.82,187,1440.8866,3560.4
Swedish 4,345,3921.924,680,8631.93,998,3101.43,839,7961.6
Swiss 981,5430.431,045,4950.4911,5020.3946,1790.4
Ukrainian 730,0560.32740,7230.3892,9220.3953,5090.4
Welsh 1,664,5980.732,033,8930.81,753,7940.61,977,3830.8
West German 3,8850.0----
Yugoslav 360,1740.16257,9940.1328,5470.1--

Culture

American cultural icons, apple pie, baseball, and the American flag. All have European influence primarily from the British. Motherhood and apple pie.jpg
American cultural icons, apple pie, baseball, and the American flag. All have European influence primarily from the British.

As the largest component of the American population, the overall American culture deeply reflects the European-influenced culture that predates the United States of America as an independent state. Much of American culture shows influences from the diverse nations of the United Kingdom and Ireland, such as the English, Irish, Cornish, Manx, Scotch-Irish, Scottish and Welsh. Colonial ties to the United Kingdom spread the English language, legal system and other cultural attributes. [4]

Scholar David Hackett Fischer asserts in Albion's Seed: Four British Folkways in America that the folkways of four groups of people who moved from distinct regions of the United Kingdom to the United States persisted and provide a substantial cultural basis for much of the modern United States. [51] Fischer explains "the origins and stability of a social system which for two centuries has remained stubbornly democratic in its politics, capitalist in its economy, libertarian in its laws and individualist in its society and pluralistic in its culture." [52]

Much of the European-American cultural lineage can be traced back to Western and Northern Europe, which is institutionalized in the government, traditions, and civic education in the United States. [53] Since most later European Americans have assimilated into American culture, many Americans of European ancestry now generally express their personal ethnic ties sporadically and symbolically and do not consider their specific ethnic origins to be essential to their identity; however, European American ethnic expression has been revived since the 1960s. [54] Some European Americans such as Italians, Greeks, Poles, Germans, Ukrainians, Irish, and others have maintained high levels of ethnic identity. In the 1960s, the melting pot ideal to some extent gave way to increased interest in cultural pluralism, strengthening affirmations of ethnic identity among various American ethnic groups, European as well as others. [54]

Law

The American legal system also has its roots in French philosophy with the separation of powers and the federal system [55] along with English law in common law. [56] For example, elements of the Magna Carta in it contain provisions on criminal law that were incorporated into the Bill of Rights of the U.S. Constitution. It as well as other documents had elements influencing and incorporated into the United States Constitution.[ citation needed ]

Cuisine

Hamburgers were invented by German immigrants. Hamburger (black bg).jpg
Hamburgers were invented by German immigrants.

Thanksgiving

Sports

Music

Another area of cultural influence are American Patriotic songs:

Before 1931, other songs served as the hymns of American officialdom.

Admixture in non-Latino whites

Some European Americans have varying amounts of Native American and Native African ancestry. In a recent study, Gonçalves et al. 2007 reported Native African and Native American mtDna lineages at a frequency of 3.1% (respectively 0.9% and 2.2%) in European Americans, although that frequency may be scattered by region. [74]

DNA analysis on native European Americans by geneticist Mark D. Shriver showed an average of 0.7% Native African admixture and 3.2% Native American admixture. [75] The same author, in another study, claimed that about 30% of all European Americans, approximately 66 million people, have a median of 2.3% of native African admixture. [76] Later, Shriver retracted his statement, saying that actually around 5% of European Americans exhibit some detectable level of native African ancestry. [77]

From the 23andMe database, about 5 to at least 13 percent of self-identified European American Southerners have greater than 1 percent native African ancestry. [78] Southern states with the highest African American populations tended to have the highest percentages of hidden African ancestry. [79] European Americans on average are: "98.6 percent Native European, 0.19 percent Native African and 0.18 percent Native American." Inferred British/Irish ancestry is found in European Americans from all states at mean proportions of above 20%, and represents a majority of ancestry, above 50% mean proportion, in states such as Mississippi, Arkansas, and Tennessee. Scandinavian ancestry in European Americans is highly localized; most states show only trace mean proportions of Scandinavian ancestry, while it comprises a significant proportion, upwards of 10%, of ancestry in European Americans from Minnesota and the Dakotas. [78] [79]

See also

Notes

  1. The figure does not include respondents ignoring the ancestry question.
  2. Germany in this time period consisted of a large number of separate countries, the largest of which was Prussia.
  3. The Other category probably contains mostly English ancestry settlers; but the loss of several states' census records in makes closer estimates difficult. The summaries of the 1790 and 1800 census from all states surveyed.
  4. Total represents total immigration over the approximately 130-year span of colonial existence of the U.S. colonies as found in the 1790 census. At the time of the American Revolution the foreign born population was estimated to be from 300,000 to 400,000.
  5. The category "American" or "United States" was under "ancestry not specified" in the 1980 and 1990 census results. However they are shown separately in the 2000 census comparison brief showing 12,395,999 as American and 643,561 as United States in 1990.
  6. Excludes Flemish. [47]
  7. Excludes Moravian. [47]
  8. 1 2 This category represents a general type response, which may encompass several ancestry groups. [47]
  9. Excludes Bavarian, Prussian, Saxon, and West German. [47]
  10. Excludes Northern Irish and Celtic. [47]
  11. Excludes Sicilian. [47]

Related Research Articles

White is a racialized classification of people generally used for those of mostly European ancestry. It is also a skin color specifier, although the definition can vary depending on context, nationality, ethnicity and point of view.

<span class="mw-page-title-main">Mexican Americans</span> Americans of Mexican ancestry

Mexican Americans are Americans of Mexican heritage. In 2022, Mexican Americans comprised 11.2% of the US population and 58.9% of all Hispanic and Latino Americans. In 2019, 71% of Mexican Americans were born in the United States; they make up 53% of the total population of foreign-born Hispanic Americans and 25% of the total foreign-born population. Chicano is a term used by some to describe the unique identity held by Mexican-Americans. The United States is home to the second-largest Mexican community in the world, behind only Mexico. Most Mexican Americans reside in the Southwest, with over 60% of Mexican Americans living in the states of California and Texas.

In the United States census, the U.S. Census Bureau and the Office of Management and Budget define a set of self-identified categories of race and ethnicity chosen by residents, with which they most closely identify. Residents can indicate their origins alongside their race, and are asked specifically whether they are of Hispanic or Latino origin in a separate question.

Anglo is a prefix indicating a relation to, or descent from England, English culture, the English people or the English language, such as in the term Anglosphere. It is often used alone, somewhat loosely, to refer to people of British descent in Anglo-America, the Anglophone Caribbean, South Africa, Namibia, Australia, and New Zealand. It is used in Canada to differentiate between French speaking Canadians (Francophones), located mainly in Quebec but found across Canada, and English speaking Canadians (Anglophones), also located across Canada, including in Quebec. It is also used in the United States to distinguish the Latino population from the non-Latino white majority.

British Americans usually refers to Americans whose ancestral origin originates wholly or partly in the United Kingdom. It is primarily a demographic or historical research category for people who have at least partial descent from peoples of Great Britain and the modern United Kingdom, i.e. English, Scottish, Irish, Welsh, Scotch-Irish, Orcadian, Manx, Cornish Americans and those from the Channel Islands and Gibraltar.

<span class="mw-page-title-main">White Americans</span> People of the United States who are considered or consider themselves White

White Americans are Americans who identify as white people. This group constitutes the majority of the people in the United States. According to the 2020 census, 71%, or 235,411,507 people, were White alone or in combination, and 61.6%, or 204,277,273 people, were White alone. This represented a national white demographic decline from a 72.4% white alone share of the U.S. population in 2010.

<span class="mw-page-title-main">Race and ethnicity in the United States</span>

The United States has a racially and ethnically diverse population. At the federal level, race and ethnicity have been categorized separately. The most recent United States census recognized five racial categories, as well as people who belong to two or more of the racial categories. The United States also recognizes the broader notion of ethnicity. The 2000 census and 2010 American Community Survey inquired about the "ancestry" of residents, while the 2020 census allowed people to enter their "origins". The Census Bureau also classified respondents as either Hispanic or Latino, identifying as an ethnicity, which comprises the minority group in the nation.

<span class="mw-page-title-main">Demographics of Manhattan</span>

New York County, coterminous with the New York City borough of Manhattan, is the most densely populated U.S. county, with a density of 70,825.6/mi2 (27,267.4/km2) as of 2013. In 1910, it reached a peak of 101,548/mi2 (39,222.9/km2). The county is one of the original counties of New York State.

According to the U.S. Census Bureau, as of 2023, Texas was the second largest state in population after California, with a population of 30,503,301, an increase of more than 1.3 million people, or 4.7%, since the 29,145,505 of the 2020 census. Its apportioned population in 2020 was 29,183,290. Since the beginning of the 21st century, the state of Texas has experienced strong population growth. Texas has many major cities and metropolitan areas, along with many towns and rural areas. Much of the population is concentrated in the major cities of Dallas–Fort Worth, Austin, San Antonio, Houston, McAllen, and El Paso and their corresponding metropolitan areas. The first four aforementioned main urban centers are also referred to as the Texas Triangle megaregion.

<span class="mw-page-title-main">Demographics of New York (state)</span>

According to the U.S. Census Bureau, as of 2023, New York was the fourth largest state in population after California, Texas, and Florida, with a population of 19,571,216, a decrease of over 600,000 people, or −3.1%, since the 2020 census. The population change between 2000–2006 includes a natural increase of 601,779 people and a decrease due to net migration of 422,481 people out of the state. Immigration from outside the United States resulted in a net increase of 820,388 people, and migration within the country produced a net loss of about 800,213.

White Hispanic and Latino Americans, also called Euro-Hispanics, Euro-Latinos, White Hispanics, or White Latinos, are Americans of white ancestry and ancestry from Latin America. It also refers to people of European ancestry from Latin America that speak Spanish natively and immigrated to the United States.

<span class="mw-page-title-main">West Indian Americans</span> Americans of West Indian (Caribbean) birth or descent

Caribbean Americans or West Indian Americans are Americans who trace their ancestry to the Caribbean. Caribbean Americans are a multi-ethnic and multi-racial group that trace their ancestry further in time mostly to Africa, as well as Asia, the Indigenous peoples of the Americas, and to Europe. As of 2016, about 13 million — about 4% of the total U.S. population — have Caribbean ancestry.

The legal and social strictures that define White Americans, and distinguish them from persons who are not considered White by the government and society, have varied throughout the history of the United States.

<span class="mw-page-title-main">European emigration</span> European-descended people living outside Europe

European emigration is the successive emigration waves from the European continent to other continents. The origins of the various European diasporas can be traced to the people who left the European nation states or stateless ethnic communities on the European continent.

Asian people are the people of Asia. The term may also refer to their descendants. According to the Merriam-Webster dictionary, an Asian is “a person of Asian descent”.

<span class="mw-page-title-main">Americans</span> Citizens and nationals of the United States

Americans are the citizens and nationals of the United States. The United States is home to people of many racial and ethnic origins; consequently, American law does not equate nationality with race or ethnicity, but with citizenship and an oath of permanent allegiance.

Multiracial Americans or mixed-race Americans are Americans who have mixed ancestry of two or more races. The term may also include Americans of mixed-race ancestry who self-identify with just one group culturally and socially. In the 2020 United States census, 33.8 million individuals or 10.2% of the population, self-identified as multiracial. There is evidence that an accounting by genetic ancestry would produce a higher number.

<span class="mw-page-title-main">Demographics of Georgia (U.S. state)</span>

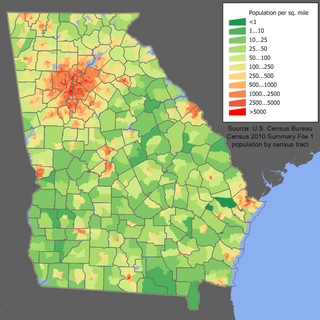
Georgia is a South Atlantic U.S. state with a population of 10,711,908 according to the 2020 United States census, or just over 3% of the U.S. population. The majority of the state's population is concentrated within Metro Atlanta, although other highly populated regions include: West Central and East Central Georgia; West, Central, and East Georgia; and Coastal Georgia; and their Athens, Columbus, Macon and Warner Robins, Augusta, Savannah, Hinesville, and Brunswick metropolitan statistical areas.

American ancestry refers to people in the United States who self-identify their ancestral origin or descent as "American", rather than the more common officially recognized racial and ethnic groups that make up the bulk of the American people. The majority of these respondents are visibly White Americans, who are far removed from and no longer self-identify with their original ethnic ancestral origins. The latter response is attributed to a multitude of generational distance from ancestral lineages, and these tend be Anglo-Americans of English, Scotch-Irish, Welsh, Scottish or other British ancestries, as demographers have observed that those ancestries tend to be recently undercounted in U.S. Census Bureau American Community Survey ancestry self-reporting estimates.

<span class="mw-page-title-main">Non-Hispanic whites</span> White Americans who are not Hispanic

Non-Hispanic Whites, Non-Latino Whites, or more simply White Americans, are Americans classified by the United States census as "white" and not Hispanic. According to the United States Census Bureau yearly estimates, as of July 1, 2022, Non-Hispanic whites make up about 59.3% of the U.S. population, or 197,639,521 people. The United States Census Bureau defines white to include European Americans, Middle Eastern Americans, and North African Americans. Americans of European ancestry are divided into various ethnic groups. More than half of the white population are German, Irish, English, French and Polish Americans. Many Americans are also the product of other European groups that migrated to parts of the US in the 19th and 20th centuries, as the bulk of immigrants from various countries in Northern, Central, Eastern, and Southeastern Europe, as well as the Caucasus region, migrated to the United States.

References

  1. "European Immigrants in the United States". Migration Policy Institute. August 2018.
  2. "Race and Ethnicity in the United States: 2010 Census and 2020 Census". US Census Bureau. August 12, 2021. Retrieved November 5, 2023.
  3. "Euro-American". Merriam Webster Dictionary. Merriam-Webster, Incorporated. Retrieved March 13, 2014.
  4. 1 2 James B. Minahan (March 14, 2013). "Americans of European descent". Ethnic Groups of the Americas: An Encyclopedia. pp. 17–18. ISBN   9781610691642.
  5. "A Spanish Expedition Established St. Augustine in Florida". Library of Congress . Retrieved March 27, 2009.
  6. Figueredo, D. H. (2007). Latino Chronology. ISBN   9780313341540 . Retrieved February 4, 2015.
  7. "Census Bureau Releases 2020 Census Population for More Than 200 New Detailed Race and Ethnicity Groups". September 21, 2023. Retrieved October 30, 2023.
  8. Pulera, Dominic J. "Sharing the Dream: White Males in a Multicultural America" . Retrieved October 30, 2023.
  9. Farley, Reynolds (1991). "The New Census Question about Ancestry: What Did It Tell Us?". Demography. 28 (3): 411–29. doi: 10.2307/2061465 . JSTOR   2061465. PMID   1936376. S2CID   41503995.
  10. Stanley Lieberson and Lawrence Santi, "The Use of Nativity Data to Estimate Ethnic Characteristics and Patterns", Social Science Research, Vol. 14, No. 1 (1985), pp. 44-6.
  11. Stanley Lieberson and Mary C. Waters, "Ethnic Groups in Flux: The Changing Ethnic Responses of American Whites", Annals of the American Academy of Political and Social Science, Vol. 487, No. 79 (September 1986), pp. 82–86.
  12. Bryc, Katarzyna; Durand, Eric Y.; Macpherson, J. Michael; Reich, David; Mountain, Joanna L. (2015). "The Genetic Ancestry of African Americans, Latinos, and European Americans across the United States". The American Journal of Human Genetics. 96 (1): 37–53. doi: 10.1016/j.ajhg.2014.11.010 . ISSN   0002-9297. PMC   4289685 . PMID   25529636.
  13. "1980 Census of Population: Ancestry of the population by state: 1980" (PDF). United States Census Bureau. Retrieved November 5, 2023.
  14. "Ancestry: 2000 Census in Brief" (PDF). United States Census Bureau. Retrieved November 5, 2023.
  15. "A Test of Methods For Collecting Racial and Ethnic Information: May 1995" (Press release). CPS Publications. October 26, 1995. Archived from the original on December 12, 2011. Retrieved March 24, 2015.
  16. Sandra Soo-Jin Lee; Joanna Mountain; Barbara A. Koenig (May 24, 2001). "The Meanings of Race in the New Genomics: Implications for Health Disparities Research" (PDF). Yale University. p. 54. Archived from the original (PDF) on March 3, 2016. Retrieved March 11, 2016.
  17. Bhopal, Raj. (1998). "White, European, Western, Caucasian or What? Inappropriate Labeling in Research on Race, Ethnicity and Health". Am J Public Health. 88 (9): 1303–7. doi:10.2105/ajph.88.9.1303. PMC   1509085 . PMID   9736867.
  18. Adair, Margo (1990). "Challenging White Supremacy Workshop" (PDF). cwsworkshop.org. Retrieved November 5, 2006.
  19. Victor C. Romero (2014). "The Criminalization of Undocumented Migrants". In Lois Ann Lorentzen (ed.). Hidden Lives and Human Rights in the United States (3 volumes): Understanding the Controversies and Tragedies of Undocumented Immigration. Praeger Publications. p. 16. ISBN   978-1440828478. The 1924 act also sought to curtail the large number of eastern and southern European migrants who began entering the United States in 1890. Through the National Origins Quota formula, the act pegged future immigration at up to 2 percent of the number of foreign-born persons from a particular country already in the United States as of the 1890 census. Through race-neutral in language, the formula favored northwestern Europeans by using the 1890 census as its referent
  20. Paul Spickard (2007). "The Great Wave, 1870-1930". Almost All Aliens: Immigration, Race, and Colonialism in American History and Identity: Race, Colonialism, and Immigration in American History and Identity. Routledge. p. 176. ISBN   978-0415935937. Although many histories of immigration describe this period from the 1870s to the 1920s as one when the sources of migrants shifted from Northwest Europe to Southern and Eastern Europe - "Old Immigration" versus the "New Immigration," Northwest Europeans continued to come and stay in very large numbers.
  21. Benjamin Bailey (2002). "Introduction". Language, Race, and Negotiation of Identity: A Study of Dominican Americans. University of Massachusetts Amherst. p. 15. During the heightened immigration associated with the 1880-1920 period, many doubted that the largely Southern and Eastern European newcomers would ever assimilate to the culture of the dominant groups, who were of predominantly Northwestern European origin ... Social differences between these immigrants and European Americans who were already in America were perceived as insurmountable.
  22. Loretto, Dennis Szucs; Hargreaves Luebking, Sandra. "The source: a guidebook to American genealogy" . Retrieved November 5, 2023. (excludes African population)
  23. Data From Ann Arbor, MI: Inter-university Consortium for Political and Social Research (ICPS).
  24. EUROPEAN COLONIZATION OF NORTH AMERICA
  25. United States History - The First Europeans
  26. Waters, Mary C.; Ueda, Reed; Marrow, Helen B. (June 30, 2009). The New Americans. ISBN   9780674044937 . Retrieved February 4, 2015.
  27. Raymond L. Cohn (August 15, 2001). "Immigration to the United States". EH.Net Encyclopedia. Archived from the original on January 13, 2006. Retrieved March 24, 2015.
  28. "MPI Data Hub Graph". migrationinformation.org. Archived from the original on April 22, 2007. Retrieved March 24, 2015.
  29. Loretto Dennis Szucs; Sandra Hargreaves Luebking (2006). The Source: A Guidebook to American Genealogy . Ancestry Publishing. p.  367. ISBN   978-1-59331-277-0 . Retrieved March 11, 2016.
  30. 1 2 Elizabeth M. Grieco; Yesenia D. Acosta; G. Patricia de la Cruz; Christine Gambino; Thomas Gryn; Luke J. Larsen; Edward N. Trevelyan; Nathan P. Walters (May 2012). "The Foreign-Born Population in the United States: 2010" (PDF). US Census Bureau. Archived from the original (PDF) on February 9, 2015. Retrieved March 11, 2016.
  31. "Statistical Abstract of the United States Immigration from 1820". p. 98. Retrieved November 5, 2023.
  32. Spickard, Paul. "Almost All Aliens: Immigration, Race, and Colonialism in American History" . Retrieved November 5, 2023.
  33. "Statistical Abstract of the United States". p. 89. Retrieved November 5, 2023.
  34. "Statistical Abstract of the United States: Immigration by country of origin 1851–1940". p. 107. Retrieved November 5, 2023.
  35. "Statistical Abstract of the United States". p. 92. Retrieved November 5, 2023.
  36. Public Opinion and the Immigrant: Mass Media Coverage, 1880–1980 Archived August 13, 2015, at the Wayback Machine Rita James Simon
  37. Wagner, Francis S; Wagner-Jones, Christina (1985). Nation-building in the United States. ISBN   978-0-912404-12-7.
  38. "European emigration statistics". Archived from the original on August 24, 2000.
  39. Campbell Gibson; Kay Jung (February 2006). "Population Division: Historical census statistics on the foreign-born population of the United States: 1850 to 2000 (Working Paper No. 81)" (PDF). US Census Bureau. Retrieved March 11, 2016.
  40. "Foreign-Born Population by Country of Birth: 1960, 1970, 1980, and 1990 plus 2000, 2006–2011" (XLSX). Migration Policy Institute. Retrieved March 11, 2016.
  41. United States Demographics & Social Archived July 6, 2016, at the Wayback Machine 2015% Foreign-Born population in the United States
  42. "PLACE OF BIRTH FOR THE FOREIGN-BORN POPULATION IN THE UNITED STATES. Universe: Foreign-born population excluding population born at sea". factfinder.census.gov. Archived from the original on February 14, 2020. Retrieved April 23, 2018.
  43. "Yearbook of Immigration Statistics: 2011 Supplemental Table 2". U.S. Department of Homeland Security. Retrieved February 23, 2013.
  44. Farley, Reynolds (1991). "The New Census Question about Ancestry: What Did It Tell Us?". Demography. 28 (3): 411–429. doi: 10.2307/2061465 . JSTOR   2061465. PMID   1936376. S2CID   41503995.
  45. "Ancestry of the Population by State: 1980 – Table 2" (PDF). United States Census Bureau. Retrieved November 21, 2018.
  46. "Ancestry: 2000 Census in Brief" (PDF). United States Census Bureau. Retrieved November 5, 2023.
  47. 1 2 3 4 5 6 7 "1990 Census of Population – Detailed Ancestry Groups for States" (PDF). United States Census Bureau. Retrieved November 21, 2018.
  48. "Ancestry: 2000 Census in Brief" (PDF). United States Census Bureau. Retrieved November 5, 2023.
  49. "Detailed Races and Ethnicities in the United States and Puerto Rico: 2020 Census". United States census. September 21, 2023. Retrieved October 21, 2023.
  50. "Eight Hispanic Groups Each Had a Million or More Population in 2020". United States census. September 21, 2023. Retrieved November 5, 2023.
  51. David Hackett Fischer, Albion's Seed (Oxford University Press, 1989), p. 6
  52. Hackett Fischer, David. Albion's Seed Oxford University Press, 1989.
  53. Kirk, Russell. The Heritage Lecture Series. "America Should Strengthen its European Cultural Roots." Washington D.C:1949
  54. 1 2 Randolph, Gayle (2007). "Why Study European Immigrants". Iowa State University. Archived from the original on May 6, 2005. Retrieved June 14, 2007.
  55. Separation of powers#Checks and balances
  56. "Features – Sources of United States of America Legal Information in Languages Other than English – LLRX.com". Archived from the original on April 2, 2015. Retrieved March 17, 2015. LLRX
  57. Fischer, pp. 74, 114, 134–39.
  58. according to a theory; see Hamburger
  59. Clark, Sandy Thorne. (June 26, 2006), "Getting a taste of Chicago: City's signature flavors have tourists and locals lining up for more, more, more", Chicago Sun-Times, S1.
  60. The Italian American Cookbook: A Feast of Food from a Great American Cooking – By John Mariani, Galina Mariani
  61. "The Extra-Long History of the Hot Dog". March 31, 2021.
  62. "Who Invented Pizza?". May 5, 2023.
  63. "The surprising origin of fried chicken".
  64. William Bradford, Of Plymouth Plantation 1620–1647, 85
  65. Sulat, Nate (July 26, 2013). "Why isn't baseball more popular in the UK?". BBC News Online . New York. Retrieved March 1, 2018.
  66. "UK – England – Baseball 'origin' uncovered". BBC. September 17, 2008. Retrieved February 4, 2015.
  67. "BBC – South Today – Features – Baseball history". BBC.
  68. Pope, S. W.; Pope, Steven W. (1997). The New American Sport History. ISBN   9780252065675 . Retrieved February 4, 2015.
  69. "The history of golf". July 12, 2004. Retrieved August 3, 2022.
  70. "John Stafford Smith: Composer of the Star Spangled Banner". visit-gloucestershire.co.uk. Archived from the original on July 11, 2007.
  71. "Fort McHenry: Birthplace of Our National Anthem". bcpl.net. Archived from the original on July 21, 2007.
  72. Lesley Nelson. "Star Spangled Banner". contemplator.com. Retrieved February 4, 2015.
  73. "Amazing Grace". NPR. December 29, 2002. Retrieved March 24, 2015.
  74. Sample of 1387 American Caucasian individuals catalogued in the FBI mtDNA population database, Gonçalves et al. 2007, Sex-biased gene flow in African Americans but not in American Caucasians Archived November 8, 2017, at the Wayback Machine
  75. Shriver, et al., "Skin pigmentation, biogeographical ancestry and admixture mapping Archived December 30, 2014, at the Wayback Machine , Hum Genet (2003) 112 : 387–39.
  76. Sailer, Steve (May 8, 2002). "Analysis: White prof finds he's not". United Press International .
  77. Wootan, Jim (December 2003). "Race Reversal Man Lives as 'Black' for 50 Years – Then Finds Out He's Probably Not". ABC News . Archived from the original on August 3, 2004.
  78. 1 2 Bryc, Katarzyna; Durand, Eric Y; MacPherson, J Michael; Reich, David; Mountain, Joanna (2014). "The genetic ancestry of African, Latino, and European Americans across the United States". bioRxiv   10.1101/009340 .
  79. 1 2 Scott Hadly, "Hidden African Ancestry Redux", DNA USA* Archived March 22, 2015, at the Wayback Machine , 23andMe, March 4, 2014.