Fold change is a measure describing how much a quantity changes between an original and a subsequent measurement. It is defined as the ratio between the two quantities; for quantities A and B the fold change of B with respect to A is B/A. In other words, a change from 30 to 60 is defined as a fold-change of 2. This is also referred to as a "one fold increase". Similarly, a change from 30 to 15 is referred to as a "0.5-fold decrease". Fold change is often used when analysing multiple measurements of a biological system taken at different times as the change described by the ratio between the time points is easier to interpret than the difference.
Fold change is so called because it is common to describe an increase of multiple X as an "X-fold increase". As such, several dictionaries, including the Oxford English Dictionary[1] and Merriam-Webster Dictionary,[2] as well as Collins's Dictionary of Mathematics, define "-fold" to mean "times", as in "2-fold" = "2 times" = "double". Likely because of this definition, many scientists use not only "fold", but also "fold change" to be synonymous with "times", as in "3-fold larger" = "3 times larger".[3][4][5]
Fold change is often used in analysis of gene expression data from microarray and RNA-Seq experiments for measuring change in the expression level of a gene.[6] A disadvantage and serious risk of using fold change in this setting is that it is biased[7] and may misclassify differentially expressed genes with large differences (B − A) but small ratios (B/A), leading to poor identification of changes at high expression levels. Furthermore, when the denominator is close to zero, the ratio is not stable, and the fold change value can be disproportionately affected by measurement noise.
Alternative definition
There is an alternative definition of fold change,[citation needed] although this has generally fallen out of use. Here, fold change is defined as the ratio of the difference between final value and the initial value divided by the initial value. For quantities A and B, the fold change is given as (B − A)/A, or equivalently B/A − 1. This formulation has appealing properties such as no change being equal to zero, a 100% increase is equal to 1, and a 100% decrease is equal to −1. However, verbally referring to a doubling as a one-fold change and tripling as a two-fold change is counter-intuitive, and so this formulation is rarely used.
Volcano plot showing metabolomic data. The red arrows indicate points-of-interest that display both large magnitude fold-changes (x axis) and high statistical significance (-log10 of p value, y axis). The dashed red line shows where p = 0.05 with points above the line having p < 0.05 and points below the line having p > 0.05. This plot is colored such that those points having a fold-change less than 2 (log2 = 1) are shown in gray.
In the field of genomics (and more generally in bioinformatics), the modern usage is to define fold change in terms of ratios, and not by the alternative definition.[8][9]
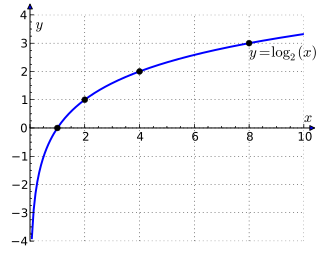
However, log-ratios are often used for analysis and visualization of fold changes. The logarithm to base 2 is most commonly used,[8][9] as it is easy to interpret, e.g. a doubling in the original scaling is equal to a log2 fold change of 1, a quadrupling is equal to a log2 fold change of 2 and so on. Conversely, the measure is symmetric when the change decreases by an equivalent amount e.g. a halving is equal to a log2 fold change of −1, a quartering is equal to a log2 fold change of −2 and so on. This leads to more aesthetically pleasing plots, as exponential changes are displayed as linear and so the dynamic range is increased. For example, on a plot axis showing log2 fold changes, an 8-fold increase will be displayed at an axis value of 3 (since 23 = 8). However, there is no mathematical reason to only use logarithm to base 2, and due to many discrepancies in describing the log2 fold changes in gene/protein expression, a new term "loget" has been proposed.[10]
Biostatistics is a branch of statistics that applies statistical methods to a wide range of topics in biology. It encompasses the design of biological experiments, the collection and analysis of data from those experiments and the interpretation of the results.
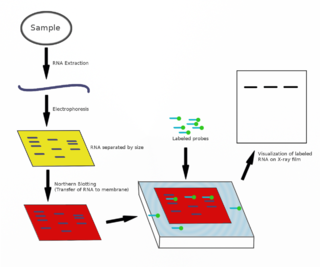
The northern blot, or RNA blot, is a technique used in molecular biology research to study gene expression by detection of RNA in a sample.
Gene expression is the process by which information from a gene is used in the synthesis of a functional gene product that enables it to produce end products, proteins or non-coding RNA, and ultimately affect a phenotype. These products are often proteins, but in non-protein-coding genes such as transfer RNA (tRNA) and small nuclear RNA (snRNA), the product is a functional non-coding RNA. The process of gene expression is used by all known life—eukaryotes, prokaryotes, and utilized by viruses—to generate the macromolecular machinery for life.
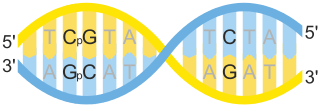
The CpG sites or CG sites are regions of DNA where a cytosine nucleotide is followed by a guanine nucleotide in the linear sequence of bases along its 5' → 3' direction. CpG sites occur with high frequency in genomic regions called CpG islands.
Alternative splicing, or alternative RNA splicing, or differential splicing, is an alternative splicing process during gene expression that allows a single gene to code for multiple proteins. In this process, particular exons of a gene may be included within or excluded from the final, processed messenger RNA (mRNA) produced from that gene. This means the exons are joined in different combinations, leading to different (alternative) mRNA strands. Consequently, the proteins translated from alternatively spliced mRNAs usually contain differences in their amino acid sequence and, often, in their biological functions.
In mathematics, the binary logarithm is the power to which the number 2 must be raised to obtain the value n. That is, for any real number x,
A DNA microarray is a collection of microscopic DNA spots attached to a solid surface. Scientists use DNA microarrays to measure the expression levels of large numbers of genes simultaneously or to genotype multiple regions of a genome. Each DNA spot contains picomoles of a specific DNA sequence, known as probes. These can be a short section of a gene or other DNA element that are used to hybridize a cDNA or cRNA sample under high-stringency conditions. Probe-target hybridization is usually detected and quantified by detection of fluorophore-, silver-, or chemiluminescence-labeled targets to determine relative abundance of nucleic acid sequences in the target. The original nucleic acid arrays were macro arrays approximately 9 cm × 12 cm and the first computerized image based analysis was published in 1981. It was invented by Patrick O. Brown. An example of its application is in SNPs arrays for polymorphisms in cardiovascular diseases, cancer, pathogens and GWAS analysis. It is also used for the identification of structural variations and the measurement of gene expression.
Functional genomics is a field of molecular biology that attempts to describe gene functions and interactions. Functional genomics make use of the vast data generated by genomic and transcriptomic projects. Functional genomics focuses on the dynamic aspects such as gene transcription, translation, regulation of gene expression and protein–protein interactions, as opposed to the static aspects of the genomic information such as DNA sequence or structures. A key characteristic of functional genomics studies is their genome-wide approach to these questions, generally involving high-throughput methods rather than a more traditional "candidate-gene" approach.
The effective population size (Ne) is size of an idealised population would experience the same rate of genetic drift or increase in inbreeding as in the real population. Idealised populations are based on unrealistic but convenient assumptions including random mating, simultaneous birth of each new generation, constant population size. For most quantities of interest and most real populations, Ne is smaller than the census population size N of a real population. The same population may have multiple effective population sizes for different properties of interest, including genetic drift and inbreeding.
Computational genomics refers to the use of computational and statistical analysis to decipher biology from genome sequences and related data, including both DNA and RNA sequence as well as other "post-genomic" data. These, in combination with computational and statistical approaches to understanding the function of the genes and statistical association analysis, this field is also often referred to as Computational and Statistical Genetics/genomics. As such, computational genomics may be regarded as a subset of bioinformatics and computational biology, but with a focus on using whole genomes to understand the principles of how the DNA of a species controls its biology at the molecular level and beyond. With the current abundance of massive biological datasets, computational studies have become one of the most important means to biological discovery.
In the field of molecular biology, gene expression profiling is the measurement of the activity of thousands of genes at once, to create a global picture of cellular function. These profiles can, for example, distinguish between cells that are actively dividing, or show how the cells react to a particular treatment. Many experiments of this sort measure an entire genome simultaneously, that is, every gene present in a particular cell.
Microarray analysis techniques are used in interpreting the data generated from experiments on DNA, RNA, and protein microarrays, which allow researchers to investigate the expression state of a large number of genes – in many cases, an organism's entire genome – in a single experiment. Such experiments can generate very large amounts of data, allowing researchers to assess the overall state of a cell or organism. Data in such large quantities is difficult – if not impossible – to analyze without the help of computer programs.
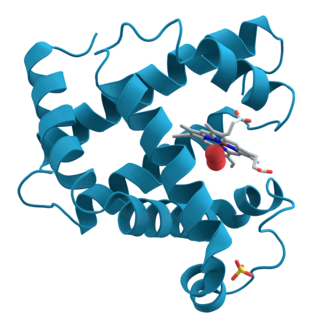
BPI fold containing family A, member 1 (BPIFA1), also known as Palate, lung, and nasal epithelium clone (PLUNC), is a protein that in humans is encoded by the BPIFA1 gene. It was also formerly known as "Secretory protein in upper respiratory tracts" (SPURT). The BPIFA1 gene sequence predicts 4 transcripts ; 3 mRNA variants have been well characterized. The resulting BPIFA1 is a secreted protein, expressed at very high levels in mucosa of the airways and salivary glands; at high levels in oropharyneal epithelium, including tongue and tonsils; and at moderate levels many other tissue types and glands including pituitary, testis, lung, bladder, blood, prostate, pancreas, levels in the digestive tract and pancreas. The protein can be detected on the apical side of epithelial cells and in airway surface liquid, nasal mucus, and sputum.
Within computational biology, an MA plot is an application of a Bland–Altman plot for visual representation of genomic data. The plot visualizes the differences between measurements taken in two samples, by transforming the data onto M and A scales, then plotting these values. Though originally applied in the context of two channel DNA microarray gene expression data, MA plots are also used to visualise high-throughput sequencing analysis.
Cathepsin F is a protein that in humans is encoded by the CTSF gene.
A gene signature or gene expression signature is a single or combined group of genes in a cell with a uniquely characteristic pattern of gene expression that occurs as a result of an altered or unaltered biological process or pathogenic medical condition. This is not to be confused with the concept of gene expression profiling. Activating pathways in a regular physiological process or a physiological response to a stimulus results in a cascade of signal transduction and interactions that elicit altered levels of gene expression, which is classified as the gene signature of that physiological process or response. The clinical applications of gene signatures breakdown into prognostic, diagnostic and predictive signatures. The phenotypes that may theoretically be defined by a gene expression signature range from those that predict the survival or prognosis of an individual with a disease, those that are used to differentiate between different subtypes of a disease, to those that predict activation of a particular pathway. Ideally, gene signatures can be used to select a group of patients for whom a particular treatment will be effective.
In statistics, a volcano plot is a type of scatter-plot that is used to quickly identify changes in large data sets composed of replicate data. It plots significance versus fold-change on the y and x axes, respectively. These plots are increasingly common in omic experiments such as genomics, proteomics, and metabolomics where one often has a list of many thousands of replicate data points between two conditions and one wishes to quickly identify the most meaningful changes. A volcano plot combines a measure of statistical significance from a statistical test with the magnitude of the change, enabling quick visual identification of those data-points that display large magnitude changes that are also statistically significant.
Weighted correlation network analysis, also known as weighted gene co-expression network analysis (WGCNA), is a widely used data mining method especially for studying biological networks based on pairwise correlations between variables. While it can be applied to most high-dimensional data sets, it has been most widely used in genomic applications. It allows one to define modules (clusters), intramodular hubs, and network nodes with regard to module membership, to study the relationships between co-expression modules, and to compare the network topology of different networks. WGCNA can be used as a data reduction technique, as a clustering method, as a feature selection method, as a framework for integrating complementary (genomic) data, and as a data exploratory technique. Although WGCNA incorporates traditional data exploratory techniques, its intuitive network language and analysis framework transcend any standard analysis technique. Since it uses network methodology and is well suited for integrating complementary genomic data sets, it can be interpreted as systems biologic or systems genetic data analysis method. By selecting intramodular hubs in consensus modules, WGCNA also gives rise to network based meta analysis techniques.
Transcriptomics technologies are the techniques used to study an organism's transcriptome, the sum of all of its RNA transcripts. The information content of an organism is recorded in the DNA of its genome and expressed through transcription. Here, mRNA serves as a transient intermediary molecule in the information network, whilst non-coding RNAs perform additional diverse functions. A transcriptome captures a snapshot in time of the total transcripts present in a cell. Transcriptomics technologies provide a broad account of which cellular processes are active and which are dormant. A major challenge in molecular biology is to understand how a single genome gives rise to a variety of cells. Another is how gene expression is regulated.
In molecular biology, a batch effect occurs when non-biological factors in an experiment cause changes in the data produced by the experiment. Such effects can lead to inaccurate conclusions when their causes are correlated with one or more outcomes of interest in an experiment. They are common in many types of high-throughput sequencing experiments, including those using microarrays, mass spectrometers, and single-cell RNA-sequencing data. They are most commonly discussed in the context of genomics and high-throughput sequencing research, but they exist in other fields of science as well.
This page is based on this Wikipedia article Text is available under the CC BY-SA 4.0 license; additional terms may apply. Images, videos and audio are available under their respective licenses.