Gamma spectroscopy

Last updated
The gamma-ray spectrum of natural uranium, showing about a dozen discrete lines superimposed on a smooth continuum, allows one to identify the nuclides
Ra
,
Pb
, and
Bi
of the uranium decay chain. Gammaspektrum Uranerz.jpg
The gamma-ray spectrum of natural uranium, showing about a dozen discrete lines superimposed on a smooth continuum, allows one to identify the nuclides
Ra
,
Pb
, and
Bi
of the uranium decay chain.

Gamma-ray spectroscopy is the qualitative study of the energy spectra of gamma-ray sources, such as in the nuclear industry, geochemical investigation, and astrophysics. [1] Gamma-ray spectrometry, on the other hand, is the method used to acquire a quantitative spectrum measurement. [2]

Contents

Most radioactive sources produce gamma rays, which are of various energies and intensities. When these emissions are detected and analyzed with a spectroscopy system, a gamma-ray energy spectrum can be produced.

A detailed analysis of this spectrum is typically used to determine the identity and quantity of gamma emitters present in a gamma source, and is a vital tool in radiometric assay. The gamma spectrum is characteristic of the gamma-emitting nuclides contained in the source, just like in an optical spectrometer, the optical spectrum is characteristic of the material contained in a sample.

Gamma ray characteristics

Gamma rays are the highest-energy form of electromagnetic radiation, being physically the same as all other forms (e.g., X-rays, visible light, infrared, radio) but having (in general) higher photon energy due to their shorter wavelength. Because of this, the energy of gamma-ray photons can be resolved individually, and a gamma-ray spectrometer can measure and display the energies of the gamma-ray photons detected.

Radioactive nuclei (radionuclides) commonly emit gamma rays in the energy range from a few keV to ~10  MeV, corresponding to the typical energy levels in nuclei with reasonably long lifetimes. Such sources typically produce gamma-ray "line spectra" (i.e., many photons emitted at discrete energies), whereas much higher energies (upwards of 1  TeV) may occur in the continuum spectra observed in astrophysics and elementary particle physics. The difference between gamma rays and X-rays is somewhat blurred. Gamma rays are always from nuclear energy level transitions of atoms and are mono energetic, whereas X-rays are electrically generated (X-ray tube, linear accelerator) and have a broad energy range. [3]

Components of a gamma spectrometer

Laboratory equipment for determination of g-radiation spectrum with a scintillation counter. The output from the scintillation counter goes to a Multichannel Analyzer which processes and formats the data. Scintillation counter as a spectrometer.jpg
Laboratory equipment for determination of γ-radiation spectrum with a scintillation counter. The output from the scintillation counter goes to a Multichannel Analyzer which processes and formats the data.

The main components of a gamma spectrometer are the energy-sensitive radiation detector and the electronic devices that analyse the detector output signals, such as a pulse sorter (i.e., multichannel analyzer). Additional components may include signal amplifiers, rate meters, peak position stabilizers, and data handling devices.

Detector

Gamma spectroscopy detectors are passive materials that are able to interact with incoming gamma rays. The most important interaction mechanisms are the photoelectric effect, the Compton effect, and pair production. Through these processes, the energy of the gamma ray is absorbed and converted into a voltage signal by detecting the energy difference before and after the interaction [ citation needed ] (or, in a scintillation counter, the emitted photons using a photomultiplier). The voltage of the signal produced is proportional to the energy of the detected gamma ray. Common detector materials include sodium iodide (NaI) scintillation counters and high-purity germanium detectors.

To accurately determine the energy of the gamma ray, it is advantageous if the photoelectric effect occurs, as it absorbs all of the energy of the incident ray. Absorbing all the energy is also possible when a series of these interaction mechanisms take place within the detector volume. With Compton interaction or pair production, a portion of the energy may escape from the detector volume, without being absorbed. The absorbed energy thus gives rise to a signal that behaves like a signal from a ray of lower energy. This leads to a spectral feature overlapping the regions of lower energy. Using larger detector volumes reduces this effect. More sophisticated methods of reducing this effect include using Compton-suppression shields and employing segmented detectors with add-back (see: clover (detector)). [4]

Data acquisition

The voltage pulses produced for every gamma ray that interacts within the detector volume are then analyzed by a multichannel analyzer (MCA). In the MCA, a pulse-shaping amplifier takes the transient voltage signal and reshapes it into a Gaussian or trapezoidal shape. From this shape, the signal is then converted into a digital form, using a fast analog-to-digital converter (ADC). In new systems with a very high-sampling-rate ADC, the analog-to-digital conversion can be performed without reshaping.

Pulse-Height Analyzer Principle: Three pulses, 1, 2, and 3 are detected at different times t. Two discriminators emit a counting signal if their set voltage-level is reached by a pulse. Pulse 2 triggers the Lower Level EL but not the Upper Level EU. Pulse 2 is thus counted into the spectral region denoted as P. The anti-coincidence counter prevents a pulse from being sorted into more than one region Gamma Pulse-Height Analyzer Principal.png
Pulse-Height Analyzer Principle: Three pulses, 1, 2, and 3 are detected at different times t. Two discriminators emit a counting signal if their set voltage-level is reached by a pulse. Pulse 2 triggers the Lower Level EL but not the Upper Level EU. Pulse 2 is thus counted into the spectral region denoted as P. The anti-coincidence counter prevents a pulse from being sorted into more than one region

Additional logic in the MCA then performs pulse-height analysis, sorting the pulses by their height into specific bins, or channels. Each channel represents a specific range of energy in the spectrum, the number of detected signals for each channel represents the spectral intensity of the radiation in this energy range. By changing the number of channels, it is possible to fine-tune the spectral resolution and sensitivity. [5]

The MCA can send its data to a computer, which stores, displays, and further analyzes the data. A variety of software packages are available from several manufacturers, and generally include spectrum analysis tools such as energy calibration (converting bins to energies), peak area and net area calculation, and resolution calculation. [6]

A USB sound card can serve as a cheap, consumer off-the-shelf ADC, a technique pioneered by Marek Dolleiser. Specialized computer software performs pulse-height analysis on the digitized waveform, forming a complete MCA. [7] Sound cards have high-speed but low-resolution (up to 192 kHz) ADC chips, allowing for reasonable quality for a low-to-medium count rate. [8] The "sound card spectrometer" has been further refined in amateur and professional circles. [9] [10]

Detector performance

Gamma spectroscopy systems are selected to take advantage of several performance characteristics. Two of the most important include detector resolution and detector efficiency.

Detector resolution

Gamma rays detected in a spectroscopic system produce peaks in the spectrum. These peaks can also be called lines by analogy to optical spectroscopy. The width of the peaks is determined by the resolution of the detector, a very important characteristic of gamma spectroscopic detectors, and high resolution enables the spectroscopist to separate two gamma lines that are close to each other. Gamma spectroscopy systems are designed and adjusted to produce symmetrical peaks of the best possible resolution. The peak shape is usually a Gaussian distribution. In most spectra the horizontal position of the peak is determined by the gamma ray's energy, and the area of the peak is determined by the intensity of the gamma ray and the efficiency of the detector.

The most common figure used to express detector resolution is full width at half maximum (FWHM). This is the width of the gamma ray peak at half of the highest point on the peak distribution. Resolution figures are given with reference to specified gamma ray energies. Resolution can be expressed in absolute (i.e., eV or MeV) or relative terms. For example, a sodium iodide (NaI) detector may have a FWHM of 9.15 keV at 122 keV, and 82.75 keV at 662 keV. These resolution values are expressed in absolute terms. To express the resolution in relative terms, the FWHM in eV or MeV is divided by the energy of the gamma ray and usually shown as percentage. Using the preceding example, the resolution of the detector is 7.5% at 122 keV, and 12.5% at 662 keV. A germanium detector may give resolution of 560 eV at 122 keV, yielding a relative resolution of 0.46%.

Detector efficiency

Not all gamma rays emitted by the source that pass through the detector will produce a count in the system. The probability that an emitted gamma ray will interact with the detector and produce a count is the efficiency of the detector. High-efficiency detectors produce spectra in less time than low-efficiency detectors. In general, larger detectors have higher efficiency than smaller detectors, although the shielding properties of the detector material are also important factors. Detector efficiency is measured by comparing a spectrum from a source of known activity to the count rates in each peak to the count rates expected from the known intensities of each gamma ray.

Efficiency, like resolution, can be expressed in absolute or relative terms. The same units are used (i.e., percentages); therefore, the spectroscopist must take care to determine which kind of efficiency is being given for the detector. Absolute efficiency values represent the probability that a gamma ray of a specified energy passing through the detector will interact and be detected. Relative efficiency values are often used for germanium detectors, and compare the efficiency of the detector at 1332 keV to that of a 3 in × 3 in NaI detector (i.e., 1.2×10 −3 cps/Bq at 25 cm). Relative efficiency values greater than one hundred percent can therefore be encountered when working with very large germanium detectors.

The energy of the gamma rays being detected is an important factor in the efficiency of the detector. An efficiency curve can be obtained by plotting the efficiency at various energies. This curve can then be used to determine the efficiency of the detector at energies different from those used to obtain the curve. High-purity germanium (HPGe) detectors typically have higher sensitivity.

Scintillation detectors

Scintillation detectors use crystals that emit light when gamma rays interact with the atoms in the crystals. The intensity of the light produced is usually proportional to the energy deposited in the crystal by the gamma ray; a well known situation where this relationship fails is the absorption of < 200 keV radiation by intrinsic and doped sodium iodide detectors. The mechanism is similar to that of a thermoluminescent dosimeter. The detectors are joined to photomultipliers; a photocathode converts the light into electrons; and then by using dynodes to generate electron cascades through delta ray production, the signal is amplified. Common scintillators include thallium-doped sodium iodide (NaI(Tl))—often simplified to sodium iodide (NaI) detectors—and bismuth germanate (BGO). Because photomultipliers are also sensitive to ambient light, scintillators are encased in light-tight coverings.

Scintillation detectors can also be used to detect alpha- and beta-radiation.

Sodium iodide-based detectors

Thallium-doped sodium iodide (NaI(Tl)) has two principal advantages:

  1. It can be produced in large crystals, yielding good efficiency, and
  2. it produces intense bursts of light compared to other spectroscopic scintillators.

NaI(Tl) is also convenient to use, making it popular for field applications such as the identification of unknown materials for law enforcement purposes.

Electron hole recombination will emit light that can re-excite pure scintillation crystals; however, the thallium dopant in NaI(Tl) provides energy states within the band gap between the conduction and valence bands. Following excitation in doped scintillation crystals, some electrons in the conduction band will migrate to the activator states; the downward transitions from the activator states will not re-excite the doped crystal, so the crystal is transparent to this radiation.

Figure 1: Sodium iodide gamma spectrum of caesium-137 (
Cs
) Cs137 Spectrum.PNG
Figure 1: Sodium iodide gamma spectrum of caesium-137 (
Cs
)

An example of a NaI spectrum is the gamma spectrum of the caesium isotope 137
Cs
see Figure 1. 137
Cs
emits a single gamma line of 662 keV. The 662 keV line shown is actually produced by 137m
Ba
, the decay product of 137
Cs
, which is in secular equilibrium with 137
Cs
.

The spectrum in Figure 1 was measured using a NaI-crystal on a photomultiplier, an amplifier, and a multichannel analyzer. The figure shows the number of counts within the measuring period versus channel number. The spectrum indicates the following peaks (from left to right):

  1. low energy x radiation (due to internal conversion of the gamma ray),
  2. backscatter at the low energy end of the Compton distribution, and
  3. a photopeak (full energy peak) at an energy of 662 keV

The Compton distribution is a continuous distribution that is present up to channel 150 in Figure 1. The distribution arises because of primary gamma rays undergoing Compton scattering within the crystal: Depending on the scattering angle, the Compton electrons have different energies and hence produce pulses in different energy channels.

If many gamma rays are present in a spectrum, Compton distributions can present analysis challenges. To reduce gamma rays, an anticoincidence shield can be used—see Compton suppression . Gamma ray reduction techniques are especially useful for small lithium-doped germanium (Ge(Li)) detectors.

Figure 2: Sodium iodide gamma spectrum of cobalt-60 (
Co
); see also a different measurement Co60 Spectrum.JPG
Figure 2: Sodium iodide gamma spectrum of cobalt-60 (
Co
); see also a different measurement

The gamma spectrum shown in Figure 2 is of the cobalt isotope 60
Co
, with two gamma rays with 1.17 MeV and 1.33 MeV respectively. (See the decay scheme article for the decay scheme of cobalt-60.) The two gamma lines can be seen well-separated; the peak to the left of channel 200 most likely indicates a strong background radiation source that has not been subtracted. A backscatter peak can be seen near channel 150, similar to the second peak in Figure 1.

Sodium iodide systems, as with all scintillator systems, are sensitive to changes in temperature. Changes in the operating temperature caused by changes in environmental temperature will shift the spectrum on the horizontal axis. Peak shifts of tens of channels or more are commonly observed. Such shifts can be prevented by using spectrum stabilizers.

Because of the poor resolution of NaI-based detectors, they are not suitable for the identification of complicated mixtures of gamma ray-producing materials. Scenarios requiring such analyses require detectors with higher resolution.

Semiconductor-based detectors

Germanium gamma spectrum of Co (Cobalt-60); compare with the NaI spectrum above. 60Co gamma spectrum energy-de.svg
Germanium gamma spectrum of Co (Cobalt-60); compare with the NaI spectrum above.

Semiconductor detectors, also called solid-state detectors, are fundamentally different from scintillation detectors: They rely on detection of the charge carriers (electrons and holes) generated in semiconductors by energy deposited by gamma ray photons.

In semiconductor detectors, an electric field is applied to the detector volume. An electron in the semiconductor is fixed in its valence band in the crystal until a gamma ray interaction provides the electron enough energy to move to the conduction band. Electrons in the conduction band can respond to the electric field in the detector, and therefore move to the positive contact that is creating the electrical field. The gap created by the moving electron is called a "hole", and is filled by an adjacent electron. This shuffling of holes effectively moves a positive charge to the negative contact. The arrival of the electron at the positive contact and the hole at the negative contact produces the electrical signal that is sent to the preamplifier, the MCA, and on through the system for analysis. The movement of electrons and holes in a solid-state detector is very similar to the movement of ions within the sensitive volume of gas-filled detectors such as ionization chambers.

Common semiconductor-based detectors include germanium, cadmium telluride, and cadmium zinc telluride.

Germanium detectors provide significantly improved energy resolution in comparison to sodium iodide detectors, as explained in the preceding discussion of resolution. Germanium detectors produce the highest resolution commonly available today. However, a disadvantage is the requirement of cryogenic temperatures for the operation of germanium detectors, typically by cooling with liquid nitrogen.

Interpretation of measurements

Backscatter peak

In a real detector setup, some photons can and will undergo one or potentially more Compton scattering processes (e.g. in the housing material of the radioactive source, in shielding material or material otherwise surrounding the experiment) before entering the detector material. This leads to a peak structure that can be seen in the above shown energy spectrum of 137
Cs
(Figure 1, the first peak left of the Compton edge), the so-called backscatter peak. The detailed shape of backscatter peak structure is influenced by many factors, such as the geometry of the experiment (source geometry, relative position of source, shielding and detector) or the type of the surrounding material (giving rise to different ratios of the cross sections of Photo- and Compton-effect).

The basic principle, however, is as follows:

The backscatter peak usually appears wide and occurs at lower than 250 keV. [12] [13]

Single escape and double escape peaks

Scintillation gamma spectrum of a radioactive Am-Be-source. Visible are the main photopeak of C neutron excitation and the two escape peaks associated with it. Am-Be-SourceSpectrum.jpg
Scintillation gamma spectrum of a radioactive Am-Be-source. Visible are the main photopeak of C neutron excitation and the two escape peaks associated with it.

For incident photon energies E larger than two times the rest mass of the electron (1.022 MeV), pair production can occur. The resulting positron annihilates with one of the surrounding electrons, typically producing two photons with 511 keV. In a real detector (i.e. a detector of finite size) it is possible that after the annihilation:

The above Am-Be-source spectrum shows an example of single and double escape peak in a real measurement.

Calibration and background radiation

If a gamma spectrometer is used for identifying samples of unknown composition, its energy scale must be calibrated first. Calibration is performed by using the peaks of a known source, such as caesium-137 or cobalt-60. Because the channel number is proportional to energy, the channel scale can then be converted to an energy scale. If the size of the detector crystal is known, one can also perform an intensity calibration, so that not only the energies but also the intensities of an unknown source—or the amount of a certain isotope in the source—can be determined.

Because some radioactivity is present everywhere (i.e., background radiation), the spectrum should be analyzed when no source is present. The background radiation must then be subtracted from the actual measurement. Lead absorbers can be placed around the measurement apparatus to reduce background radiation.

See also

Works cited

Related Research Articles

<span class="mw-page-title-main">Neutron activation analysis</span> Method used for determining the concentrations of elements in many materials

Neutron activation analysis (NAA) is a nuclear process used for determining the concentrations of elements in many materials. NAA allows discrete sampling of elements as it disregards the chemical form of a sample, and focuses solely on atomic nuclei. The method is based on neutron activation and thus requires a neutron source. The sample is bombarded with neutrons, causing its constituent elements to form radioactive isotopes. The radioactive emissions and radioactive decay paths for each element have long been studied and determined. Using this information, it is possible to study spectra of the emissions of the radioactive sample, and determine the concentrations of the various elements within it. A particular advantage of this technique is that it does not destroy the sample, and thus has been used for the analysis of works of art and historical artifacts. NAA can also be used to determine the activity of a radioactive sample.

<span class="mw-page-title-main">X-ray fluorescence</span> Emission of secondary X-rays from a material excited by high-energy X-rays

X-ray fluorescence (XRF) is the emission of characteristic "secondary" X-rays from a material that has been excited by being bombarded with high-energy X-rays or gamma rays. The phenomenon is widely used for elemental analysis and chemical analysis, particularly in the investigation of metals, glass, ceramics and building materials, and for research in geochemistry, forensic science, archaeology and art objects such as paintings.

<span class="mw-page-title-main">Scintillation counter</span> Instrument for measuring ionizing radiation

A scintillation counter is an instrument for detecting and measuring ionizing radiation by using the excitation effect of incident radiation on a scintillating material, and detecting the resultant light pulses.

<span class="mw-page-title-main">Scintillator</span> Material which glows when excited by ionizing radiation

A scintillator is a material that exhibits scintillation, the property of luminescence, when excited by ionizing radiation. Luminescent materials, when struck by an incoming particle, absorb its energy and scintillate. Sometimes, the excited state is metastable, so the relaxation back down from the excited state to lower states is delayed. The process then corresponds to one of two phenomena: delayed fluorescence or phosphorescence. The correspondence depends on the type of transition and hence the wavelength of the emitted optical photon.

<span class="mw-page-title-main">Compton Gamma Ray Observatory</span> NASA space observatory designed to detect X-rays and gamma rays (1991–2000)

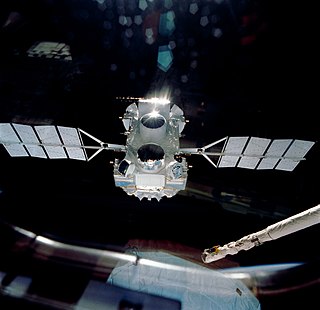
The Compton Gamma Ray Observatory (CGRO) was a space observatory detecting photons with energies from 20 keV to 30 GeV, in Earth orbit from 1991 to 2000. The observatory featured four main telescopes in one spacecraft, covering X-rays and gamma rays, including various specialized sub-instruments and detectors. Following 14 years of effort, the observatory was launched from Space Shuttle Atlantis during STS-37 on April 5, 1991, and operated until its deorbit on June 4, 2000. It was deployed in low Earth orbit at 450 km (280 mi) to avoid the Van Allen radiation belt. It was the heaviest astrophysical payload ever flown at that time at 16,300 kilograms (35,900 lb).

A semiconductor detector in ionizing radiation detection physics is a device that uses a semiconductor to measure the effect of incident charged particles or photons.

In condensed matter physics, scintillation is the physical process where a material, called a scintillator, emits ultraviolet or visible light under excitation from high energy photons or energetic particles. See scintillator and scintillation counter for practical applications.

<span class="mw-page-title-main">Gamma camera</span> Camera to record gamma radiation

A gamma camera (γ-camera), also called a scintillation camera or Anger camera, is a device used to image gamma radiation emitting radioisotopes, a technique known as scintigraphy. The applications of scintigraphy include early drug development and nuclear medical imaging to view and analyse images of the human body or the distribution of medically injected, inhaled, or ingested radionuclides emitting gamma rays.

<span class="mw-page-title-main">Gamma-ray spectrometer</span> Instrument for measuring gamma radiation

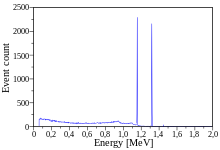
A gamma-ray spectrometer (GRS) is an instrument for measuring the distribution of the intensity of gamma radiation versus the energy of each photon. The study and analysis of gamma-ray spectra for scientific and technical use is called gamma spectroscopy, and gamma-ray spectrometers are the instruments which observe and collect such data. Because the energy of each photon of EM radiation is proportional to its frequency, gamma rays have sufficient energy that they are typically observed by counting individual photons.

<span class="mw-page-title-main">X-ray spectroscopy</span> Technique to characterize materials using X-ray radiation

X-ray spectroscopy is a general term for several spectroscopic techniques for characterization of materials by using x-ray radiation.

<span class="mw-page-title-main">Reuven Ramaty High Energy Solar Spectroscopic Imager</span> NASA satellite of the Explorer program

Reuven Ramaty High Energy Solar Spectroscopic Imager was a NASA solar flare observatory. It was the sixth mission in the Small Explorer program (SMEX), selected in October 1997 and launched on 5 February 2002, at 20:58:12 UTC. Its primary mission was to explore the physics of particle acceleration and energy release in solar flares.

<span class="mw-page-title-main">INTEGRAL</span> European space telescope for observing gamma rays

The INTErnational Gamma-Ray Astrophysics Laboratory (INTEGRAL) is a space telescope for observing gamma rays of energies up to 8 MeV. It was launched by the European Space Agency (ESA) into Earth orbit in 2002, and is designed to provide imaging and spectroscopy of cosmic sources. In the MeV energy range, it is the most sensitive gamma ray observatory in space. It is sensitive to higher energy photons than X-ray instruments such as NuSTAR, the Neil Gehrels Swift Observatory, XMM-Newton, and lower than other gamma-ray instruments such Fermi and HESS.

<span class="mw-page-title-main">Neutron detection</span>

Neutron detection is the effective detection of neutrons entering a well-positioned detector. There are two key aspects to effective neutron detection: hardware and software. Detection hardware refers to the kind of neutron detector used and to the electronics used in the detection setup. Further, the hardware setup also defines key experimental parameters, such as source-detector distance, solid angle and detector shielding. Detection software consists of analysis tools that perform tasks such as graphical analysis to measure the number and energies of neutrons striking the detector.

<span class="mw-page-title-main">X-ray telescope</span> Telescope designed to observe remote objects by detecting X-rays

An X-ray telescope (XRT) is a telescope that is designed to observe remote objects in the X-ray spectrum. X-rays are absorbed by the Earth's atmosphere, so instruments to detect X-rays must be taken to high altitude by balloons, sounding rockets, and satellites.

<span class="mw-page-title-main">Mainz Microtron</span> Particle physics facility

The Mainz Microtron, abbreviated MAMI, is a microtron which provides a continuous wave, high intensity, polarized electron beam with an energy up to 1.6 GeV. MAMI is the core of an experimental facility for particle, nuclear and X-ray radiation physics at the Johannes Gutenberg University in Mainz (Germany). It is one of the largest campus-based accelerator facilities for basic research in Europe. The experiments at MAMI are performed by about 200 physicists of many countries organized in international collaborations.

Electronic anticoincidence is a method widely used to suppress unwanted, "background" events in high energy physics, experimental particle physics, gamma-ray spectroscopy, gamma-ray astronomy, experimental nuclear physics, and related fields.

<span class="mw-page-title-main">Annihilation radiation</span> Radiation resulting from particle-antiparticle collisions

Annihilation radiation is a term used in Gamma spectroscopy for the photon radiation produced when a particle and its antiparticle collide and annihilate. Most commonly, this refers to 511-keV photons produced by an electron interacting with a positron. These photons are frequently referred to as gamma rays, despite having their origin outside the nucleus, due to unclear distinctions between types of photon radiation. Positively charged electrons (Positrons) are emitted from the nucleus as it undergoes β+ decay. The positron travels a short distance, depositing any excess energy before it combines with a free electron. The mass of the e- and e+ is completely converted into two photons with an energy of 511 keV each. These annihilation photons are emitted in opposite directions, 180˚ apart. This is the basis for PET scanners in a process called coincidence counting.

<span class="mw-page-title-main">Total absorption spectroscopy</span>

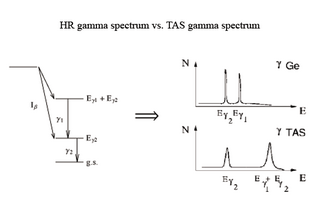
Total absorption spectroscopy is a measurement technique that allows the measurement of the gamma radiation emitted in the different nuclear gamma transitions that may take place in the daughter nucleus after its unstable parent has decayed by means of the beta decay process. This technique can be used for beta decay studies related to beta feeding measurements within the full decay energy window for nuclei far from stability.

<span class="mw-page-title-main">Radionuclide identification device</span>

A radionuclide identification device is a small, lightweight, portable gamma-ray spectrometer used for the detection and identification of radioactive substances. As RIIDs are portable, they are suitable for medical and industrial applications, fieldwork, geological surveys, first-line responders in Homeland Security, and Environmental Monitoring and Radiological Mapping along with other industries that necessitate the identification of radioactive substances..

<span class="mw-page-title-main">X-ray emission spectroscopy</span>

X-ray emission spectroscopy (XES) is a form of X-ray spectroscopy in which a core electron is excited by an incident x-ray photon and then this excited state decays by emitting an x-ray photon to fill the core hole. The energy of the emitted photon is the energy difference between the involved electronic levels. The analysis of the energy dependence of the emitted photons is the aim of the X-ray emission spectroscopy.

References

  1. "Scintillation Detector - an overview | ScienceDirect Topics". www.sciencedirect.com. Retrieved 2022-11-01.
  2. "Gamma Spectroscopy | nuclear-power.com". www.nuclear-power.com. Retrieved 2023-07-29.
  3. "X-rays".
  4. Lee, I Y; Deleplanque, M A; Vetter, K (2003-07-01). "Developments in large gamma-ray detector arrays". Reports on Progress in Physics. 66 (7): 1095–1144. Bibcode:2003RPPh...66.1095L. doi:10.1088/0034-4885/66/7/201. ISSN   0034-4885. S2CID   121957980.
  5. "THE MULTICHANNEL ANALYZER, PHYSICS 359E" (PDF). Western University. Retrieved 27 March 2016.
  6. "MCA box settings". CASSY Lab 2.
  7. "Software Downloads". www.gammaspectacular.com. Marek works at The University of Sydney, with third year physics students, and developed PRA as an educational tool for his students.
    Motisan, Radu (November 29, 2010). "NaI Scintillation Probe and Gamma Spectroscopy – PocketMagic". www.pocketmagic.net. Cited for early mention of Marek Dolleiser's PRA software.
  8. Ibrahim, Maslina Mohd; Yussup, Nolida; Lombigit, Lojius; Rahman, Nur Aira Abdul; Jaafar, Zainudin (2014). Development of multichannel analyzer using sound card ADC for nuclear spectroscopy system. International Nuclear Science, Technology & Engineering Conference 2013 (iNuSTEC2013). pp. 50–53. doi:10.1063/1.4866103.
  9. Kasani, H.; Ashrafi, S.; Ghal-Eh, N. (July 2021). "High count-rate digital gamma-ray spectroscopy using a low-cost COTS digitizer system". Radiation Physics and Chemistry. 184: 109438. Bibcode:2021RaPC..18409438K. doi:10.1016/j.radphyschem.2021.109438. S2CID   233696398.
  10. Kim, Sangrok; Kim, Taeyoon; Yang, Hyungjin (1 June 2022). "Design of a Low-Resolution Gamma-ray Spectrometer for Monitoring Radioactive Levels of Wastewater". Applied Sciences. 12 (11): 5613. doi: 10.3390/app12115613 .
  11. Shultis, John K.; Faw, Richard E. (2007). Fundamentals of Nuclear Science and Engineering (2nd ed.). CRC Press. p. 175. ISBN   978-1-4398-9408-8.
  12. "Backscattered peaks". ns.ph.liv.ac.uk.
  13. "Compton effect (spectrum)". CASSY Lab 2. Retrieved 9 January 2024.