Atomic absorption spectroscopy

Last updated
Flame atomic absorption spectroscopy instrument FlammenAAS.jpg
Flame atomic absorption spectroscopy instrument
A scientist preparing solutions for atomic absorption spectroscopy, reflected in the glass window of the AAS's flame atomizer cover door A scientist preparing solutions for AAS.jpg
A scientist preparing solutions for atomic absorption spectroscopy, reflected in the glass window of the AAS's flame atomizer cover door

Atomic absorption spectroscopy (AAS) and atomic emission spectroscopy (AES) is a spectroanalytical procedure for the quantitative determination of chemical elements by free atoms in the gaseous state. Atomic absorption spectroscopy is based on absorption of light by free metallic ions.

Contents

In analytical chemistry the technique is used for determining the concentration of a particular element (the analyte) in a sample to be analyzed. AAS can be used to determine over 70 different elements in solution, or directly in solid samples via electrothermal vaporization, [1] and is used in pharmacology, biophysics, archaeology and toxicology research.

Atomic emission spectroscopy (AAS) was first used as an analytical technique, and the underlying principles were established in the second half of the 19th century by Robert Wilhelm Bunsen and Gustav Robert Kirchhoff, both professors at the University of Heidelberg, Germany. [2]

The modern form of AAS was largely developed during the 1950s by a team of Australian chemists. They were led by Sir Alan Walsh at the Commonwealth Scientific and Industrial Research Organisation (CSIRO), Division of Chemical Physics, in Melbourne, Australia. [3] [4]

Atomic absorption spectrometry has many uses in different areas of chemistry such as clinical analysis of metals in biological fluids and tissues such as whole blood, plasma, urine, saliva, brain tissue, liver, hair, muscle tissue. Atomic absorption spectrometry can be used in qualitative and quantitative analysis.

Principles

The technique makes use of the atomic absorption spectrum of a sample in order to assess the concentration of specific analytes within it. It requires standards with known analyte content to establish the relation between the measured absorbance and the analyte concentration and relies therefore on the [Beer–Lambert law]. ## Analyzing Samples with Atomic Absorption Spectroscopy (AAS)

Atomic Absorption Spectroscopy (AAS) measures the concentration of specific elements in a sample by analyzing their unique "fingerprint" in the form of an atomic absorption spectrum. Here's how it works:

   * **A = εcl**, where:        * A is the absorbance measured.        * ε is the molar absorptivity (constant specific to the element and wavelength).        * c is the concentration of the analyte.        * l is the path length of the light through the sample.

The measured absorbance directly provides feedback on the concentration of the analyte in the sample. This feedback loop allows the AAS to analyze various samples efficiently and determine their elemental composition with high accuracy.

In summary, AAS utilizes the unique absorption properties of elements to accurately quantify their concentration in samples. By preparing the sample, atomizing the analytes, measuring their absorption of specific light, and applying the Beer-Lambert law, this powerful technique helps us understand the elemental makeup of diverse materials across various scientific and industrial fields.


Instrumentation

Atomic absorption spectrometer block diagram AASBLOCK.JPG
Atomic absorption spectrometer block diagram

In order to analyze a sample for its atomic constituents, it has to be atomized. The atomizers most commonly used nowadays are flames and electrothermal (graphite tube) atomizers. The atoms should then be irradiated by optical radiation, and the radiation source could be an element-specific line radiation source or a continuum radiation source. The radiation then passes through a monochromator in order to separate the element-specific radiation from any other radiation emitted by the radiation source, which is finally measured by a detector.

Atomizers

The used nowadays are spectroscopic flames and electrothermal atomizers. Other atomizers, such as glow-discharge atomization, hydride atomization, or cold-vapor atomization, might be used for special purposes.

Flame atomizers

The oldest and most commonly used atomizers in AAS are flames, principally the air-acetylene flame with a temperature of about 2300 °C and the nitrous oxide [4] system (N2O)-acetylene flame with a temperature of about 2700 °C. The latter flame, in addition, offers a more reducing environment, being ideally suited for analytes with high affinity to oxygen.

A laboratory flame photometer that uses a propane operated flame atomizer FP8800GM.jpg
A laboratory flame photometer that uses a propane operated flame atomizer

Liquid or dissolved samples are typically used with flame atomizers. The sample solution is aspirated by a pneumatic analytical nebulizer, transformed into an aerosol, which is introduced into a spray chamber, where it is mixed with the flame gases and conditioned in a way that only the finest aerosol droplets (< 10 μm) enter the flame. This conditioning process reduces interference, but only about 5% of the aerosolized solution reaches the flame because of it.

On top of the spray chamber is a burner head that produces a flame that is laterally long (usually 5–10 cm) and only a few mm deep. The radiation beam passes through this flame at its longest axis, and the flame gas flow-rates may be adjusted to produce the highest concentration of free atoms. The burner height may also be adjusted, so that the radiation beam passes through the zone of highest atom cloud density in the flame, resulting in the highest sensitivity.

The processes in a flame include the stages of desolvation (drying) in which the solvent is evaporated and the dry sample nano-particles remain, vaporization (transfer to the gaseous phase) in which the solid particles are converted into gaseous molecule, atomization in which the molecules are dissociated into free atoms, and ionization where (depending on the ionization potential of the analyte atoms and the energy available in a particular flame) atoms may be in part converted to gaseous ions.

Each of these stages includes the risk of interference in case the degree of phase transfer is different for the analyte in the calibration standard and in the sample. Ionization is generally undesirable, as it reduces the number of atoms that are available for measurement, i.e., the sensitivity.

In flame AAS a steady-state signal is generated during the time period when the sample is aspirated. This technique is typically used for determinations in the mg L−1 range, and may be extended down to a few μg L−1 for some elements.

Electrothermal atomizers

GFAA method development GFAA method development-courtesy jball-Analytik Jena USA.JPG
GFAA method development
Graphite tube Lvov furnace 2.JPG
Graphite tube

Electrothermal AAS (ET AAS) using graphite tube atomizers was pioneered by Boris V. L’vov at the Saint Petersburg Polytechnical Institute, Russia, [5] since the late 1950s, and investigated in parallel by Hans Massmann at the Institute of Spectrochemistry and Applied Spectroscopy (ISAS) in Dortmund, Germany. [6]

Although a wide variety of graphite tube designs have been used over the years, the dimensions nowadays are typically 20–25 mm in length and 5–6 mm inner diameter. With this technique liquid/dissolved, solid and gaseous samples may be analyzed directly. A measured volume (typically 10–50 μL) or a weighed mass (typically around 1 mg) of a solid sample are introduced into the graphite tube and subject to a temperature program. This typically consists of stages, such as drying – the solvent is evaporated; pyrolysis – the majority of the matrix constituents are removed; atomization – the analyte element is released to the gaseous phase; and cleaning – eventual residues in the graphite tube are removed at high temperature. [7]

The graphite tubes are heated via their ohmic resistance using a low-voltage high-current power supply; the temperature in the individual stages can be controlled very closely, and temperature ramps between the individual stages facilitate separation of sample components. Tubes may be heated transversely or longitudinally, where the former ones have the advantage of a more homogeneous temperature distribution over their length. The so-called stabilized temperature platform furnace (STPF) concept, proposed by Walter Slavin, based on research of Boris L’vov, makes ET AAS essentially free from interference.[ citation needed ] The major components of this concept are atomization of the sample from a graphite platform inserted into the graphite tube (L’vov platform) instead of from the tube wall in order to delay atomization until the gas phase in the atomizer has reached a stable temperature; use of a chemical modifier in order to stabilize the analyte to a pyrolysis temperature that is sufficient to remove the majority of the matrix components; and integration of the absorbance over the time of the transient absorption signal instead of using peak height absorbance for quantification.

In ET AAS a transient signal is generated, the area of which is directly proportional to the mass of analyte (not its concentration) introduced into the graphite tube. This technique has the advantage that any kind of sample, solid, liquid or gaseous, can be analyzed directly. Its sensitivity is 2–3 orders of magnitude higher than that of flame AAS, so that determinations in the low μg L−1 range (for a typical sample volume of 20 μL) and ng g−1 range (for a typical sample mass of 1 mg) can be carried out. It shows a very high degree of freedom from interferences, so that ET AAS might be considered the most robust technique available nowadays for the determination of trace elements in complex matrices.[ citation needed ]

Specialized atomization techniques

While flame and electrothermal vaporizers are the most common atomization techniques, several other atomization methods are utilized for specialized use. [8] [9]

Glow-discharge atomization

A glow-discharge device (GD) serves as a versatile source, as it can simultaneously introduce and atomize the sample. The glow discharge occurs in a low-pressure argon gas atmosphere between 1 and 10 torr. In this atmosphere lies a pair of electrodes applying a DC voltage of 250 to 1000 V to break down the argon gas into positively charged ions and electrons. These ions, under the influence of the electric field, are accelerated into the cathode surface containing the sample, bombarding the sample and causing neutral sample atom ejection through the process known as sputtering. The atomic vapor produced by this discharge is composed of ions, ground state atoms, and fraction of excited atoms. When the excited atoms relax back into their ground state, a low-intensity glow is emitted, giving the technique its name.

The requirement for samples of glow discharge atomizers is that they are electrical conductors. Consequently, atomizers are most commonly used in the analysis of metals and other conducting samples. However, with proper modifications, it can be utilized to analyze liquid samples as well as nonconducting materials by mixing them with a conductor (e.g. graphite).

Hydride atomization

Hydride generation techniques are specialized in solutions of specific elements. The technique provides a means of introducing samples containing arsenic, antimony, selenium, bismuth, and lead into an atomizer in the gas phase. With these elements, hydride atomization enhances detection limits by a factor of 10 to 100 compared to alternative methods. Hydride generation occurs by adding an acidified aqueous solution of the sample to a 1% aqueous solution of sodium borohydride, all of which is contained in a glass vessel. The volatile hydride generated by the reaction that occurs is swept into the atomization chamber by an inert gas, where it undergoes decomposition. This process forms an atomized form of the analyte, which can then be measured by absorption or emission spectrometry.

Cold-vapor atomization

The cold-vapor technique is an atomization method limited only for the determination of mercury, due to it being the only metallic element to have a large vapor pressure at ambient temperature.[ citation needed ] Because of this, it has an important use in determining organic mercury compounds in samples and their distribution in the environment. The method initiates by converting mercury into Hg2+ by oxidation from nitric and sulfuric acids, followed by a reduction of Hg2+ with tin(II) chloride. The mercury, is then swept into a long-pass absorption tube by bubbling a stream of inert gas through the reaction mixture. The concentration is determined by measuring the absorbance of this gas at 253.7 nm. Detection limits for this technique are in the parts-per-billion range making it an excellent mercury detection atomization method.

Radiation sources

We have to distinguish between line source AAS (LS AAS) and continuum source AAS (CS AAS). In classical LS AAS, as it has been proposed by Alan Walsh, [10] the high spectral resolution required for AAS measurements is provided by the radiation source itself that emits the spectrum of the analyte in the form of lines that are narrower than the absorption lines. Continuum sources, such as deuterium lamps, are only used for background correction purposes. The advantage of this technique is that only a medium-resolution monochromator is necessary for measuring AAS; however, it has the disadvantage that usually a separate lamp is required for each element that has to be determined. In CS AAS, in contrast, a single lamp, emitting a continuum spectrum over the entire spectral range of interest is used for all elements. Obviously, a high-resolution monochromator is required for this technique, as will be discussed later.

Hollow cathode lamp (HCL) Mehrelement-Hohlkathodenlampe fur bessere UV-Lichtdurchlassigkeit mit eingelassenem Quarzfenster.jpg
Hollow cathode lamp (HCL)

Hollow cathode lamps

Hollow cathode lamps (HCL) are the most common radiation source in LS AAS.[ citation needed ] Inside the sealed lamp, filled with argon or neon gas at low pressure, is a cylindrical metal cathode containing the element of interest and an anode. A high voltage is applied across the anode and cathode, resulting in an ionization of the fill gas. The gas ions are accelerated towards the cathode and, upon impact on the cathode, sputter cathode material that is excited in the glow discharge to emit the radiation of the sputtered material, i.e., the element of interest. In the majority of cases single element lamps are used, where the cathode is pressed out of predominantly compounds of the target element. Multi-element lamps are available with combinations of compounds of the target elements pressed in the cathode. Multi element lamps produce slightly less sensitivity than single element lamps and the combinations of elements have to be selected carefully to avoid spectral interferences. Most multi-element lamps combine a handful of elements, e.g.: 2 - 8. Atomic Absorption Spectrometers can feature as few as 1-2 hollow cathode lamp positions or in automated multi-element spectrometers, a 8-12 lamp positions may be typically available.

Electrodeless discharge lamps

Electrodeless discharge lamps (EDL) contain a small quantity of the analyte as a metal or a salt in a quartz bulb together with an inert gas, typically argon gas, at low pressure. The bulb is inserted into a coil that is generating an electromagnetic radio frequency field, resulting in a low-pressure inductively coupled discharge in the lamp. The emission from an EDL is higher than that from an HCL, and the line width is generally narrower, but EDLs need a separate power supply and might need a longer time to stabilize.

Deuterium lamps

Deuterium HCL or even hydrogen HCL and deuterium discharge lamps are used in LS AAS for background correction purposes. [11] The radiation intensity emitted by these lamps decreases significantly with increasing wavelength, so that they can be only used in the wavelength range between 190 and about 320 nm.

Xenon lamp as a continuous radiation source Continuous radiation source.jpg
Xenon lamp as a continuous radiation source

Continuum sources

When a continuum radiation source is used for AAS, it is necessary to use a high-resolution monochromator, as will be discussed later. In addition, it is necessary that the lamp emits radiation of intensity at least an order of magnitude above that of a typical HCL over the entire wavelength range from 190 nm to 900 nm. A special high-pressure xenon short arc lamp, operating in a hot-spot mode has been developed to fulfill these requirements.

Spectrometer

As already pointed out above, there is a difference between medium-resolution spectrometers that are used for LS AAS and high-resolution spectrometers that are designed for CS AAS. The spectrometer includes the spectral sorting device (monochromator) and the detector.

Spectrometers for LS AAS

In LS AAS the high resolution that is required for the measurement of atomic absorption is provided by the narrow line emission of the radiation source, and the monochromator simply has to resolve the analytical line from other radiation emitted by the lamp.[ citation needed ] This can usually be accomplished with a band pass between 0.2 and 2 nm, i.e., a medium-resolution monochromator. Another feature to make LS AAS element-specific is modulation of the primary radiation and the use of a selective amplifier that is tuned to the same modulation frequency, as already postulated by Alan Walsh. This way any (unmodulated) radiation emitted for example by the atomizer can be excluded, which is imperative for LS AAS. Simple monochromators of the Littrow or (better) the Czerny-Turner design are typically used for LS AAS. Photomultiplier tubes are the most frequently used detectors in LS AAS, although solid state detectors might be preferred because of their better signal-to-noise ratio.

Spectrometers for CS AAS

When a continuum radiation source is used for AAS measurement it is indispensable to work with a high-resolution monochromator. The resolution has to be equal to or better than the half-width of an atomic absorption line (about 2 pm) in order to avoid losses of sensitivity and linearity of the calibration graph. The research with high-resolution (HR) CS AAS was pioneered by the groups of O’Haver and Harnly in the US, who also developed the (up until now) only simultaneous multi-element spectrometer for this technique. The breakthrough, however, came when the group of Becker-Ross in Berlin, Germany, built a spectrometer entirely designed for HR-CS AAS. The first commercial equipment for HR-CS AAS was introduced by Analytik Jena (Jena, Germany) at the beginning of the 21st century, based on the design proposed by Becker-Ross and Florek. These spectrometers use a compact double monochromator with a prism pre-monochromator and an echelle grating monochromator for high resolution. A linear charge-coupled device (CCD) array with 200 pixels is used as the detector. The second monochromator does not have an exit slit; hence the spectral environment at both sides of the analytical line becomes visible at high resolution. As typically only 3–5 pixels are used to measure the atomic absorption, the other pixels are available for correction purposes. One of these corrections is that for lamp flicker noise, which is independent of wavelength, resulting in measurements with very low noise level; other corrections are those for background absorption, as will be discussed later.

Background absorption and background correction

The relatively small number of atomic absorption lines (compared to atomic emission lines) and their narrow width (a few pm) make spectral overlap rare; there are only few examples known that an absorption line from one element will overlap with another.[ citation needed ] Molecular absorption, in contrast, is much broader, so that it is more likely that some molecular absorption band will overlap with an atomic line. This kind of absorption might be caused by un-dissociated molecules of concomitant elements of the sample or by flame gases. We have to distinguish between the spectra of di-atomic molecules, which exhibit a pronounced fine structure, and those of larger (usually tri-atomic) molecules that don't show such fine structure. Another source of background absorption, particularly in ET AAS, is scattering of the primary radiation at particles that are generated in the atomization stage, when the matrix could not be removed sufficiently in the pyrolysis stage.

All these phenomena, molecular absorption and radiation scattering, can result in artificially high absorption and an improperly high (erroneous) calculation for the concentration or mass of the analyte in the sample. There are several techniques available to correct for background absorption, and they are significantly different for LS AAS and HR-CS AAS.

Background correction techniques in LS AAS

In LS AAS background absorption can only be corrected using instrumental techniques, and all of them are based on two sequential measurements: [12] firstly, total absorption (atomic plus background), secondly, background absorption only. The difference of the two measurements gives the net atomic absorption. Because of this, and because of the use of additional devices in the spectrometer, the signal-to-noise ratio of background-corrected signals is always significantly inferior compared to uncorrected signals. It should also be pointed out that in LS AAS there is no way to correct for (the rare case of) a direct overlap of two atomic lines. In essence there are three techniques used for background correction in LS AAS:

Deuterium background correction

This is the oldest and still most commonly used technique, particularly for flame AAS. In this case, a separate source (a deuterium lamp) with broad emission is used to measure the background absorption over the entire width of the exit slit of the spectrometer. The use of a separate lamp makes this technique the least accurate one, as it cannot correct for any structured background. It also cannot be used at wavelengths above about 320 nm, as the emission intensity of the deuterium lamp becomes very weak. The use of deuterium HCL is preferable compared to an arc lamp due to the better fit of the image of the former lamp with that of the analyte HCL.

Smith-Hieftje background correction

This technique (named after their inventors) is based on the line-broadening and self-reversal of emission lines from HCL when high current is applied. Total absorption is measured with normal lamp current, i.e., with a narrow emission line, and background absorption after application of a high-current pulse with the profile of the self-reversed line, which has little emission at the original wavelength, but strong emission on both sides of the analytical line. The advantage of this technique is that only one radiation source is used; among the disadvantages are that the high-current pulses reduce lamp lifetime, and that the technique can only be used for relatively volatile elements, as only those exhibit sufficient self-reversal to avoid dramatic loss of sensitivity. Another problem is that background is not measured at the same wavelength as total absorption, making the technique unsuitable for correcting structured background.

Zeeman-effect background correction

An alternating magnetic field is applied at the atomizer (graphite furnace) to split the absorption line into three components, the π component, which remains at the same position as the original absorption line, and two σ components, which are moved to higher and lower wavelengths, respectively.[ citation needed ] Total absorption is measured without magnetic field and background absorption with the magnetic field on. The π component has to be removed in this case, e.g. using a polarizer, and the σ components do not overlap with the emission profile of the lamp, so that only the background absorption is measured. The advantages of this technique are that total and background absorption are measured with the same emission profile of the same lamp, so that any kind of background, including background with fine structure can be corrected accurately, unless the molecule responsible for the background is also affected by the magnetic field and using a chopper as a polariser reduces the signal to noise ratio. While the disadvantages are the increased complexity of the spectrometer and power supply needed for running the powerful magnet needed to split the absorption line.

Background correction techniques in HR-CS AAS

In HR-CS AAS background correction is carried out mathematically in the software using information from detector pixels that are not used for measuring atomic absorption; hence, in contrast to LS AAS, no additional components are required for background correction.

Background correction using correction pixels

It has already been mentioned that in HR-CS AAS lamp flicker noise is eliminated using correction pixels. In fact, any increase or decrease in radiation intensity that is observed to the same extent at all pixels chosen for correction is eliminated by the correction algorithm.[ citation needed ] This obviously also includes a reduction of the measured intensity due to radiation scattering or molecular absorption, which is corrected in the same way. As measurement of total and background absorption, and correction for the latter, are strictly simultaneous (in contrast to LS AAS), even the fastest changes of background absorption, as they may be observed in ET AAS, do not cause any problem. In addition, as the same algorithm is used for background correction and elimination of lamp noise, the background corrected signals show a much better signal-to-noise ratio compared to the uncorrected signals, which is also in contrast to LS AAS.

Background correction using a least-squares algorithm

The above technique can obviously not correct for a background with fine structure, as in this case the absorbance will be different at each of the correction pixels. In this case HR-CS AAS is offering the possibility to measure correction spectra of the molecule(s) that is (are) responsible for the background and store them in the computer. These spectra are then multiplied with a factor to match the intensity of the sample spectrum and subtracted pixel by pixel and spectrum by spectrum from the sample spectrum using a least-squares algorithm. This might sound complex, but first of all the number of di-atomic molecules that can exist at the temperatures of the atomizers used in AAS is relatively small, and second, the correction is performed by the computer within a few seconds. The same algorithm can actually also be used to correct for direct line overlap of two atomic absorption lines, making HR-CS AAS the only AAS technique that can correct for this kind of spectral interference.

See also

Related Research Articles

<span class="mw-page-title-main">Spectroscopy</span> Study involving matter and electromagnetic radiation

Spectroscopy is the field of study that measures and interprets electromagnetic spectra. In narrower contexts, spectroscopy is the precise study of color as generalized from visible light to all bands of the electromagnetic spectrum.

Fourier-transform spectroscopy is a measurement technique whereby spectra are collected based on measurements of the coherence of a radiative source, using time-domain or space-domain measurements of the radiation, electromagnetic or not. It can be applied to a variety of types of spectroscopy including optical spectroscopy, infrared spectroscopy, nuclear magnetic resonance (NMR) and magnetic resonance spectroscopic imaging (MRSI), mass spectrometry and electron spin resonance spectroscopy.

<span class="mw-page-title-main">Ultraviolet–visible spectroscopy</span> Range of spectroscopic analysis

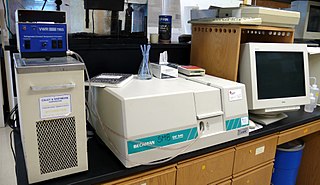
Ultraviolet (UV) spectroscopy or ultraviolet–visible (UV–VIS) spectrophotometry refers to absorption spectroscopy or reflectance spectroscopy in part of the ultraviolet and the full, adjacent visible regions of the electromagnetic spectrum. Being relatively inexpensive and easily implemented, this methodology is widely used in diverse applied and fundamental applications. The only requirement is that the sample absorb in the UV-Vis region, i.e. be a chromophore. Absorption spectroscopy is complementary to fluorescence spectroscopy. Parameters of interest, besides the wavelength of measurement, are absorbance (A) or transmittance (%T) or reflectance (%R), and its change with time.

<span class="mw-page-title-main">X-ray fluorescence</span> Emission of secondary X-rays from a material excited by high-energy X-rays

X-ray fluorescence (XRF) is the emission of characteristic "secondary" X-rays from a material that has been excited by being bombarded with high-energy X-rays or gamma rays. The phenomenon is widely used for elemental analysis and chemical analysis, particularly in the investigation of metals, glass, ceramics and building materials, and for research in geochemistry, forensic science, archaeology and art objects such as paintings.

<span class="mw-page-title-main">Emission spectrum</span> Frequencies of light emitted by atoms or chemical compounds

The emission spectrum of a chemical element or chemical compound is the spectrum of frequencies of electromagnetic radiation emitted due to electrons making a transition from a high energy state to a lower energy state. The photon energy of the emitted photons is equal to the energy difference between the two states. There are many possible electron transitions for each atom, and each transition has a specific energy difference. This collection of different transitions, leading to different radiated wavelengths, make up an emission spectrum. Each element's emission spectrum is unique. Therefore, spectroscopy can be used to identify elements in matter of unknown composition. Similarly, the emission spectra of molecules can be used in chemical analysis of substances.

<span class="mw-page-title-main">Absorption spectroscopy</span> Spectroscopic techniques that measure the absorption of radiation

Absorption spectroscopy is spectroscopy that involves techniques that measure the absorption of electromagnetic radiation, as a function of frequency or wavelength, due to its interaction with a sample. The sample absorbs energy, i.e., photons, from the radiating field. The intensity of the absorption varies as a function of frequency, and this variation is the absorption spectrum. Absorption spectroscopy is performed across the electromagnetic spectrum.

In physics, atomic spectroscopy is the study of the electromagnetic radiation absorbed and emitted by atoms. Since unique elements have unique emission spectra, atomic spectroscopy is applied for determination of elemental compositions. It can be divided by atomization source or by the type of spectroscopy used. In the latter case, the main division is between optical and mass spectrometry. Mass spectrometry generally gives significantly better analytical performance, but is also significantly more complex. This complexity translates into higher purchase costs, higher operational costs, more operator training, and a greater number of components that can potentially fail. Because optical spectroscopy is often less expensive and has performance adequate for many tasks, it is far more common. Atomic absorption spectrometers are one of the most commonly sold and used analytical devices.

<span class="mw-page-title-main">Spectrophotometry</span> Branch of spectroscopy

Spectrophotometry is a branch of electromagnetic spectroscopy concerned with the quantitative measurement of the reflection or transmission properties of a material as a function of wavelength. Spectrophotometry uses photometers, known as spectrophotometers, that can measure the intensity of a light beam at different wavelengths. Although spectrophotometry is most commonly applied to ultraviolet, visible, and infrared radiation, modern spectrophotometers can interrogate wide swaths of the electromagnetic spectrum, including x-ray, ultraviolet, visible, infrared, and/or microwave wavelengths.

<span class="mw-page-title-main">Fluorescence spectroscopy</span> Type of electromagnetic spectroscopy

Fluorescence spectroscopy is a type of electromagnetic spectroscopy that analyzes fluorescence from a sample. It involves using a beam of light, usually ultraviolet light, that excites the electrons in molecules of certain compounds and causes them to emit light; typically, but not necessarily, visible light. A complementary technique is absorption spectroscopy. In the special case of single molecule fluorescence spectroscopy, intensity fluctuations from the emitted light are measured from either single fluorophores, or pairs of fluorophores.

<span class="mw-page-title-main">Monochromator</span> Optical device

A monochromator is an optical device that transmits a mechanically selectable narrow band of wavelengths of light or other radiation chosen from a wider range of wavelengths available at the input. The name is from the Greek roots mono-, "single", and chroma, "colour", and the Latin suffix -ator, denoting an agent.

<span class="mw-page-title-main">Photometer</span> Instrument to measure light intensity

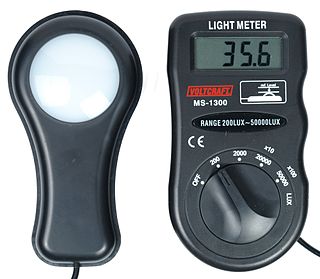
A photometer is an instrument that measures the strength of electromagnetic radiation in the range from ultraviolet to infrared and including the visible spectrum. Most photometers convert light into an electric current using a photoresistor, photodiode, or photomultiplier.

<span class="mw-page-title-main">Glow discharge</span>

A glow discharge is a plasma formed by the passage of electric current through a gas. It is often created by applying a voltage between two electrodes in a glass tube containing a low-pressure gas. When the voltage exceeds a value called the striking voltage, the gas ionization becomes self-sustaining, and the tube glows with a colored light. The color depends on the gas used.

<span class="mw-page-title-main">X-ray spectroscopy</span> Technique to characterize materials using X-ray radiation

X-ray spectroscopy is a general term for several spectroscopic techniques for characterization of materials by using x-ray radiation.

<span class="mw-page-title-main">Elemental analysis</span> Process of analytical chemistry

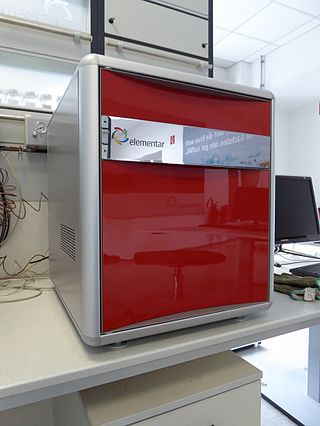
Elemental analysis is a process where a sample of some material is analyzed for its elemental and sometimes isotopic composition. Elemental analysis can be qualitative, and it can be quantitative. Elemental analysis falls within the ambit of analytical chemistry, the instruments involved in deciphering the chemical nature of our world.

Graphite furnace atomic absorption spectroscopy (GFAAS), also known as electrothermal atomic absorption spectroscopy (ETAAS), is a type of spectrometry that uses a graphite-coated furnace to vaporize the sample. Briefly, the technique is based on the fact that free atoms will absorb light at frequencies or wavelengths characteristic of the element of interest. Within certain limits, the amount of light absorbed can be linearly correlated to the concentration of analyte present. Free atoms of most elements can be produced from samples by the application of high temperatures. In GFAAS, samples are deposited in a small graphite or pyrolytic carbon coated graphite tube, which can then be heated to vaporize and atomize the analyte. The atoms absorb ultraviolet or visible light and make transitions to higher electronic energy levels. Applying the Beer-Lambert law directly in AA spectroscopy is difficult due to variations in the atomization efficiency from the sample matrix, and nonuniformity of concentration and path length of analyte atoms. Concentration measurements are usually determined from a working curve after calibrating the instrument with standards of known concentration. The main advantages of the graphite furnace comparing to aspiration atomic absorption are the following:

<span class="mw-page-title-main">Inductively coupled plasma atomic emission spectroscopy</span> Analytic scientific technique

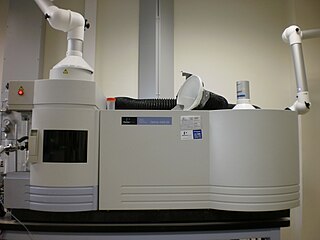
Inductively coupled plasma atomic emission spectroscopy (ICP-AES), also referred to as inductively coupled plasma optical emission spectroscopy (ICP-OES), is an analytical technique used for the detection of chemical elements. It is a type of emission spectroscopy that uses the inductively coupled plasma to produce excited atoms and ions that emit electromagnetic radiation at wavelengths characteristic of a particular element. The plasma is a high temperature source of ionised source gas. The plasma is sustained and maintained by inductive coupling from electrical coils at megahertz frequencies. The source temperature is in the range from 6000 to 10,000 K. The intensity of the emissions from various wavelengths of light are proportional to the concentrations of the elements within the sample.

<span class="mw-page-title-main">Atomic emission spectroscopy</span> Analytical method using radiation to identify chemical elements in a sample

Atomic emission spectroscopy (AES) is a method of chemical analysis that uses the intensity of light emitted from a flame, plasma, arc, or spark at a particular wavelength to determine the quantity of an element in a sample. The wavelength of the atomic spectral line in the emission spectrum gives the identity of the element while the intensity of the emitted light is proportional to the number of atoms of the element. The sample may be excited by various methods.

<span class="mw-page-title-main">Fourier-transform infrared spectroscopy</span> Technique to analyze the infrared spectrum of matter

Fourier-transform infrared spectroscopy (FTIR) is a technique used to obtain an infrared spectrum of absorption or emission of a solid, liquid, or gas. An FTIR spectrometer simultaneously collects high-resolution spectral data over a wide spectral range. This confers a significant advantage over a dispersive spectrometer, which measures intensity over a narrow range of wavelengths at a time.

<span class="mw-page-title-main">X-ray emission spectroscopy</span>

X-ray emission spectroscopy (XES) is a form of X-ray spectroscopy in which a core electron is excited by an incident x-ray photon and then this excited state decays by emitting an x-ray photon to fill the core hole. The energy of the emitted photon is the energy difference between the involved electronic levels. The analysis of the energy dependence of the emitted photons is the aim of the X-ray emission spectroscopy.

In physics, monochromatic radiation is electromagnetic radiation with a single constant frequency or wavelength. When that frequency is part of the visible spectrum the term monochromatic light is often used. Monochromatic light is perceived by the human eye as a spectral color.

References

  1. "TAS-990 Atomic Absorption Spectrophotometer-纳米材料工程研究中心". ercn.henu.edu.cn. Retrieved 2022-10-12.
  2. "Robert Bunsen and Gustav Kirchhoff". Science History Institute. Retrieved 20 March 2018.
  3. McCarthy, G.J. "Walsh, Alan - Biographical entry". Encyclopedia of Australian Science. Retrieved 22 May 2012.
  4. 1 2 Koirtyohann, S. R. (1991). "A History of Atomic Absorption Spectrometry". Analytical Chemistry. 63 (21): 1024A–1031A. doi:10.1021/ac00021a716. ISSN   0003-2700.
  5. L'vov, Boris (1990). "Recent advances in absolute analysis by graphite furnace atomic absorption spectrometry" . Spectrochimica Acta Part B: Atomic Spectroscopy. 45 (7): 633–655. Bibcode:1990AcSpe..45..633L. doi:10.1016/0584-8547(90)80046-L.
  6. "Analytical Methods for Graphite Tube Atomizers" (PDF). agilent.com. Agilent Technologies. Archived (PDF) from the original on 2022-10-09.
  7. "Atomic Spectroscopy - GF-AAS". sites.chem.utoronto.ca. Retrieved 2021-03-08.
  8. Harvey, David (2016-05-25). "Atomic Absorption Spectroscopy". chem.libretexts.org. Archived from the original on 2017-10-06. Retrieved 2017-10-06.
  9. "Sample Atomization – Atomic Absorption Spectroscopy Learning Module". blogs.maryville.edu. Retrieved 2017-11-02.
  10. Walsh, Alan; Becker-Ross, Helmut; Florek, Stefan; Heitmann, Uwe (19 January 2006). High-Resolution Continuum Source AAS. Weinheim: Wiley‐VCH Verlag GmbH & Co. KGaA. p. 2. ISBN   9783527307364.
  11. Rakshit, Amitava. "Basics of Laboratory Safety: Common laboratory rules and regulations". The International Association for Ecology. Intecol. Archived from the original on 27 September 2016. Retrieved 26 September 2016.
  12. Preedy, Victor R. (2015-04-17). Fluorine: Chemistry, Analysis, Function and Effects. Royal Society of Chemistry. ISBN   9781782624929.

Further reading