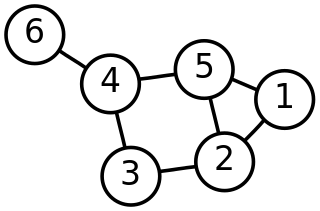
In mathematics, graph theory is the study of graphs, which are mathematical structures used to model pairwise relations between objects. A graph in this context is made up of vertices which are connected by edges. A distinction is made between undirected graphs, where edges link two vertices symmetrically, and directed graphs, where edges link two vertices asymmetrically. Graphs are one of the principal objects of study in discrete mathematics.

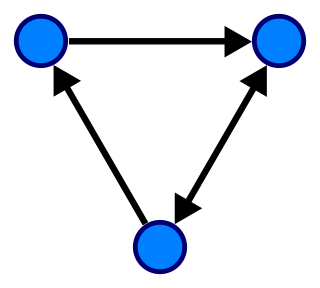
In mathematics, particularly graph theory, and computer science, a directed acyclic graph (DAG) is a directed graph with no directed cycles. That is, it consists of vertices and edges, with each edge directed from one vertex to another, such that following those directions will never form a closed loop. A directed graph is a DAG if and only if it can be topologically ordered, by arranging the vertices as a linear ordering that is consistent with all edge directions. DAGs have numerous scientific and computational applications, ranging from biology to information science to computation (scheduling).

In graph theory, an isomorphism of graphsG and H is a bijection between the vertex sets of G and H

In computer science, the clique problem is the computational problem of finding cliques in a graph. It has several different formulations depending on which cliques, and what information about the cliques, should be found. Common formulations of the clique problem include finding a maximum clique, finding a maximum weight clique in a weighted graph, listing all maximal cliques, and solving the decision problem of testing whether a graph contains a clique larger than a given size.
In theoretical computer science, the subgraph isomorphism problem is a computational task in which two graphs G and H are given as input, and one must determine whether G contains a subgraph that is isomorphic to H. Subgraph isomorphism is a generalization of both the maximum clique problem and the problem of testing whether a graph contains a Hamiltonian cycle, and is therefore NP-complete. However certain other cases of subgraph isomorphism may be solved in polynomial time.

In the mathematical area of graph theory, a clique is a subset of vertices of an undirected graph such that every two distinct vertices in the clique are adjacent. That is, a clique of a graph is an induced subgraph of that is complete. Cliques are one of the basic concepts of graph theory and are used in many other mathematical problems and constructions on graphs. Cliques have also been studied in computer science: the task of finding whether there is a clique of a given size in a graph is NP-complete, but despite this hardness result, many algorithms for finding cliques have been studied.
In computer science, a graph is an abstract data type that is meant to implement the undirected graph and directed graph concepts from the field of graph theory within mathematics.

In the mathematical theory of directed graphs, a graph is said to be strongly connected if every vertex is reachable from every other vertex. The strongly connected components of an arbitrary directed graph form a partition into subgraphs that are themselves strongly connected. It is possible to test the strong connectivity of a graph, or to find its strongly connected components, in linear time.
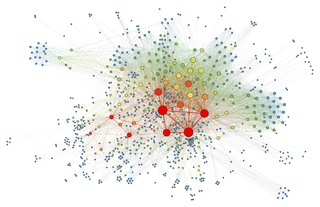
Force-directed graph drawing algorithms are a class of algorithms for drawing graphs in an aesthetically-pleasing way. Their purpose is to position the nodes of a graph in two-dimensional or three-dimensional space so that all the edges are of more or less equal length and there are as few crossing edges as possible, by assigning forces among the set of edges and the set of nodes, based on their relative positions, and then using these forces either to simulate the motion of the edges and nodes or to minimize their energy.
The graph isomorphism problem is the computational problem of determining whether two finite graphs are isomorphic.
The Recursive Porous Agent Simulation Toolkit (Repast) is a widely used free and open-source, cross-platform, agent-based modeling and simulation toolkit. Repast has multiple implementations in several languages and built-in adaptive features, such as genetic algorithms and regression.
Dynamic network analysis (DNA) is an emergent scientific field that brings together traditional social network analysis (SNA), link analysis (LA), social simulation and multi-agent systems (MAS) within network science and network theory. Dynamic networks are a function of time to a set of graphs; for each time point there is a graph. This is akin to the definition of dynamical systems, in which the function is from time to an ambient space, where instead of ambient space time is translated to relationships between pairs of vertices.
In mathematics, a graph partition is the reduction of a graph to a smaller graph by partitioning its set of nodes into mutually exclusive groups. Edges of the original graph that cross between the groups will produce edges in the partitioned graph. If the number of resulting edges is small compared to the original graph, then the partitioned graph may be better suited for analysis and problem-solving than the original. Finding a partition that simplifies graph analysis is a hard problem, but one that has applications to scientific computing, VLSI circuit design, and task scheduling in multiprocessor computers, among others. Recently, the graph partition problem has gained importance due to its application for clustering and detection of cliques in social, pathological and biological networks. For a survey on recent trends in computational methods and applications see Buluc et al. (2013). Two common examples of graph partitioning are minimum cut and maximum cut problems.
In the mathematical field of graph theory, an automorphism of a graph is a form of symmetry in which the graph is mapped onto itself while preserving the edge–vertex connectivity.
In graph theory, a branch of mathematics, graph canonization is the problem of finding a canonical form of a given graph G. A canonical form is a labeled graph Canon(G) that is isomorphic to G, such that every graph that is isomorphic to G has the same canonical form as G. Thus, from a solution to the graph canonization problem, one could also solve the problem of graph isomorphism: to test whether two graphs G and H are isomorphic, compute their canonical forms Canon(G) and Canon(H), and test whether these two canonical forms are identical.

A Reeb graph is a mathematical object reflecting the evolution of the level sets of a real-valued function on a manifold. According to a similar concept was introduced by G.M. Adelson-Velskii and A.S. Kronrod and applied to analysis of Hilbert's thirteenth problem. Proposed by G. Reeb as a tool in Morse theory, Reeb graphs are the natural tool to study multivalued functional relationships between 2D scalar fields , , and arising from the conditions and , because these relationships are single-valued when restricted to a region associated with an individual edge of the Reeb graph. This general principle was first used to study neutral surfaces in oceanography.
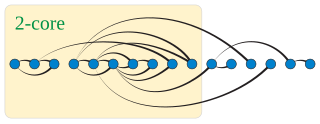
In graph theory, a k-degenerate graph is an undirected graph in which every subgraph has a vertex of degree at most k: that is, some vertex in the subgraph touches k or fewer of the subgraph's edges. The degeneracy of a graph is the smallest value of k for which it is k-degenerate. The degeneracy of a graph is a measure of how sparse it is, and is within a constant factor of other sparsity measures such as the arboricity of a graph.

In graph drawing, a circular layout is a style of drawing that places the vertices of a graph on a circle, often evenly spaced so that they form the vertices of a regular polygon.
The HCS clustering algorithm is an algorithm based on graph connectivity for cluster analysis. It works by representing the similarity data in a similarity graph, and then finding all the highly connected subgraphs. It does not make any prior assumptions on the number of the clusters. This algorithm was published by Erez Hartuv and Ron Shamir in 2000.

NodeXL is a network analysis and visualization software package for Microsoft Excel 2007/2010/2013/2016. The package is similar to other network visualization tools such as Pajek, UCINet, and Gephi. It is widely applied in ring, mapping of vertex and edge, and customizable visual attributes and tags. It enables researchers to undertake social network analysis work metrics such as centrality, degree, and clustering, as well as see relational data and describe the overall relational network structure. When it was applied to Twitter data analysis, it showed the total network of all users participating in public discussion and its internal structure through data mining. It permits social Network analysis (SNA) to emphasize the relationships rather than the isolated individuals or organizations, allowing interested parties to investigate the two-way dialogue between organizations and the public. SNA also provides a flexible measurement system and parameter selection to confirm the influential nodes in the network, such as in-degree and out-degree centrality. The software contains network visualization, social network analysis features, access to social media network data importers, advanced network metrics, and automation.