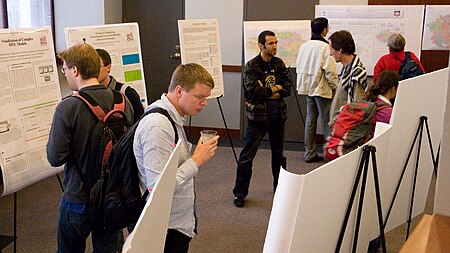
The International Symposium on Graph Drawing (GD) is an annual academic conference in which researchers present peer reviewed papers on graph drawing, information visualization of network information, geometric graph theory, and related topics.
The International Symposium on Graph Drawing (GD) is an annual academic conference in which researchers present peer reviewed papers on graph drawing, information visualization of network information, geometric graph theory, and related topics.
The Graph Drawing symposia have been central to the growth and development of graph drawing as a research area: as Herman et al. write, "the Graph Drawing community grew around the yearly Symposia." [1] Nguyen [2] lists Graph Drawing as one of "several good conferences which directly or indirectly concern with information visualization", and Wong et al. [3] report that its proceedings "provide a wealth of information". In a 2003 study the symposium was among the top 30% of computer science research publication venues, ranked by impact factor. [4]
The first symposium was held in Marino, near Rome, Italy, in 1992, organized by Giuseppe Di Battista, Peter Eades, Pierre Rosenstiehl, and Roberto Tamassia. The first two symposia did not publish proceedings, but reports are available online. [5] Since 1994, the proceedings of the symposia have been published by Springer-Verlag's Lecture Notes in Computer Science series. [6]
Countries in which the conference has been held include Australia, Austria, Canada, the Czech Republic, France, Germany (twice), Greece, Ireland, Italy (three times), and the United States (five times).
A citation graph having vertices representing the papers in the 1994–2000 Graph Drawing symposia and having edges representing citations between these papers was made available as part of the graph drawing contest associated with the 2001 symposium. [7] The largest connected component of this graph consists of 249 vertices and 642 edges; clustering analysis reveals several prominent subtopics within graph drawing that are more tightly connected, including three-dimensional graph drawing and orthogonal graph drawing. [8]

In mathematics, a hypergraph is a generalization of a graph in which an edge can join any number of vertices. In contrast, in an ordinary graph, an edge connects exactly two vertices.

Graph drawing is an area of mathematics and computer science combining methods from geometric graph theory and information visualization to derive two-dimensional depictions of graphs arising from applications such as social network analysis, cartography, linguistics, and bioinformatics.
Software visualization or software visualisation refers to the visualization of information of and related to software systems—either the architecture of its source code or metrics of their runtime behavior—and their development process by means of static, interactive or animated 2-D or 3-D visual representations of their structure, execution, behavior, and evolution.

In graph theory, a book embedding is a generalization of planar embedding of a graph to embeddings into a book, a collection of half-planes all having the same line as their boundary. Usually, the vertices of the graph are required to lie on this boundary line, called the spine, and the edges are required to stay within a single half-plane. The book thickness of a graph is the smallest possible number of half-planes for any book embedding of the graph. Book thickness is also called pagenumber, stacknumber or fixed outerthickness. Book embeddings have also been used to define several other graph invariants including the pagewidth and book crossing number.
Rigi is an interactive graph editor tool for software reverse engineering using the white box method, i.e. necessitating source code, thus it is mainly aimed at program comprehension. Rigi is distributed by its main author, Hausi A. Müller and the Rigi research group at the University of Victoria.

In topological graph theory, an embedding of a graph on a surface is a representation of on in which points of are associated with vertices and simple arcs are associated with edges in such a way that:
In graph theory, a branch of mathematics, many important families of graphs can be described by a finite set of individual graphs that do not belong to the family and further exclude all graphs from the family which contain any of these forbidden graphs as (induced) subgraph or minor. A prototypical example of this phenomenon is Kuratowski's theorem, which states that a graph is planar if and only if it does not contain either of two forbidden graphs, the complete graph K5 and the complete bipartite graph K3,3. For Kuratowski's theorem, the notion of containment is that of graph homeomorphism, in which a subdivision of one graph appears as a subgraph of the other. Thus, every graph either has a planar drawing or it has a subdivision of one of these two graphs as a subgraph.
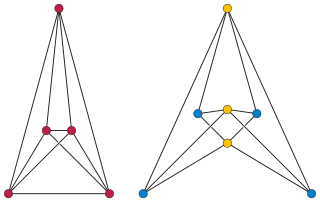
In the mathematical field of graph theory, an automorphism of a graph is a form of symmetry in which the graph is mapped onto itself while preserving the edge–vertex connectivity.

In combinatorics and order-theoretic mathematics, a multitree may describe either of two equivalent structures: a directed acyclic graph (DAG) in which the set of vertices reachable from any vertex induces a tree, or a partially ordered set (poset) that does not have four items a, b, c, and d forming a diamond suborder with a ≤ b ≤ d and a ≤ c ≤ d but with b and c incomparable to each other.
The Journal of Graph Algorithms and Applications is an open access peer-reviewed scientific journal covering the subject of graph algorithms and graph drawing. The journal was established in 1997 and the editor-in-chief is Giuseppe Liotta. It is abstracted and indexed by Scopus and MathSciNet.

Layered graph drawing or hierarchical graph drawing is a type of graph drawing in which the vertices of a directed graph are drawn in horizontal rows or layers with the edges generally directed downwards. It is also known as Sugiyama-style graph drawing after Kozo Sugiyama, who first developed this drawing style.
Kozo Sugiyama was a Japanese computer scientist and graph drawing researcher.

In graph drawing, the angular resolution of a drawing of a graph is the sharpest angle formed by any two edges that meet at a common vertex of the drawing.
Peter D. Eades is an Australian computer scientist, a professor in the School of Information Technologies at the University of Sydney, known for his expertise in graph drawing.
Jarke J. (Jack) van Wijk is a Dutch computer scientist, a professor in the Department of Mathematics and Computer Science at the Eindhoven University of Technology, and an expert in information visualization.

In graph drawing, a circular layout is a style of drawing that places the vertices of a graph on a circle, often evenly spaced so that they form the vertices of a regular polygon.

An arc diagram is a style of graph drawing, in which the vertices of a graph are placed along a line in the Euclidean plane, with edges being drawn as semicircles in one or both of the two halfplanes bounded by the line, or as smooth curves formed by sequences of semicircles. In some cases, line segments of the line itself are also allowed as edges, as long as they connect only vertices that are consecutive along the line. Variations of this drawing style in which the semicircles are replaced by convex curves of some other type are also commonly called arc diagrams.

NodeXL is a network analysis and visualization software package for Microsoft Excel 2007/2010/2013/2016. It is a popular package similar to other network visualization tools such as Pajek, UCINet, and Gephi. It is widely applied in ring, mapping of vertex and edge, and customizable visual attributes and tags. It enables researchers to undertake social network analysis work’s metrics such as centrality, degree, and clustering. It allows us to see the relational data and describe the overall relational network structure. When we applied it in Twitter data analysis, it can show the huge network of all users participating in public discussion and its internal structure through big data mining. It permits social Network analysis (SNA) emphasizes the relationships rather than isolated individuals or organizations, so this method allows us to investigate the ‘two-way dialogue between the organization and the public. SNA also provides researchers with a flexible measurement system and parameter selection to confirm the influential nodes in the network, such as in-degree and out-degree centrality. The free version contains network visualization and social network analysis features. The commercial version includes access to social media network data importers, advanced network metrics, and automation.
In graph drawing, a RAC drawing of a graph is a drawing in which the vertices are represented as points, the edges are represented as straight line segments or polylines, at most two edges cross at any point, and when two edges cross they do so at right angles to each other. In the name of this drawing style, "RAC" stands for "right angle crossing".
| General | |
|---|---|
| National libraries | |
| Other | |