
Graph drawing is an area of mathematics and computer science combining methods from geometric graph theory and information visualization to derive two-dimensional depictions of graphs arising from applications such as social network analysis, cartography, linguistics, and bioinformatics.
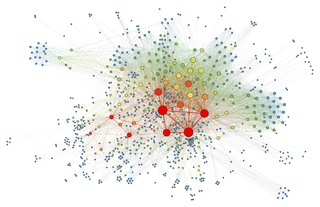
Force-directed graph drawing algorithms are a class of algorithms for drawing graphs in an aesthetically-pleasing way. Their purpose is to position the nodes of a graph in two-dimensional or three-dimensional space so that all the edges are of more or less equal length and there are as few crossing edges as possible, by assigning forces among the set of edges and the set of nodes, based on their relative positions, and then using these forces either to simulate the motion of the edges and nodes or to minimize their energy.
Software visualization or software visualisation refers to the visualization of information of and related to software systems—either the architecture of its source code or metrics of their runtime behavior—and their development process by means of static, interactive or animated 2-D or 3-D visual representations of their structure, execution, behavior, and evolution.

In topological graph theory, an embedding of a graph on a surface is a representation of on in which points of are associated with vertices and simple arcs are associated with edges in such a way that:

The International Symposium on Graph Drawing (GD) is an annual academic conference in which researchers present peer reviewed papers on graph drawing, information visualization of network information, geometric graph theory, and related topics.
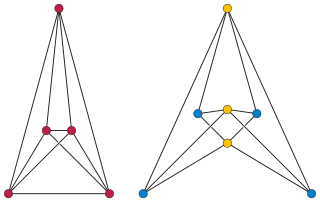
In the mathematical field of graph theory, an automorphism of a graph is a form of symmetry in which the graph is mapped onto itself while preserving the edge–vertex connectivity.
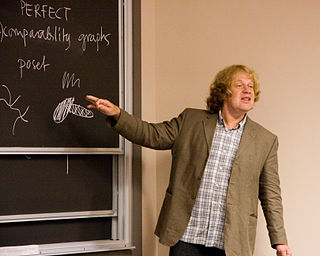
János Pach is a mathematician and computer scientist working in the fields of combinatorics and discrete and computational geometry.

Layered graph drawing or hierarchical graph drawing is a type of graph drawing in which the vertices of a directed graph are drawn in horizontal rows or layers with the edges generally directed downwards. It is also known as Sugiyama-style graph drawing after Kozo Sugiyama, who first developed this drawing style.
Kozo Sugiyama was a Japanese computer scientist and graph drawing researcher.

In graph drawing, the angular resolution of a drawing of a graph is the sharpest angle formed by any two edges that meet at a common vertex of the drawing.
Dorothea Wagner is a German computer scientist, known for her research in graph drawing, route planning, and social network analysis. She heads the Institute of Theoretical Informatics at the Karlsruhe Institute of Technology.
Meurs Challenger is an online graph visualization program, with data analysis and browsing.

In graph drawing, a circular layout is a style of drawing that places the vertices of a graph on a circle, often evenly spaced so that they form the vertices of a regular polygon.

An arc diagram is a style of graph drawing, in which the vertices of a graph are placed along a line in the Euclidean plane, with edges being drawn as semicircles in one or both of the two halfplanes bounded by the line, or as smooth curves formed by sequences of semicircles. In some cases, line segments of the line itself are also allowed as edges, as long as they connect only vertices that are consecutive along the line. Variations of this drawing style in which the semicircles are replaced by convex curves of some other type are also commonly called arc diagrams.
In graph drawing, a RAC drawing of a graph is a drawing in which the vertices are represented as points, the edges are represented as straight line segments or polylines, at most two edges cross at any point, and when two edges cross they do so at right angles to each other. In the name of this drawing style, "RAC" stands for "right angle crossing".
In graph drawing, planarization is a method of extending drawing methods from planar graphs to graphs that are not planar, by embedding the non-planar graphs within a larger planar graph.
In graph drawing, the area used by a drawing is a commonly used way of measuring its quality.
In graph drawing styles that represent the edges of a graph by polylines, it is desirable to minimize the number of bends per edge or the total number of bends in a drawing. Bend minimization is the algorithmic problem of finding a drawing that minimizes these quantities.
Petra Mutzel is a German computer scientist, a University Professor of computer science at the University of Bonn. Her research is in the areas of algorithm engineering, graph drawing and combinatorial optimization.
Simultaneous embedding is a technique in graph drawing and information visualization for visualizing two or more different graphs on the same or overlapping sets of labeled vertices, while avoiding crossings within both graphs. Crossings between an edge of one graph and an edge of the other graph are allowed.
