Related Research Articles

Graph drawing is an area of mathematics and computer science combining methods from geometric graph theory and information visualization to derive two-dimensional depictions of graphs arising from applications such as social network analysis, cartography, linguistics, and bioinformatics.

Chartjunk consists of all visual elements in charts and graphs that are not necessary to comprehend the information represented on the graph, or that distract the viewer from this information.

In information visualization and computing, treemapping is a method for displaying hierarchical data using nested figures, usually rectangles.

Ben Shneiderman is an American computer scientist, a Distinguished University Professor in the University of Maryland Department of Computer Science, which is part of the University of Maryland College of Computer, Mathematical, and Natural Sciences at the University of Maryland, College Park, and the founding director (1983-2000) of the University of Maryland Human-Computer Interaction Lab. He conducted fundamental research in the field of human–computer interaction, developing new ideas, methods, and tools such as the direct manipulation interface, and his eight rules of design.
The graph isomorphism problem is the computational problem of determining whether two finite graphs are isomorphic.
Software visualization or software visualisation refers to the visualization of information of and related to software systems—either the architecture of its source code or metrics of their runtime behavior—and their development process by means of static, interactive or animated 2-D or 3-D visual representations of their structure, execution, behavior, and evolution.

Patrick M. Hanrahan is an American computer graphics researcher, the Canon USA Professor of Computer Science and Electrical Engineering in the Computer Graphics Laboratory at Stanford University. His research focuses on rendering algorithms, graphics processing units, as well as scientific illustration and visualization. He has received numerous awards, including the 2019 Turing Award.
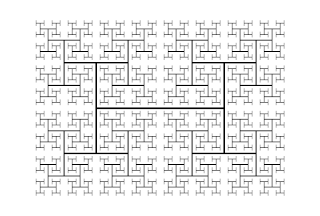
In fractal geometry, the H tree is a fractal tree structure constructed from perpendicular line segments, each smaller by a factor of the square root of 2 from the next larger adjacent segment. It is so called because its repeating pattern resembles the letter "H". It has Hausdorff dimension 2, and comes arbitrarily close to every point in a rectangle. Its applications include VLSI design and microwave engineering.

The International Symposium on Graph Drawing (GD) is an annual academic conference in which researchers present peer reviewed papers on graph drawing, information visualization of network information, geometric graph theory, and related topics.
Larry Joseph Stockmeyer was an American computer scientist. He was one of the pioneers in the field of computational complexity theory, and he also worked in the field of distributed computing. He died of pancreatic cancer.

In combinatorics and order theory, a multitree may describe either of two equivalent structures: a directed acyclic graph (DAG) in which there is at most one directed path between any two vertices, or equivalently in which the subgraph reachable from any vertex induces an undirected tree, or a partially ordered set (poset) that does not have four items a, b, c, and d forming a diamond suborder with a ≤ b ≤ d and a ≤ c ≤ d but with b and c incomparable to each other.

Christopher Ray Johnson is an American computer scientist. He is a distinguished professor of computer science at the University of Utah, and founding director of the Scientific Computing and Imaging Institute (SCI). His research interests are in the areas of scientific computing and scientific visualization.
The Journal of Graph Algorithms and Applications is an open access peer-reviewed scientific journal covering the subject of graph algorithms and graph drawing. The journal was established in 1997 and the editor-in-chief is Giuseppe Liotta. It is abstracted and indexed by Scopus and MathSciNet.
Space Gremlin is a disk space analysis tool for Mac OS X.

Jean-Daniel Fekete is a French computer scientist.

An arc diagram is a style of graph drawing, in which the vertices of a graph are placed along a line in the Euclidean plane, with edges being drawn as semicircles in one or both of the two halfplanes bounded by the line, or as smooth curves formed by sequences of semicircles. In some cases, line segments of the line itself are also allowed as edges, as long as they connect only vertices that are consecutive along the line. Variations of this drawing style in which the semicircles are replaced by convex curves of some other type are also commonly called arc diagrams.

NodeXL is a network analysis and visualization software package for Microsoft Excel 2007/2010/2013/2016. The package is similar to other network visualization tools such as Pajek, UCINet, and Gephi. It is widely applied in ring, mapping of vertex and edge, and customizable visual attributes and tags. NodeXL enables researchers to undertake social network analysis work metrics such as centrality, degree, and clustering, as well as monitor relational data and describe the overall relational network structure. When applied to Twitter data analysis, it showed the total network of all users participating in public discussion and its internal structure through data mining. It allows social Network analysis (SNA) to emphasize the relationships rather than the isolated individuals or organizations, allowing interested parties to investigate the two-way dialogue between organizations and the public. SNA also provides a flexible measurement system and parameter selection to confirm the influential nodes in the network, such as in-degree and out-degree centrality. The software contains network visualization, social network analysis features, access to social media network data importers, advanced network metrics, and automation.
A software map represents static, dynamic, and evolutionary information of software systems and their software development processes by means of 2D or 3D map-oriented information visualization. It constitutes a fundamental concept and tool in software visualization, software analytics, and software diagnosis. Its primary applications include risk analysis for and monitoring of code quality, team activity, or software development progress and, generally, improving effectiveness of software engineering with respect to all related artifacts, processes, and stakeholders throughout the software engineering process and software maintenance.
The IEEE Visualization Conference (VIS) is an annual conference on scientific visualization, information visualization, and visual analytics administrated by the IEEE Computer Society Technical Committee on Visualization and Graphics. As ranked by Google Scholar's h-index metric in 2016, VIS is the highest rated venue for visualization research and the second-highest rated conference for computer graphics over all. It has an 'A' rating from the Australian Ranking of ICT Conferences, an 'A' rating from the Brazilian ministry of education, and an 'A' rating from the China Computer Federation (CCF). The conference is highly selective with generally < 25% acceptance rates for all papers.
Jessica Hullman is a computer scientist and the Ginni Rometty associate professor of Computer Science at Northwestern University. She is known for her research in Information visualization.
References
- ↑ Riegler aus Providence, Alexandra (November 1, 2011), "Die vielen Arten, das Abstrakte sichtbar zu machen", Der Standard (in German).
- 1 2 3 "The 2007 Visualization Technical Achievement Award: Jarke J. van Wijk", IEEE Visualization Conference and IEEE Information Visualization Conference Proceedings 2008, IEEE Transactions on Visualization and Computer Graphics, p. xxii, doi:10.1109/TVCG.2008.156 .
- ↑ Jarke J. van Wijk at the Mathematics Genealogy Project
- 1 2 MagnaView Management Archived 2011-10-22 at the Wayback Machine , retrieved 2011-11-10.
- ↑ van Wijk, Jarke J. (1991), "Spot noise texture synthesis for data visualization", Proc. 18th Conf. Computer Graphics and Interactive Techniques (SIGGRAPH '91), pp. 309–318, doi: 10.1145/122718.122751 , ISBN 978-0897914369
- ↑ Van Wijk, J.J.; Van de Wetering, H. (1999), "Cushion treemaps: visualization of hierarchical information", Proc. IEEE Symp. Information Visualization (Info Vis '99), pp. 73–78, CiteSeerX 10.1.1.41.9759 , doi:10.1109/INFVIS.1999.801860, ISBN 978-0-7695-0431-5, S2CID 195861945 .
- ↑ Bruls, Mark; Huizing, Kees; van Wijk, Jarke J. (2000), "Squarified treemaps", in de Leeuw, W.; van Liere, R. (eds.), Data Visualization 2000: Proc. Joint Eurographics and IEEE TCVG Symp. on Visualization (PDF), Springer-Verlag, pp. 33–42.
- ↑ de Leeuw, Willem C.; van Wijk, Jarke J. (1993), "A probe for local flow field visualization", Proc. 4th Conference on Visualization (VIS '93), pp. 39–45, doi:10.1109/VISUAL.1993.398849, ISBN 978-0-8186-3940-1, S2CID 30679206 .
- ↑ van Wijk, Jarke J. (2002), "Image based flow visualization", Proc. 29th Conf. Computer Graphics and Interactive Techniques (SIGGRAPH '02), pp. 745–754, CiteSeerX 10.1.1.134.5780 , doi:10.1145/566570.566646, ISBN 978-1581135213, S2CID 14771144 .
- ↑ Aron, Jacob (December 10, 2009), "Clever folds in a globe give new perspectives on Earth", New Scientist.
- ↑ MagnaView CSO awarded Henry Johns Award of British Cartographic Society, MagnaView, June 18, 2009, archived from the original on April 25, 2012, retrieved November 10, 2011.
- ↑ The Henry Johns Award 2009, The British Cartographic Society, retrieved 2011-11-10.
- ↑ van Ham, F.; Van Wijk, J.J. (2004), "Interactive Visualization of Small World Graphs", Proc. IEEE Symp. Information Visualization (INFOVIS 2004), pp. 199–206, doi:10.1109/INFVIS.2004.43, ISBN 978-0-7803-8779-9, S2CID 9982808 .
- ↑ Kleiberg, Ernst; van de Wetering, Huub; Wijk, Jarke J. Van (2001), "Botanical Visualization of Huge Hierarchies", IEEE Symp. Information Visualization (INFOVIS 2001), p. 87, CiteSeerX 10.1.1.332.1952 , doi:10.1109/INFVIS.2001.963285, ISBN 978-0-7695-7342-7, S2CID 9930408 .
- ↑ Holten, Danny; van Wijk, Jarke J. (2009), "A user study on visualizing directed edges in graphs", Proceedings of the 27th International Conference on Human Factors in Computing Systems (CHI '09) (PDF), pp. 2299–2308, CiteSeerX 10.1.1.212.5461 , doi:10.1145/1518701.1519054, ISBN 9781605582467, S2CID 9725345, archived from the original (PDF) on 2011-11-06.
- ↑ Holten, Danny; Isenberg, Petra; van Wijk, Jarke J.; Fekete, Jean-Daniel (2011), "An extended evaluation of the readability of tapered, animated, and textured directed-edge representations in node-link graphs", IEEE Pacific Visualization Symposium (PacificVis 2011) (PDF), pp. 195–202, doi:10.1109/PACIFICVIS.2011.5742390, ISBN 978-1-61284-935-5, S2CID 16526781 .
- ↑ Graph Drawing 2011 program, retrieved 2011-11-10.
- ↑ 2013 IEEE VIS Guest Speakers, retrieved 2014-11-18.