Definition
The index is derived arithmetically by: [3]

Where :
- = Dew point at 850 hPa
- = Temperature at 850 hPa
- = Dew point at 700 hPa
- = Temperature at 700 hPa
- = Temperature at 500 hPa
The K-Index or George's Index is a measure of thunderstorm potential in meteorology. According to the National Weather Service, the index harnesses measurements such as "vertical temperature lapse rate, moisture content of the lower atmosphere, and the vertical extent of the moist layer." [1] It was developed by the American meteorologist Joseph J. George, and published in the 1960 book Weather Forecasting for Aeronautics. [2]
The index is derived arithmetically by: [3]
Where :
The K Index is related to the probability of occurrence of a thunderstorm. It was developed with the idea that Potential = 4 x (KI - 15), which gives the following interpretation: [1] [4]
| K-index values vs. Thunderstorm Probability | ||
|---|---|---|
| K-index value (in °C) | Thunderstorm Probability | |
| Less than 20 | None | |
| 20 to 25 | Isolated thunderstorms | |
| 26 to 30 | Widely scattered thunderstorms | |
| 31 to 35 | Scattered thunderstorms | |
| Above 35 | Numerous thunderstorms | |

A thunderstorm, also known as an electrical storm or a lightning storm, is a storm characterized by the presence of lightning and its acoustic effect on the Earth's atmosphere, known as thunder. Relatively weak thunderstorms are sometimes called thundershowers. Thunderstorms occur in a type of cloud known as a cumulonimbus. They are usually accompanied by strong winds, and often produce heavy rain and sometimes snow, sleet, or hail, but some thunderstorms produce little precipitation or no precipitation at all. Thunderstorms may line up in a series or become a rainband, known as a squall line. Strong or severe thunderstorms include some of the most dangerous weather phenomena, including large hail, strong winds, and tornadoes. Some of the most persistent severe thunderstorms, known as supercells, rotate as do cyclones. While most thunderstorms move with the mean wind flow through the layer of the troposphere that they occupy, vertical wind shear sometimes causes a deviation in their course at a right angle to the wind shear direction.
Geopotential height or geopotential altitude is a vertical coordinate referenced to Earth's mean sea level, an adjustment to geometric height that accounts for the variation of gravity with latitude and altitude. Thus, it can be considered a "gravity-adjusted height".

The lapse rate is the rate at which an atmospheric variable, normally temperature in Earth's atmosphere, falls with altitude. Lapse rate arises from the word lapse, in the sense of a gradual fall.
Equivalent potential temperature, commonly referred to as theta-e, is a quantity that is conserved during changes to an air parcel's pressure, even if water vapor condenses during that pressure change. It is therefore more conserved than the ordinary potential temperature, which remains constant only for unsaturated vertical motions.
A weather map, also known as synoptic weather chart, displays various meteorological features across a particular area at a particular point in time and has various symbols which all have specific meanings. Such maps have been in use since the mid-19th century and are used for research and weather forecasting purposes. Maps using isotherms show temperature gradients, which can help locate weather fronts. Isotach maps, analyzing lines of equal wind speed, on a constant pressure surface of 300 or 250 hPa show where the jet stream is located. Use of constant pressure charts at the 700 and 500 hPa level can indicate tropical cyclone motion. Two-dimensional streamlines based on wind speeds at various levels show areas of convergence and divergence in the wind field, which are helpful in determining the location of features within the wind pattern. A popular type of surface weather map is the surface weather analysis, which plots isobars to depict areas of high pressure and low pressure. Cloud codes are translated into symbols and plotted on these maps along with other meteorological data that are included in synoptic reports sent by professionally trained observers.
METAR is a format for reporting weather information. A METAR weather report is predominantly used by aircraft pilots, and by meteorologists, who use aggregated METAR information to assist in weather forecasting.

Weather radar, also called weather surveillance radar (WSR) and Doppler weather radar, is a type of radar used to locate precipitation, calculate its motion, and estimate its type. Modern weather radars are mostly pulse-Doppler radars, capable of detecting the motion of rain droplets in addition to the intensity of the precipitation. Both types of data can be analyzed to determine the structure of storms and their potential to cause severe weather.

In meteorology, convective available potential energy, is the integrated amount of work that the upward (positive) buoyancy force would perform on a given mass of air if it rose vertically through the entire atmosphere. Positive CAPE will cause the air parcel to rise, while negative CAPE will cause the air parcel to sink. Nonzero CAPE is an indicator of atmospheric instability in any given atmospheric sounding, a necessary condition for the development of cumulus and cumulonimbus clouds with attendant severe weather hazards.

Cyclogenesis is the development or strengthening of cyclonic circulation in the atmosphere. Cyclogenesis is an umbrella term for at least three different processes, all of which result in the development of some sort of cyclone, and at any size from the microscale to the synoptic scale.

A tephigram is one of four thermodynamic diagrams commonly used in weather analysis and forecasting. The name evolved from the original name "T--gram" to describe the axes of temperature (T) and entropy used to create the plot. Usually, temperature and dew point data from radiosondes are plotted on these diagrams to allow calculations of convective stability or convective available potential energy (CAPE). Wind barbs are often plotted at the side of a tephigram to indicate the winds at different heights.

A snowsquall, or snow squall, is a sudden moderately heavy snow fall with blowing snow and strong, gusty surface winds. It is often referred to as a whiteout and is similar to a blizzard but is localized in time or in location and snow accumulations may or may not be significant.
The wet-bulb temperature (WBT) is the temperature read by a thermometer covered in water-soaked cloth over which air is passed. At 100% relative humidity, the wet-bulb temperature is equal to the air temperature ; at lower humidity the wet-bulb temperature is lower than dry-bulb temperature because of evaporative cooling.
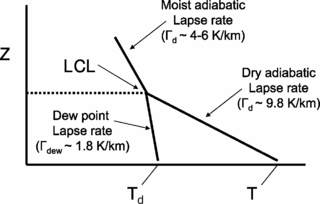
The lifted condensation level or lifting condensation level (LCL) is formally defined as the height at which the relative humidity (RH) of an air parcel will reach 100% with respect to liquid water when it is cooled by dry adiabatic lifting. The RH of air increases when it is cooled, since the amount of water vapor in the air remains constant, while the saturation vapor pressure decreases almost exponentially with decreasing temperature. If the air parcel is lifting further beyond the LCL, water vapor in the air parcel will begin condensing, forming cloud droplets. The LCL is a good approximation of the height of the cloud base which will be observed on days when air is lifted mechanically from the surface to the cloud base.

A tropical cyclone is a rapidly rotating storm system characterized by a low-pressure center, a closed low-level atmospheric circulation, strong winds, and a spiral arrangement of thunderstorms that produce heavy rain and/or squalls. Depending on its location and strength, a tropical cyclone is referred to by different names, including hurricane, typhoon, tropical storm, cyclonic storm, tropical depression, or simply cyclone. A hurricane is a tropical cyclone that occurs in the Atlantic Ocean and northeastern Pacific Ocean, and a typhoon occurs in the northwestern Pacific Ocean; in the south Pacific or Indian Ocean, comparable storms are referred to simply as "tropical cyclones" or "severe cyclonic storms".

The lifted index (LI) is the temperature difference between the environment Te(p) and an air parcel lifted adiabatically Tp(p) at a given pressure height in the troposphere of the atmosphere, usually 500 hPa (mb). The temperature is measured in Celsius. When the value is positive, the atmosphere is stable and when the value is negative, the atmosphere is unstable.

In atmospheric sciences, the free convective layer (FCL) is the layer of conditional or potential instability in the troposphere. It is a layer in which rising air can experience positive buoyancy (PBE) so that deep, moist convection (DMC) can occur. On an atmospheric sounding, it is the layer between the level of free convection (LFC) and the equilibrium level (EL). The FCL is important to a variety of convective processes and to severe thunderstorm forecasting.
Atmospheric convection is the result of a parcel-environment instability, or temperature difference layer in the atmosphere. Different lapse rates within dry and moist air masses lead to instability. Mixing of air during the day which expands the height of the planetary boundary layer leads to increased winds, cumulus cloud development, and decreased surface dew points. Moist convection leads to thunderstorm development, which is often responsible for severe weather throughout the world. Special threats from thunderstorms include hail, downbursts, and tornadoes.

Atmospheric instability is a condition where the Earth's atmosphere is generally considered to be unstable and as a result the weather is subjected to a high degree of variability through distance and time. Atmospheric stability is a measure of the atmosphere's tendency to discourage or deter vertical motion, and vertical motion is directly correlated to different types of weather systems and their severity. In unstable conditions, a lifted thing, such as a parcel of air will be warmer than the surrounding air at altitude. Because it is warmer, it is less dense and is prone to further ascent.
The following is a glossary of tornado terms. It includes scientific as well as selected informal terminology.
This glossary of meteorology is a list of terms and concepts relevant to meteorology and atmospheric science, their sub-disciplines, and related fields.


