
In probability theory and statistics, the cumulative distribution function (CDF) of a real-valued random variable , or just distribution function of , evaluated at , is the probability that will take a value less than or equal to .

In statistics, the Kolmogorov–Smirnov test is a nonparametric test of the equality of continuous, one-dimensional probability distributions that can be used to test whether a sample came from a given reference probability distribution, or to test whether two samples came from the same distribution. Intuitively, the test provides a method to qualitatively answer the question "How likely is it that we would see a collection of samples like this if they were drawn from that probability distribution?" or, in the second case, "How likely is it that we would see two sets of samples like this if they were drawn from the same probability distribution?". It is named after Andrey Kolmogorov and Nikolai Smirnov.
In probability theory, the central limit theorem (CLT) states that, under appropriate conditions, the distribution of a normalized version of the sample mean converges to a standard normal distribution. This holds even if the original variables themselves are not normally distributed. There are several versions of the CLT, each applying in the context of different conditions.

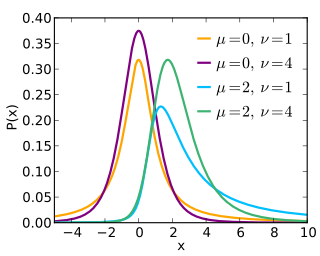
In probability and statistics, Student's t distribution is a continuous probability distribution that generalizes the standard normal distribution. Like the latter, it is symmetric around zero and bell-shaped.

In probability theory, the law of the iterated logarithm describes the magnitude of the fluctuations of a random walk. The original statement of the law of the iterated logarithm is due to A. Ya. Khinchin (1924). Another statement was given by A. N. Kolmogorov in 1929.

In probability theory, the total variation distance is a distance measure for probability distributions. It is an example of a statistical distance metric, and is sometimes called the statistical distance, statistical difference or variational distance.

Directional statistics is the subdiscipline of statistics that deals with directions, axes or rotations in Rn. More generally, directional statistics deals with observations on compact Riemannian manifolds including the Stiefel manifold.

In statistics, an empirical distribution function is the distribution function associated with the empirical measure of a sample. This cumulative distribution function is a step function that jumps up by 1/n at each of the n data points. Its value at any specified value of the measured variable is the fraction of observations of the measured variable that are less than or equal to the specified value.
The noncentral t-distribution generalizes Student's t-distribution using a noncentrality parameter. Whereas the central probability distribution describes how a test statistic t is distributed when the difference tested is null, the noncentral distribution describes how t is distributed when the null is false. This leads to its use in statistics, especially calculating statistical power. The noncentral t-distribution is also known as the singly noncentral t-distribution, and in addition to its primary use in statistical inference, is also used in robust modeling for data.
The Anderson–Darling test is a statistical test of whether a given sample of data is drawn from a given probability distribution. In its basic form, the test assumes that there are no parameters to be estimated in the distribution being tested, in which case the test and its set of critical values is distribution-free. However, the test is most often used in contexts where a family of distributions is being tested, in which case the parameters of that family need to be estimated and account must be taken of this in adjusting either the test-statistic or its critical values. When applied to testing whether a normal distribution adequately describes a set of data, it is one of the most powerful statistical tools for detecting most departures from normality. K-sample Anderson–Darling tests are available for testing whether several collections of observations can be modelled as coming from a single population, where the distribution function does not have to be specified.
In probability theory, an empirical process is a stochastic process that characterizes the deviation of the empirical distribution function from its expectation. In mean field theory, limit theorems are considered and generalise the central limit theorem for empirical measures. Applications of the theory of empirical processes arise in non-parametric statistics.

In probability theory, Donsker's theorem, named after Monroe D. Donsker, is a functional extension of the central limit theorem for empirical distribution functions. Specifically, the theorem states that an appropriately centered and scaled version of the empirical distribution function converges to a Gaussian process.
In statistics the Cramér–von Mises criterion is a criterion used for judging the goodness of fit of a cumulative distribution function compared to a given empirical distribution function , or for comparing two empirical distributions. It is also used as a part of other algorithms, such as minimum distance estimation. It is defined as

In the theory of probability and statistics, the Dvoretzky–Kiefer–Wolfowitz–Massart inequality provides a bound on the worst case distance of an empirically determined distribution function from its associated population distribution function. It is named after Aryeh Dvoretzky, Jack Kiefer, and Jacob Wolfowitz, who in 1956 proved the inequality
In probability theory, the probability integral transform relates to the result that data values that are modeled as being random variables from any given continuous distribution can be converted to random variables having a standard uniform distribution. This holds exactly provided that the distribution being used is the true distribution of the random variables; if the distribution is one fitted to the data, the result will hold approximately in large samples.

In probability and statistics, studentized range distribution is the continuous probability distribution of the studentized range of an i.i.d. sample from a normally distributed population.
In statistics, the Khmaladze transformation is a mathematical tool used in constructing convenient goodness of fit tests for hypothetical distribution functions. More precisely, suppose are i.i.d., possibly multi-dimensional, random observations generated from an unknown probability distribution. A classical problem in statistics is to decide how well a given hypothetical distribution function , or a given hypothetical parametric family of distribution functions , fits the set of observations. The Khmaladze transformation allows us to construct goodness of fit tests with desirable properties. It is named after Estate V. Khmaladze.
Minimum-distance estimation (MDE) is a conceptual method for fitting a statistical model to data, usually the empirical distribution. Often-used estimators such as ordinary least squares can be thought of as special cases of minimum-distance estimation.
In probability theory and statistics, the Dirichlet process (DP) is one of the most popular Bayesian nonparametric models. It was introduced by Thomas Ferguson as a prior over probability distributions.
The ratio of uniforms is a method initially proposed by Kinderman and Monahan in 1977 for pseudo-random number sampling, that is, for drawing random samples from a statistical distribution. Like rejection sampling and inverse transform sampling, it is an exact simulation method. The basic idea of the method is to use a change of variables to create a bounded set, which can then be sampled uniformly to generate random variables following the original distribution. One feature of this method is that the distribution to sample is only required to be known up to an unknown multiplicative factor, a common situation in computational statistics and statistical physics.


