Related Research Articles

The economy of Lebanon has been experiencing a large-scale multi-dimensional crisis since 2019, including a banking collapse, the Lebanese liquidity crisis and a sovereign default. It is classified as a developing, lower-middle-income economy. The nominal GDP was estimated at $19 billion in 2020, with a per capita GDP amounting to $2,500. In 2018 government spending amounted to $15.9 billion, or 23% of GDP.

In finance, speculation is the purchase of an asset with the hope that it will become more valuable shortly. It can also refer to short sales in which the speculator hopes for a decline in value.
An economic bubble is a period when current asset prices greatly exceed their intrinsic valuation, being the valuation that the underlying long-term fundamentals justify. Bubbles can be caused by overly optimistic projections about the scale and sustainability of growth, and/or by the belief that intrinsic valuation is no longer relevant when making an investment. They have appeared in most asset classes, including equities, commodities, real estate, and even esoteric assets. Bubbles usually form as a result of either excess liquidity in markets, and/or changed investor psychology. Large multi-asset bubbles, are attributed to central banking liquidity.

Real estate economics is the application of economic techniques to real estate markets. It tries to describe, explain, and predict patterns of prices, supply, and demand. The closely related field of housing economics is narrower in scope, concentrating on residential real estate markets, while the research on real estate trends focuses on the business and structural changes affecting the industry. Both draw on partial equilibrium analysis, urban economics, spatial economics, basic and extensive research, surveys, and finance.

Tax revenue is the income that is collected by governments through taxation. Taxation is the primary source of government revenue. Revenue may be extracted from sources such as individuals, public enterprises, trade, royalties on natural resources and/or foreign aid. An inefficient collection of taxes is greater in countries characterized by poverty, a large agricultural sector and large amounts of foreign aid.

The 2000s United States housing bubble or house price boom or 2000shousing cycle was a sharp run up and subsequent collapse of house asset prices affecting over half of the U.S. states. In many regions a real estate bubble, it was the impetus for the subprime mortgage crisis. Housing prices peaked in early 2006, started to decline in 2006 and 2007, and reached new lows in 2011. On December 30, 2008, the Case–Shiller home price index reported the largest price drop in its history. The credit crisis resulting from the bursting of the housing bubble is an important cause of the Great Recession in the United States.
A housing bubble is one of several types of asset price bubbles which periodically occur in the market. The basic concept of a housing bubble is the same as for other asset bubbles, consisting of two main phases. First there is a period where house prices increase dramatically, driven more and more by speculation. In the second phase, house prices fall dramatically. Housing bubbles tend to be among the asset bubbles with the largest effect on the real economy, because they are credit-fueled, because a large number of households participate and not just investors, and because the wealth effect from housing tends to be larger than for other types of financial assets.
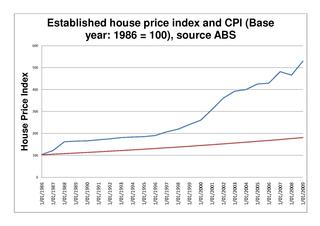
A real-estate bubble or property bubble is a type of economic bubble that occurs periodically in local or global real estate markets, and it typically follows a land boom. A land boom is a rapid increase in the market price of real property such as housing until they reach unsustainable levels and then declines. This period, during the run-up to the crash, is also known as froth. The questions of whether real estate bubbles can be identified and prevented, and whether they have broader macroeconomic significance, are answered differently by schools of economic thought, as detailed below.
In finance, flipping is a term used to describe purchasing an asset and quickly reselling it for profit.

The Japanese asset price bubble was an economic bubble in Japan from 1986 to 1991 in which real estate and stock market prices were greatly inflated. In early 1992, this price bubble burst and Japan's economy stagnated. The bubble was characterized by rapid acceleration of asset prices and overheated economic activity, as well as an uncontrolled money supply and credit expansion. More specifically, over-confidence and speculation regarding asset and stock prices were closely associated with excessive monetary easing policy at the time. Through the creation of economic policies that cultivated the marketability of assets, eased the access to credit, and encouraged speculation, the Japanese government started a prolonged and exacerbated Japanese asset price bubble.

The Spanish property bubble is the collapsed overshooting part of a long-term price increase of Spanish real estate prices. This long-term price increase has happened in various stages from 1985 up to 2008. The housing bubble can be clearly divided in three periods: 1985–1991, in which the price nearly tripled; 1992–1996, in which the price remained somewhat stable; and 1996–2008, in which prices grew astonishingly again. Coinciding with the financial crisis of 2007–08, prices began to fall. In 2013, Raj Badiani, an economist at IHS Global Insight in London, estimated that the value of residential real estate has dropped more than 30 percent since 2007 and that house prices would fall at least 50 percent from the peak by 2015. Alcidi and Gros note; “If construction were to continue at the still relatively high rate of today, the process of absorption of the bubble would take more than 30 years”.

Real estate prices rose drastically from 2002 to 2008 in Poland. Between June 2006 and June 2007 the average price of one square metre of residential area in Warsaw rose from 6,683 PLN to 9,540 PLN, or 50% in euro terms. A peak in prices occurred in autumn 2008 as the average price of a square meter of residential space in Poland started to drop by 5% in nominal terms or 10% per year in real terms.
United States housing prices experienced a major market correction after the housing bubble that peaked in early 2006. Prices of real estate then adjusted downwards in late 2006, causing a loss of market liquidity and subprime defaults.

Observers and analysts have attributed the reasons for the 2001–2006 housing bubble and its 2007–10 collapse in the United States to "everyone from home buyers to Wall Street, mortgage brokers to Alan Greenspan". Other factors that are named include "Mortgage underwriters, investment banks, rating agencies, and investors", "low mortgage interest rates, low short-term interest rates, relaxed standards for mortgage loans, and irrational exuberance" Politicians in both the Democratic and Republican political parties have been cited for "pushing to keep derivatives unregulated" and "with rare exceptions" giving Fannie Mae and Freddie Mac "unwavering support".
The Australian property bubble is the economic theory that the Australian property market has become or is becoming significantly overpriced and due for a significant downturn. Since the early 2010s, various commentators, including one Treasury official, have claimed the Australian property market is in a significant bubble.

The 2005 Chinese property bubble was a real estate bubble in residential and commercial real estate in China. The New York Times reported that the bubble started to deflate in 2011, while observing increased complaints that members of the middle-class were unable to afford homes in large cities. The deflation of the property bubble is seen as one of the primary causes for China's declining economic growth in 2013.
Real estate in China is developed and managed by public, private, and state-owned red chip enterprises.
The Alabama real estate bubble of the 1810s was a real estate bubble centered on Huntsville, caused by increasing cotton prices resulting from demand from English textile manufacturers, relatively high cotton yields in Alabama, as well as general speculation. In 1817, property in Madison County sold for around $2 per acre, while in 1818 it sold for $7.40 per acre on average, with some tracts reportedly sold "at prices ranging from $20 to $78 per acre," at a time when land on the American frontier was sold for $2 per acre. By 1819, acreage prices plummeted to around $0.20 per acre due to the Panic of 1819 and increasing global supply of cotton.
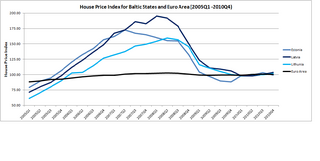
The Baltic states' housing bubble was an economic bubble involving major cities in Estonia, Latvia and Lithuania. The three Baltic countries had enjoyed a relatively strong economic growth between 2000 and 2006, and the real estate sectors had performed well since 2000. In fact, in between 2005Q1 and 2007Q1, the official house price index for Estonia, Latvia and Lithuania recorded a sharp jump of 104.6%, 134.3% and 106.7%. By comparison, the official house price index for Euro Area increased by 11.8% for a similar time period.
The Canadian property bubble refers to a significant rise in Canadian real estate prices from 2002 to present which some observers have called a real estate bubble. The Dallas Federal Reserve rated Canadian real estate as "exuberant" beginning in 2003. From 2003 to 2018, Canada saw an increase in home and property prices of up to 337% in some cities. In 2016, the OECD warned that Canada's financial stability was at risk due to elevated housing prices, investment and household debt. By 2018, home-owning costs were above 1990 levels when Canada saw its last housing bubble burst. Bloomberg Economics ranked Canada as the second largest housing bubble across the OECD in 2019 and 2021. Toronto scored the highest in the world in Swiss bank UBS' real estate bubble index in 2022, with Vancouver also scoring among the 10 riskiest cities in the world. The Royal Bank of Canada analysis showed that Canadian housing had become the least affordable that it had ever been. By 2023 Canada’s nonfinancial debt exceeded 300% of GDP and household debt surpassed 100% of GDP, both higher than the levels seen in the United States before the 2008 global financial crisis. Canada's housing investment as a percentage of GDP ratio peaked at 8.9% in 2022, whereas the US at the peak of the housing bubble only reached 7% in 2006.
References
- ↑ "World Bank, World Development Indicators - Google Public Data Explorer". www.google.com.
- ↑ Halawi, Dana (February 26, 2010). "Salameh rules out any real estate bubble". The Daily Star Lebanon. Archived from the original on 2010-02-28. Retrieved 2022-11-28.
- ↑ "Lebanon". Central Intelligence Agency. November 16, 2022 – via CIA.gov.
- ↑ "Lebanon news - NOW Lebanon -Beirut real estate boom is no bubble". www.nowlebanon.com. Archived from the original on 2011-04-19.