Little Science, Big Science

Last updated

Little Science, Big Science is a book of collected lectures given by Derek J. De Solla Price, first published in 1963. The book presents the 1962 Brookhaven National Laboratory Pegram Lectures, a series of lectures dedicated to discussing science and its place in society. Price's goal in the lectures is to outline what it may look like for science to be analysed scientifically, by applying methods of measuring, hypothesizing, and deriving to science itself. With this goal in mind, he sets out to define quasi-mathematically how the shape and size of science has shifted from "small science" to "big science" in a historical and sociological way. Price presents a quantification of science as a measurable entity via an analogy to thermodynamics, conceptualizing science like a gas with individual molecules possessing individual velocities and interactions, a total volume, and general properties or laws.

Contents

Prologue to a Science of Science

Price begins the lectures by setting forth a demarcation in science centered around the modern period. He describes the phenomenon that, at the time of the lectures, 80 to 90 percent of important scientific work had occurred in one normal human life span. [1] With this facet in mind, he sets out to describe the development of the term "Big Science," as coined by Alvin M. Weinberg in 1961. [2] As a general directive, he seeks to show that the transition from "Little Science" to "Big Science," specifically the socio-economic and methodological changes to science in the 20th century, have been mostly gradual. To illustrate this point, he presents empirical statistical evidence from various aspects and fields of science, all of which show that the mode of growth of science is exponential, growing at compound interest. This assertion Price claims is the "fundamental law of any analysis of science," stating that it even holds accurately over long time periods. With this fundamental law in mind, he states that for general measures the size of science in manpower or number of publications doubles in size every 10 to 15 years. If this rate of expansion is considered broadly, then from the 1600s until now such size measures of science have increased by a factor of 106. [3] From this observation, Price moves to describe the "coefficient of immediacy:" the number of scientists alive compared to the number of scientists who have ever been, a ratio or percentage he states as 7:8 and 87.5% respectively. This measure serves to show numerically how the majority of important science has taken place within the average human life span at the time of the lecture presentation. As a result of the consistent exponential growth rate and immediacy of science, the statement that the majority of scientists throughout history are alive at any given moment must be consistent throughout history as well, meaning that in 1700 the majority of all scientists ever were alive, true also for 1800 and 1900 and so on. [4] As a result of this facet, Price states that science has been constantly exploding into the population, increasing its size at a rate faster than the increase of total humans able to conduct it.

However, Price asserts that this exponential growth rate cannot simply explain the transition from "Little Science" to "Big Science," as the constant growth would not make the modern period under question any more likely to produce "Big Science" than any other. He conjectures that two statistical phenomena hold true for science generally, that individual metrics of science may grow at rates different from that of the exponential growth, and that the exponential growth rate may be starting to diminish. [5] In response to his second point, he claims that the normal exponential growth may give way to a logistic growth rate, growing exponentially until it reaches a maximum size and then ceasing to grow. The possibility that science follows a rate of growth modeled by a logistic curve is suggested further by the fact that if science had continued to grow at an exponential rate in 1962, then by now there would be more scientists than people. With his claim that the growth rate actually observes a logistic curve, he provides a second basic law of the analysis of science, namely that the exponential growth rates previously mentioned must be in fact logistic. [6] If this claim is correct, then the exponential growth rate previously observed must break down at a point in the future, and Price implies as a conclusion to this section that the onset of this breakdown may be associated with an upper bound to the size of science brought on by "Big Science." [7]

Galton Revisited

In this chapter, Price suggests various ideas and methods about conducting a science of science, or scientometrics, by first narrating some peculiar contributions to statistics made by Francis Galton. His overall goal is to further the possibility of applying scientific methods to science itself by suggesting various metrics and measures of the size, growth rate, and distribution of science. He focuses on Galton's work concerning the distribution of high achieving scientists and statesmen in the upper echelons of British society, specifically Hereditary Genius and English Men of Science. [8] These works are reviewed with the goal of understanding a basic metric for the number of people or papers in science that reach different levels of quality, an idea basic in Price's formulation of scientometrics. Further, he suggests that understanding such a metric would allow predictions to be made of science and scientists when changes associated with Big Science arrive. Galton's original approach was to estimate the distribution of high achieving practitioners of science among the eminent parts of British society, and Price takes this as a starting step in grasping a scientific metric of the productivity of science. In analyzing Galton's work and the work of another statistics researcher, Alfred J. Lotka, Price suggests that there may be a rough inverse-square law of productivity. [9] Price moves next to define a quantity he calls someone's "solidness" s, as the logarithm of the total papers published in one scientist's life. Keeping in mind the previous productivity law, for each unit increase in a scientist's solidness, the total number of scientists of that solidness decreases at a constant rate. [10] With these two observations, among others, Price asserts that the foundations for an econometric-like study of science have been suggested, with the analysis of time series suggesting exponential or logistic growth and the distribution law of scientific productivity comprising them. He concludes by suggesting that these distributions and analyses contain errors relating to the non-uniform distribution of scientists across populations, noting that they tend to congregate in certain fields, institutions, countries, and journals. In keeping with his gas analogy, he maintains that just as one cannot measure the exact positions and velocities of gas molecules, one cannot pinpoint the exact productivity or contribution levels of individual scientists within science.

Invisible Colleges and the Affluent Scientific Commuter

This chapter serves multiple purposes but overall achieves the same goal as the previous, providing a further conception of the productivity measure in science. This conclusion is reached through defining historically, sociologically, and from a communications perspective what a scientific paper is for, specifically what the purpose of this form of scientific communication is. To begin this analysis, he begins by looking at the history of the scientific paper, tracing its original purpose to discovering what was of interest within scientific practice. [11] With the emergence of this scientific social practice, seen not as a means of publishing new knowledge but of communication between practitioners, the process of situating papers within the general body of literature came in to play. Specifically, each scientific paper is built from the foundation created by all previous papers, and with this facet exists a possibility of quantifying this foundation, the citation of references. [12] [13] [14] With the idea that scientific papers were a social device of scientific communication, Price suggests that the driving force behind their emergent usage was the ability to assert and claim intellectual property within science. The possibility of communicating priority in disputes over scientific discoveries promoted the scientific paper as the best means of communication, leaving the information dissemination quality of papers as incidental in their overall purpose. [15] With the quantification of scientific productivity by citation number and rate, there arrives a metric in science that gives the scientific importance of an individual's work or journal as its total usage within scientific practice, its total citations or references in other papers or journals. With this in mind, Price observes the fact that the total number of scientific references at a specific date across science is proportional to the total literature available within science at that date. [16]

Moving from the ability of scientific papers to facilitate communication and interactions between scientists, Price outlines an idea that allows further maximization of interactions between scientists. His term for this organizational method is the "invisible college," specifically the circuit of institutions, research centers, journals, and conferences that allow intermingling and interactions within specific fields of science. [17] Groups of scientists naturally form as a result of collaborations between individuals focusing on similar problems, but the ability for researchers to move around the globe in order to achieve interpersonal relationships with their fellow researchers is what Price suggests maximizes the group size able to keep up regular productive interactions. Thus Price defines the sociological structure of scientific practice communicating through published papers.

Political Strategy for Big Scientists

The final section of the lectures focuses on a larger-picture analysis of science and the monetary trends within it. As a general first statement, Price proposes that the cost of science has been increasing proportional to the square of the number of scientists. [18] He points out that the cost of research in terms of the GDP did not increase in the years preceding World War II, yet afterward began increasing at the rate previously mentioned. As research amounts increase, the current and necessary number of researchers increases, promoting the inducement of scientists with higher salaries and better facilities in turn increasing the overall costs of science. Price suggests that it is this feedback loop that is a potential decelerator for the growth of science, and the main difference between Little Science and Big Science. [19] What follows is his analysis of the "explosion of science" within non-developed countries, specifically Japan. He shows through this analysis that the United States' lack of experience of this explosion of science within the 20th century up to this point is due to the saturation of society with the activities of science, nearing costs not maintainable by the country. In countries where science has not yet reached an exponential growth curve, this saturation is not present, which allows the growth rate to set out at an exponential pace.

The final conceptual measure that Price offers is the idea of the "mavericity" of a scientist, or the likelihood that an individual will test new and unique combinations of theories and experiments unexpected in the current literature. [20] The reactions and interactions within science to this mavericity also characterizes Big Science over Little Science, where the former serves to limit and restrain the most maverick investigators due to collaborative work and specific directed goals for scientific research. Thus the emergence of Big Science not only influences the growth rate, connectedness, and significance of science, but also the individual facets of the scientific pursuit.

Related Research Articles

Complexity characterises the behaviour of a system or model whose components interact in multiple ways and follow local rules, leading to non-linearity, randomness, collective dynamics, hierarchy, and emergence.

The carrying capacity of an environment is the maximum population size of a biological species that can be sustained by that specific environment, given the food, habitat, water, and other resources available. The carrying capacity is defined as the environment's maximal load, which in population ecology corresponds to the population equilibrium, when the number of deaths in a population equals the number of births. The effect of carrying capacity on population dynamics is modelled with a logistic function. Carrying capacity is applied to the maximum population an environment can support in ecology, agriculture and fisheries. The term carrying capacity has been applied to a few different processes in the past before finally being applied to population limits in the 1950s. The notion of carrying capacity for humans is covered by the notion of sustainable population.

<i>The Limits to Growth</i> 1972 book on economic and population growth

The Limits to Growth (LTG) is a 1972 report that discussed the possibility of exponential economic and population growth with finite supply of resources, studied by computer simulation. The study used the World3 computer model to simulate the consequence of interactions between the Earth and human systems. The model was based on the work of Jay Forrester of MIT, as described in his book World Dynamics.

<span class="mw-page-title-main">Economic growth</span> Measure of increase in market value of goods

Economic growth can be defined as the increase or improvement in the inflation-adjusted market value of the goods and services produced by an economy in a financial year. Statisticians conventionally measure such growth as the percent rate of increase in the real and nominal gross domestic product (GDP).

<span class="mw-page-title-main">Logistic function</span> S-shaped curve

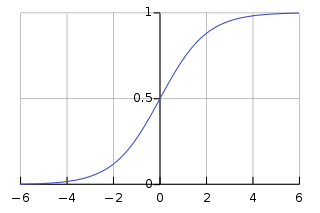
A logistic function or logistic curve is a common S-shaped curve with the equation

<span class="mw-page-title-main">Exponential growth</span> Growth of quantities at rate proportional to the current amount

Exponential growth is a process that increases quantity over time at an ever-increasing rate. It occurs when the instantaneous rate of change of a quantity with respect to time is proportional to the quantity itself. Described as a function, a quantity undergoing exponential growth is an exponential function of time, that is, the variable representing time is the exponent. Exponential growth is the inverse of logarithmic growth.

Productivity is the efficiency of production of goods or services expressed by some measure. Measurements of productivity are often expressed as a ratio of an aggregate output to a single input or an aggregate input used in a production process, i.e. output per unit of input, typically over a specific period of time. The most common example is the (aggregate) labour productivity measure, one example of which is GDP per worker. There are many different definitions of productivity and the choice among them depends on the purpose of the productivity measurement and data availability. The key source of difference between various productivity measures is also usually related to how the outputs and the inputs are aggregated to obtain such a ratio-type measure of productivity.

<span class="mw-page-title-main">Hubbert peak theory</span> One of the primary theories on peak oil

The Hubbert peak theory says that for any given geographical area, from an individual oil-producing region to the planet as a whole, the rate of petroleum production tends to follow a bell-shaped curve. It is one of the primary theories on peak oil.

<span class="mw-page-title-main">Population ecology</span> Study of the dynamics of species populations and how these populations interact with the environment

Population ecology is a sub-field of ecology that deals with the dynamics of species populations and how these populations interact with the environment, such as birth and death rates, and by immigration and emigration.

<span class="mw-page-title-main">Bibliometrics</span> Statistical analysis of written publications

Bibliometrics is the use of statistical methods to analyse books, articles and other publications, especially in scientific contents. Bibliometric methods are frequently used in the field of library and information science. Bibliometrics is closely associated with scientometrics, the analysis of scientific metrics and indicators, to the point that both fields largely overlap.

<span class="mw-page-title-main">Derek J. de Solla Price</span> Historian of Science

Derek John de Solla Price was a British physicist, historian of science, and information scientist. He was known for his investigation of the Antikythera mechanism, an ancient Greek planetary computer, and for quantitative studies on scientific publications, which led to his being described as the "Herald of scientometrics".

Scientometrics is the field of study which concerns itself with measuring and analysing scholarly literature. Scientometrics is a sub-field of informetrics. Major research issues include the measurement of the impact of research papers and academic journals, the understanding of scientific citations, and the use of such measurements in policy and management contexts. In practice there is a significant overlap between scientometrics and other scientific fields such as information systems, information science, science of science policy, sociology of science, and metascience. Critics have argued that over-reliance on scientometrics has created a system of perverse incentives, producing a publish or perish environment that leads to low-quality research.

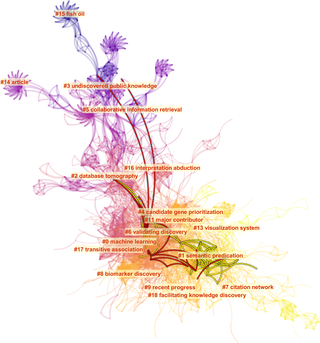
Citation analysis is the examination of the frequency, patterns, and graphs of citations in documents. It uses the directed graph of citations — links from one document to another document — to reveal properties of the documents. A typical aim would be to identify the most important documents in a collection. A classic example is that of the citations between academic articles and books. For another example, judges of law support their judgements by referring back to judgements made in earlier cases. An additional example is provided by patents which contain prior art, citation of earlier patents relevant to the current claim. The digitization of patent data and increasing computing power have led to a community of practice that uses these citation data to measure innovation attributes, trace knowledge flows, and map innovation networks.

<span class="mw-page-title-main">Informetrics</span> Study of the quantitative aspects of information

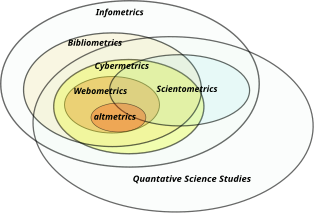
Informetrics is the study of quantitative aspects of information, it is an extension and evolution of traditional bibliometrics and scientometrics. Informetrics uses bibliometrics and scientometrics methods to study mainly the problems of literature information management and evaluation of science and technology. Informetrics is an independent discipline that uses quantitative methods from mathematics and statistics to study the process, phenomena, and law of informetrics. Informetrics has gained more attention as it is a common scientific method for academic evaluation, research hotspots in discipline, and trend analysis.

<span class="mw-page-title-main">Intraspecific competition</span> Species members compete for resources

Intraspecific competition is an interaction in population ecology, whereby members of the same species compete for limited resources. This leads to a reduction in fitness for both individuals, but the more fit individual survives and is able to reproduce. By contrast, interspecific competition occurs when members of different species compete for a shared resource. Members of the same species have rather similar requirements for resources, whereas different species have a smaller contested resource overlap, resulting in intraspecific competition generally being a stronger force than interspecific competition.

Citation impact or citation rate is a measure of how many times an academic journal article or book or author is cited by other articles, books or authors. Citation counts are interpreted as measures of the impact or influence of academic work and have given rise to the field of bibliometrics or scientometrics, specializing in the study of patterns of academic impact through citation analysis. The importance of journals can be measured by the average citation rate, the ratio of number of citations to number articles published within a given time period and in a given index, such as the journal impact factor or the citescore. It is used by academic institutions in decisions about academic tenure, promotion and hiring, and hence also used by authors in deciding which journal to publish in. Citation-like measures are also used in other fields that do ranking, such as Google's PageRank algorithm, software metrics, college and university rankings, and business performance indicators.

The h-index is an author-level metric that measures both the productivity and citation impact of the publications, initially used for an individual scientist or scholar. The h-index correlates with success indicators such as winning the Nobel Prize, being accepted for research fellowships and holding positions at top universities. The index is based on the set of the scientist's most cited papers and the number of citations that they have received in other publications. The index has more recently been applied to the productivity and impact of a scholarly journal as well as a group of scientists, such as a department or university or country. The index was suggested in 2005 by Jorge E. Hirsch, a physicist at UC San Diego, as a tool for determining theoretical physicists' relative quality and is sometimes called the Hirsch index or Hirsch number.

<span class="mw-page-title-main">Population dynamics of fisheries</span>

A fishery is an area with an associated fish or aquatic population which is harvested for its commercial or recreational value. Fisheries can be wild or farmed. Population dynamics describes the ways in which a given population grows and shrinks over time, as controlled by birth, death, and migration. It is the basis for understanding changing fishery patterns and issues such as habitat destruction, predation and optimal harvesting rates. The population dynamics of fisheries is used by fisheries scientists to determine sustainable yields.

The Eigenfactor score, developed by Jevin West and Carl Bergstrom at the University of Washington, is a rating of the total importance of a scientific journal. Journals are rated according to the number of incoming citations, with citations from highly ranked journals weighted to make a larger contribution to the eigenfactor than those from poorly ranked journals. As a measure of importance, the Eigenfactor score scales with the total impact of a journal. All else equal, journals generating higher impact to the field have larger Eigenfactor scores. Citation metrics like eigenfactor or PageRank-based scores reduce the effect of self-referential groups.

Author-level metrics are citation metrics that measure the bibliometric impact of individual authors, researchers, academics, and scholars. Many metrics have been developed that take into account varying numbers of factors.

References

  1. de Solla Price, Derek J. (1963). Little Science, Big Science. New York: Columbia University Press.
  2. Weinberg, Alvin M. (1961). "Impact of Large-Scale Science on the United States". Science. 134 (3473): 161. Bibcode:1961Sci...134..161W. doi:10.1126/science.134.3473.161.
  3. Price. Science. p. 8.
  4. Price. Science. p. 14.
  5. Price. Science. p. 19.
  6. Price. Science. p. 30.
  7. Price. Science. p. 32.
  8. Price. Science. p. 34.
  9. Price. Science. p. 43.
  10. Price. Science. p. 50.
  11. Price. Science. p. 63.
  12. Price. Science. p. 65.
  13. de Solla Price, Derek J. (1986). Little Science, Big Science, and Beyond. New York: Columbia University Press. p. 155.
  14. de Solla Price, Derek (1965). "Networks of Scientific Papers". Science. 149 (3683): 510. Bibcode:1965Sci...149..510D. doi:10.1126/science.149.3683.510.
  15. Merton, Robert K. (1957). "Priorities in Scientific Discovery: a chapter in the sociology of science". American Sociological Review. 22 (6): 635–659. doi:10.2307/2089193. JSTOR   2089193.
  16. Price. Science. p. 81.
  17. Price. Science. p. 85.
  18. Price. Science. p. 92.
  19. Price. Science. p. 94.
  20. Price. Science. p. 107.