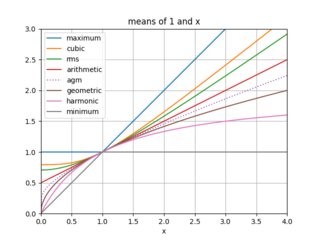
In mathematics, the arithmetic–geometric mean of two positive real numbers x and y is the mutual limit of a sequence of arithmetic means and a sequence of geometric means. The arithmetic–geometric mean is used in fast algorithms for exponential, trigonometric functions, and other special functions, as well as some mathematical constants, in particular, computing π.

Bessel functions, first defined by the mathematician Daniel Bernoulli and then generalized by Friedrich Bessel, are canonical solutions y(x) of Bessel's differential equation
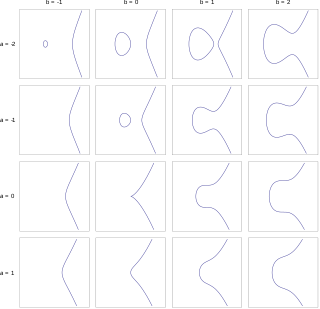
In mathematics, an elliptic curve is a smooth, projective, algebraic curve of genus one, on which there is a specified point O. An elliptic curve is defined over a field K and describes points in K2, the Cartesian product of K with itself. If the field's characteristic is different from 2 and 3, then the curve can be described as a plane algebraic curve which consists of solutions (x, y) for:

The natural logarithm of a number is its logarithm to the base of the mathematical constant e, which is an irrational and transcendental number approximately equal to 2.718281828459. The natural logarithm of x is generally written as ln x, logex, or sometimes, if the base e is implicit, simply log x. Parentheses are sometimes added for clarity, giving ln(x), loge(x), or log(x). This is done particularly when the argument to the logarithm is not a single symbol, so as to prevent ambiguity.

In probability theory and statistics, the exponential distribution or negative exponential distribution is the probability distribution of the distance between events in a Poisson point process, i.e., a process in which events occur continuously and independently at a constant average rate; the distance parameter could be any meaningful mono-dimensional measure of the process, such as time between production errors, or length along a roll of fabric in the weaving manufacturing process. It is a particular case of the gamma distribution. It is the continuous analogue of the geometric distribution, and it has the key property of being memoryless. In addition to being used for the analysis of Poisson point processes it is found in various other contexts.

In probability theory, a log-normal (or lognormal) distribution is a continuous probability distribution of a random variable whose logarithm is normally distributed. Thus, if the random variable X is log-normally distributed, then Y = ln(X) has a normal distribution. Equivalently, if Y has a normal distribution, then the exponential function of Y, X = exp(Y), has a log-normal distribution. A random variable which is log-normally distributed takes only positive real values. It is a convenient and useful model for measurements in exact and engineering sciences, as well as medicine, economics and other topics (e.g., energies, concentrations, lengths, prices of financial instruments, and other metrics).
In probability theory, Chebyshev's inequality provides an upper bound on the probability of deviation of a random variable from its mean. More specifically, the probability that a random variable deviates from its mean by more than is at most , where is any positive constant and is the standard deviation.

In probability theory and statistics, the beta distribution is a family of continuous probability distributions defined on the interval [0, 1] or in terms of two positive parameters, denoted by alpha (α) and beta (β), that appear as exponents of the variable and its complement to 1, respectively, and control the shape of the distribution.

In probability theory and statistics, the gamma distribution is a versatile two-parameter family of continuous probability distributions. The exponential distribution, Erlang distribution, and chi-squared distribution are special cases of the gamma distribution. There are two equivalent parameterizations in common use:
- With a shape parameter k and a scale parameter θ
- With a shape parameter and an inverse scale parameter , called a rate parameter.
In mathematical physics, n-dimensional de Sitter space is a maximally symmetric Lorentzian manifold with constant positive scalar curvature. It is the Lorentzian analogue of an n-sphere.

In mathematics, the inverse trigonometric functions are the inverse functions of the trigonometric functions. Specifically, they are the inverses of the sine, cosine, tangent, cotangent, secant, and cosecant functions, and are used to obtain an angle from any of the angle's trigonometric ratios. Inverse trigonometric functions are widely used in engineering, navigation, physics, and geometry.

In mathematics, the inequality of arithmetic and geometric means, or more briefly the AM–GM inequality, states that the arithmetic mean of a list of non-negative real numbers is greater than or equal to the geometric mean of the same list; and further, that the two means are equal if and only if every number in the list is the same.
In probability theory and statistics, the generalized extreme value (GEV) distribution is a family of continuous probability distributions developed within extreme value theory to combine the Gumbel, Fréchet and Weibull families also known as type I, II and III extreme value distributions. By the extreme value theorem the GEV distribution is the only possible limit distribution of properly normalized maxima of a sequence of independent and identically distributed random variables. Note that a limit distribution needs to exist, which requires regularity conditions on the tail of the distribution. Despite this, the GEV distribution is often used as an approximation to model the maxima of long (finite) sequences of random variables.
Expected shortfall (ES) is a risk measure—a concept used in the field of financial risk measurement to evaluate the market risk or credit risk of a portfolio. The "expected shortfall at q% level" is the expected return on the portfolio in the worst of cases. ES is an alternative to value at risk that is more sensitive to the shape of the tail of the loss distribution.
A ratio distribution is a probability distribution constructed as the distribution of the ratio of random variables having two other known distributions. Given two random variables X and Y, the distribution of the random variable Z that is formed as the ratio Z = X/Y is a ratio distribution.
In financial mathematics, tail value at risk (TVaR), also known as tail conditional expectation (TCE) or conditional tail expectation (CTE), is a risk measure associated with the more general value at risk. It quantifies the expected value of the loss given that an event outside a given probability level has occurred.

In general relativity, a point mass deflects a light ray with impact parameter by an angle approximately equal to

In probability theory and statistics, the Poisson distribution is a discrete probability distribution that expresses the probability of a given number of events occurring in a fixed interval of time if these events occur with a known constant mean rate and independently of the time since the last event. It can also be used for the number of events in other types of intervals than time, and in dimension greater than 1.
A product distribution is a probability distribution constructed as the distribution of the product of random variables having two other known distributions. Given two statistically independent random variables X and Y, the distribution of the random variable Z that is formed as the product is a product distribution.
In mathematical analysis and its applications, a function of several real variables or real multivariate function is a function with more than one argument, with all arguments being real variables. This concept extends the idea of a function of a real variable to several variables. The "input" variables take real values, while the "output", also called the "value of the function", may be real or complex. However, the study of the complex-valued functions may be easily reduced to the study of the real-valued functions, by considering the real and imaginary parts of the complex function; therefore, unless explicitly specified, only real-valued functions will be considered in this article.


