
Climate is the long-term weather pattern in a region, typically averaged over 30 years. More rigorously, it is the mean and variability of meteorological variables over a time spanning from months to millions of years. Some of the meteorological variables that are commonly measured are temperature, humidity, atmospheric pressure, wind, and precipitation. In a broader sense, climate is the state of the components of the climate system, including the atmosphere, hydrosphere, cryosphere, lithosphere and biosphere and the interactions between them. The climate of a location is affected by its latitude, longitude, terrain, altitude, land use and nearby water bodies and their currents.
Meteorology is a branch of the atmospheric sciences with a major focus on weather forecasting. The study of meteorology dates back millennia, though significant progress in meteorology did not begin until the 18th century. The 19th century saw modest progress in the field after weather observation networks were formed across broad regions. Prior attempts at prediction of weather depended on historical data. It was not until after the elucidation of the laws of physics, and more particularly in the latter half of the 20th century, the development of the computer that significant breakthroughs in weather forecasting were achieved. An important branch of weather forecasting is marine weather forecasting as it relates to maritime and coastal safety, in which weather effects also include atmospheric interactions with large bodies of water.
Weather is the state of the atmosphere, describing for example the degree to which it is hot or cold, wet or dry, calm or stormy, clear or cloudy. On Earth, most weather phenomena occur in the lowest layer of the planet's atmosphere, the troposphere, just below the stratosphere. Weather refers to day-to-day temperature, precipitation, and other atmospheric conditions, whereas climate is the term for the averaging of atmospheric conditions over longer periods of time. When used without qualification, "weather" is generally understood to mean the weather of Earth.
Surface weather analysis is a special type of weather map that provides a view of weather elements over a geographical area at a specified time based on information from ground-based weather stations.

Climatology or climate science is the scientific study of Earth's climate, typically defined as weather conditions averaged over a period of at least 30 years. Climate concerns the atmospheric condition during an extended to indefinite period of time; weather is the condition of the atmosphere during a relative brief period of time. The main topics of research are the study of climate variability, mechanisms of climate changes and modern climate change. This topic of study is regarded as part of the atmospheric sciences and a subdivision of physical geography, which is one of the Earth sciences. Climatology includes some aspects of oceanography and biogeochemistry.

A weather satellite or meteorological satellite is a type of Earth observation satellite that is primarily used to monitor the weather and climate of the Earth. Satellites can be polar orbiting, or geostationary.

The National Weather Service (NWS) is an agency of the United States federal government that is tasked with providing weather forecasts, warnings of hazardous weather, and other weather-related products to organizations and the public for the purposes of protection, safety, and general information. It is a part of the National Oceanic and Atmospheric Administration (NOAA) branch of the Department of Commerce, and is headquartered in Silver Spring, Maryland, within the Washington metropolitan area. The agency was known as the United States Weather Bureau from 1890 until it adopted its current name in 1970.
A weather map, also known as synoptic weather chart, displays various meteorological features across a particular area at a particular point in time and has various symbols which all have specific meanings. Such maps have been in use since the mid-19th century and are used for research and weather forecasting purposes. Maps using isotherms show temperature gradients, which can help locate weather fronts. Isotach maps, analyzing lines of equal wind speed, on a constant pressure surface of 300 or 250 hPa show where the jet stream is located. Use of constant pressure charts at the 700 and 500 hPa level can indicate tropical cyclone motion. Two-dimensional streamlines based on wind speeds at various levels show areas of convergence and divergence in the wind field, which are helpful in determining the location of features within the wind pattern. A popular type of surface weather map is the surface weather analysis, which plots isobars to depict areas of high pressure and low pressure. Cloud codes are translated into symbols and plotted on these maps along with other meteorological data that are included in synoptic reports sent by professionally trained observers.

METAR is a format for reporting weather information. A METAR weather report is predominantly used by aircraft pilots, and by meteorologists, who use aggregated METAR information to assist in weather forecasting. Today, according to the advancement of technology in civil aviation, the METAR is sent as IWXXM model.

A contour line of a function of two variables is a curve along which the function has a constant value, so that the curve joins points of equal value. It is a plane section of the three-dimensional graph of the function parallel to the -plane. More generally, a contour line for a function of two variables is a curve connecting points where the function has the same particular value.
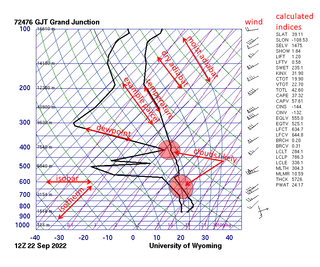
A skew-T log-P diagram is one of four thermodynamic diagrams commonly used in weather analysis and forecasting. In 1947, N. Herlofson proposed a modification to the emagram that allows straight, horizontal isobars and provides for a large angle between isotherms and dry adiabats, similar to that in the tephigram. It was thus more suitable for some of the newer analysis techniques being invented by the United States Air Force.
A pressure system is a peak or lull in the sea level pressure distribution. The surface pressure at sea level varies minimally, with the lowest value measured 87 kilopascals (26 inHg) and the highest recorded 108.57 kilopascals (32.06 inHg). High- and low-pressure systems evolve due to interactions of temperature differentials in the atmosphere, temperature differences between the atmosphere and water within oceans and lakes, the influence of upper-level disturbances, as well as the amount of solar heating or radiationized cooling an area receives. Pressure systems cause weather to be experienced locally. Low-pressure systems are associated with clouds and precipitation that minimize temperature changes throughout the day, whereas high-pressure systems normally associate with dry weather and mostly clear skies with larger diurnal temperature changes due to greater radiation at night and greater sunshine during the day. Pressure systems are analyzed by those in the field of meteorology within surface weather maps.
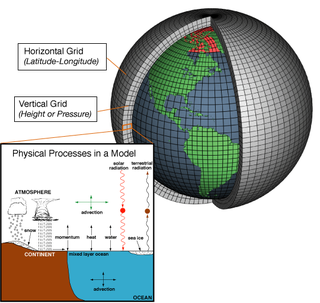
Numerical weather prediction (NWP) uses mathematical models of the atmosphere and oceans to predict the weather based on current weather conditions. Though first attempted in the 1920s, it was not until the advent of computer simulation in the 1950s that numerical weather predictions produced realistic results. A number of global and regional forecast models are run in different countries worldwide, using current weather observations relayed from radiosondes, weather satellites and other observing systems as inputs.
This is a list of meteorology topics. The terms relate to meteorology, the interdisciplinary scientific study of the atmosphere that focuses on weather processes and forecasting.
The National Severe Storms Laboratory (NSSL) is a National Oceanic and Atmospheric Administration (NOAA) weather research laboratory under the Office of Oceanic and Atmospheric Research. It is one of seven NOAA Research Laboratories (RLs).

The following outline is provided as an overview of and topical guide to the field of Meteorology.

Surface weather observations are the fundamental data used for safety as well as climatological reasons to forecast weather and issue warnings worldwide. They can be taken manually, by a weather observer, by computer through the use of automated weather stations, or in a hybrid scheme using weather observers to augment the otherwise automated weather station. The ICAO defines the International Standard Atmosphere (ISA), which is the model of the standard variation of pressure, temperature, density, and viscosity with altitude in the Earth's atmosphere, and is used to reduce a station pressure to sea level pressure. Airport observations can be transmitted worldwide through the use of the METAR observing code. Personal weather stations taking automated observations can transmit their data to the United States mesonet through the Citizen Weather Observer Program (CWOP), the UK Met Office through their Weather Observations Website (WOW), or internationally through the Weather Underground Internet site. A thirty-year average of a location's weather observations is traditionally used to determine the station's climate. In the US a network of Cooperative Observers make a daily record of summary weather and sometimes water level information.
The Oklahoma Mesonet is a network of environmental monitoring stations designed to measure the environment at the size and duration of mesoscale weather events. The phrase "mesonet" is a portmanteau of the words mesoscale and network.
The following is a glossary of tornado terms. It includes scientific as well as selected informal terminology.
This glossary of meteorology is a list of terms and concepts relevant to meteorology and atmospheric science, their sub-disciplines, and related fields.
