Wind speed

Last updated
An anemometer is commonly used to measure wind speed. Weather Station at Feilding Waste Water Treatment Plant.JPG
An anemometer is commonly used to measure wind speed.
Global distribution of wind speed at 10m above ground averaged over the years 1981-2010 from the CHELSA-BIOCLIM+ data set Wind wiki.png
Global distribution of wind speed at 10m above ground averaged over the years 1981–2010 from the CHELSA-BIOCLIM+ data set

In meteorology, wind speed, or wind flow speed, is a fundamental atmospheric quantity caused by air moving from high to low pressure, usually due to changes in temperature. Wind speed is now commonly measured with an anemometer.

Contents

Wind speed affects weather forecasting, aviation and maritime operations, construction projects, growth and metabolism rate of many plant species, and has countless other implications. [2] Wind direction is usually almost parallel to isobars (and not perpendicular, as one might expect), due to Earth's rotation.

Units

The metre per second (m/s) is the SI unit for velocity and the unit recommended by the World Meteorological Organization for reporting wind speeds, and is amongst others used in weather forecasts in the Nordic countries. [3] Since 2010 the International Civil Aviation Organization (ICAO) also recommends meters per second for reporting wind speed when approaching runways, replacing their former recommendation of using kilometres per hour (km/h). [4]

For historical reasons, other units such as miles per hour (mph), knots (kn) [5] or feet per second (ft/s) are also sometimes used to measure wind speeds. Historically, wind speeds have also been classified using the Beaufort scale, which is based on visual observations of specifically defined wind effects at sea or on land.

Factors affecting wind speed

Wind speed is affected by a number of factors and situations, operating on varying scales (from micro to macro scales). These include the pressure gradient, Rossby waves and jet streams, and local weather conditions. There are also links to be found between wind speed and wind direction, notably with the pressure gradient and terrain conditions.

Pressure gradient is a term to describe the difference in air pressure between two points in the atmosphere or on the surface of the Earth. It is vital to wind speed, because the greater the difference in pressure, the faster the wind flows (from the high to low pressure) to balance out the variation. The pressure gradient, when combined with the Coriolis effect and friction, also influences wind direction.

Rossby waves are strong winds in the upper troposphere. These operate on a global scale and move from West to East (hence being known as Westerlies). The Rossby waves are themselves a different wind speed from what we experience in the lower troposphere.

Local weather conditions play a key role in influencing wind speed, as the formation of hurricanes, monsoons and cyclones as freak weather conditions can drastically affect the flow velocity of the wind.[ citation needed ]

Highest speed

The original anemometer that measured The Big Wind in 1934 at Mount Washington Observatory The Big Wind Anemometer.JPG
The original anemometer that measured The Big Wind in 1934 at Mount Washington Observatory

Non-tornadic

The fastest wind speed not related to tornadoes ever recorded was during the passage of Tropical Cyclone Olivia on 10 April 1996: an automatic weather station on Barrow Island, Australia, registered a maximum wind gust of 113.3 m/s (408 km/h; 253 mph; 220.2 kn; 372 ft/s) [6] [7] The wind gust was evaluated by the WMO Evaluation Panel who found that the anemometer was mechanically sound and the gust was within statistical probability and ratified the measurement in 2010. The anemometer was mounted 10 m above ground level (and thus 64 m above sea level). During the cyclone, several extreme gusts of greater than 83 m/s (300 km/h; 190 mph; 161 kn; 270 ft/s) were recorded, with a maximum 5-minute mean speed of 49 m/s (180 km/h; 110 mph; 95 kn; 160 ft/s) the extreme gust factor was in the order of 2.27–2.75 times the mean wind speed. The pattern and scales of the gusts suggest that a mesovortex was embedded in the already strong eyewall of the cyclone. [6]

Currently, the second-highest surface wind speed ever officially recorded is 103.266 m/s (371.76 km/h; 231.00 mph; 200.733 kn; 338.80 ft/s) at the Mount Washington (New Hampshire) Observatory 1,917 m (6,288 ft) above sea level in the US on 12 April 1934, using a hot-wire anemometer. The anemometer, specifically designed for use on Mount Washington was later tested by the US National Weather Bureau and confirmed to be accurate. [8]

Tornadic

Wind speeds within certain atmospheric phenomena (such as tornadoes) may greatly exceed these values but have never been accurately measured. Directly measuring these tornadic winds is rarely done as the violent wind would destroy the instruments. A method of estimating speed is to use Doppler on Wheels or mobile doppler radars to measure the wind speeds remotely. [9] Using this method, a mobile radar (RaXPol) owned and operated by the University of Oklahoma recorded winds up to 150 metres per second (340 mph; 540 km/h) inside the 2013 El Reno tornado, marking the fastest winds ever observed by radar in history. [10] In 1999, a mobile radar measured winds up to 135 m/s (490 km/h; 300 mph; 262 kn; 440 ft/s) during the 1999 Bridge Creek–Moore tornado in Oklahoma on 3 May 1999, [11] although another figure of 142 m/s (510 km/h; 320 mph; 276 kn; 470 ft/s) has also been quoted for the same tornado. [12] Yet another number used by the Center for Severe Weather Research for that measurement is 135 ± 9 m/s (486 ± 32 km/h; 302 ± 20 mph; 262 ± 17 kn; 443 ± 30 ft/s). [13] However, speeds measured by Doppler weather radar are not considered official records. [12]

Wind speeds can be much higher on exoplanets. Scientists at the University of Warwick in 2015 determined that HD 189733b had winds of 2,400 m/s (8,600 km/h; 4,700 kn). In a press release, the University announced that the methods used from measuring HD 189733b's wind speeds could be used to measure wind speeds on Earth-like exoplanets. [14]

Measurement

Modern day anemometer used to capture wind speed. Anemometer-Animation.gif
Modern day anemometer used to capture wind speed.
FT742-DM acoustic resonance wind sensor, one of the instruments now used to measure wind speed at Mount Washington Observatory FT742-DM Acoustic resonance wind sensor.jpg
FT742-DM acoustic resonance wind sensor, one of the instruments now used to measure wind speed at Mount Washington Observatory

An anemometer is one of the tools used to measure wind speed. [15] A device consisting of a vertical pillar and three or four concave cups, the anemometer captures the horizontal movement of air particles (wind speed).

Unlike traditional cup and vane anemometers, ultrasonic wind sensors have no moving parts and are therefore used to measure wind speed in applications that require maintenance-free performance, such as on the top of wind turbines. As the name suggests, ultrasonic wind sensors measure the wind speed using high-frequency sound. An ultrasonic anemometer has two or three pairs of sound transmitters and receivers. Stand it in the wind and each transmitter constantly beams high-frequency sound to its respective receiver. Electronic circuits inside measure the time it takes for the sound to make its journey from each transmitter to the corresponding receiver. Depending on how the wind blows, it will affect some of the sound beams more than the others, slowing it down or speeding it up very slightly. The circuits measure the difference in speeds of the beams and use that to calculate how fast the wind is blowing. [16]

Acoustic resonance wind sensors are a variant of the ultrasonic sensor. Instead of using time of flight measurement, acoustic resonance sensors use resonating acoustic waves within a small purpose-built cavity in order to perform their wind speed measurement. Built into the cavity is an array of ultrasonic transducers, which are used to create the separate standing-wave patterns at ultrasonic frequencies. As wind passes through the cavity, a change in the wave's property occurs (phase shift). By measuring the amount of phase shift in the received signals by each transducer, and then by mathematically processing the data, the sensor is able to provide an accurate horizontal measurement of wind speed and direction. [17]

Another tool used to measure wind velocity includes a GPS combined with pitot tube.[ citation needed ] A fluid flow velocity tool, the Pitot tube is primarily used to determine the air velocity of an aircraft.

Design of structures

Anemometer on an outdoor stage set, to measure wind speed Anemometer on stage set.JPG
Anemometer on an outdoor stage set, to measure wind speed

Wind speed is a common factor in the design of structures and buildings around the world. It is often the governing factor in the required lateral strength of a structure's design.

In the United States, the wind speed used in design is often referred to as a "3-second gust" which is the highest sustained gust over a 3-second period having a probability of being exceeded per year of 1 in 50 (ASCE 7-05, updated to ASCE 7-16). [18] This design wind speed is accepted by most building codes in the United States and often governs the lateral design of buildings and structures.

In Canada, reference wind pressures are used in design and are based on the "mean hourly" wind speed having a probability of being exceeded per year of 1 in 50. The reference wind pressure is calculated using the following equation: where is the air density and is wind speed. [19]

Historically, wind speeds have been reported with a variety of averaging times (such as fastest mile, 3-second gust, 1-minute and mean hourly) which designers may have to take into account. To convert wind speeds from one averaging time to another, the Durst Curve was developed which defines the relation between probable maximum wind speed averaged over t seconds, Vt, and mean wind speed over one hour V3600. [20]

See also

Related Research Articles

<span class="mw-page-title-main">Anemometer</span> Instrument for measuring wind speed

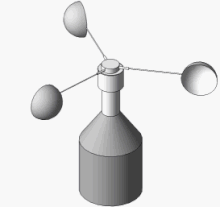
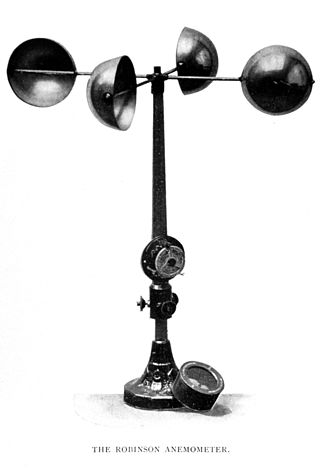
In meteorology, an anemometer is a device that measures wind speed and direction. It is a common instrument used in weather stations. The earliest known description of an anemometer was by Italian architect and author Leon Battista Alberti (1404–1472) in 1450.

<span class="mw-page-title-main">Wind chill</span> Lowering of body temperature due to the passing flow of lower-temperature air

Wind chill is the sensation of cold produced by the wind for a given ambient air temperature on exposed skin as the air motion accelerates the rate of heat transfer from the body to the surrounding atmosphere. Its values are always lower than the air temperature in the range where the formula is valid. When the apparent temperature is higher than the air temperature, the heat index is used instead.

<span class="mw-page-title-main">Beaufort scale</span> Empirical measure describing wind speed based on observed conditions

The Beaufort scale is an empirical measure that relates wind speed to observed conditions at sea or on land. Its full name is the Beaufort wind force scale.

The Saffir–Simpson hurricane wind scale (SSHWS) classifies hurricanes—which in the Western Hemisphere are tropical cyclones that exceed the intensities of tropical depressions and tropical storms—into five categories distinguished by the intensities of their sustained winds. This measuring system was formerly known as the Saffir–Simpson hurricane scale, or SSHS.

<span class="mw-page-title-main">Low-pressure area</span> Area with air pressures lower than adjacent areas

In meteorology, a low-pressure area, low area or low is a region where the atmospheric pressure is lower than that of surrounding locations. Low-pressure areas are commonly associated with inclement weather, while high-pressure areas are associated with lighter winds and clear skies. Winds circle anti-clockwise around lows in the northern hemisphere, and clockwise in the southern hemisphere, due to opposing Coriolis forces. Low-pressure systems form under areas of wind divergence that occur in the upper levels of the atmosphere (aloft). The formation process of a low-pressure area is known as cyclogenesis. In meteorology, atmospheric divergence aloft occurs in two kinds of places:

<span class="mw-page-title-main">Great storm of 1987</span> 1987 October storm in Western Europe

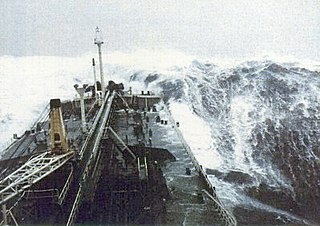
The great storm of 1987 was a violent extratropical cyclone that occurred on the night of 15–16 October, with hurricane-force winds causing casualties in the United Kingdom, France, and the Channel Islands as a severe depression in the Bay of Biscay moved northeast. Among the most damaged areas were Greater London, Kent, the East Anglian coast, the Home Counties, the west of Brittany, and the Cotentin Peninsula of Normandy, all of which weathered gusts typically with a return period of 1 in 200 years.

This is a list of meteorology topics. The terms relate to meteorology, the interdisciplinary scientific study of the atmosphere that focuses on weather processes and forecasting.

The TORRO tornado intensity scale is a scale measuring tornado intensity between T0 and T11. It was proposed by Terence Meaden of the Tornado and Storm Research Organisation (TORRO), a meteorological organisation in the United Kingdom, as an extension of the Beaufort scale.

<span class="mw-page-title-main">1947 Fort Lauderdale hurricane</span> Category 4 Atlantic hurricane in 1947

The 1947 Fort Lauderdale hurricane(Air Weather Service designation: George) was a long-lived and an intense tropical cyclone that affected the Bahamas, southernmost Florida, and the Gulf Coast of the United States in September 1947. The fourth Atlantic tropical cyclone of the year, it formed in the eastern Atlantic Ocean on September 4, becoming a hurricane, the third of the 1947 Atlantic hurricane season, less than a day later. After moving south by west for the next four days, it turned to the northwest and rapidly attained strength beginning on September 9. It reached a peak intensity of 145 mph (233 km/h) on September 15 while approaching the Bahamas. In spite of contemporaneous forecasts that predicted a strike farther north, the storm then turned to the west and poised to strike South Florida, crossing first the northern Bahamas at peak intensity. In the Bahamas, the storm produced a large storm surge and heavy damage, but with no reported fatalities.

<span class="mw-page-title-main">Tropical cyclone scales</span> Scales of the intensity of tropical cyclones

Tropical cyclones are ranked on one of five tropical cyclone intensity scales, according to their maximum sustained winds and which tropical cyclone basins they are located in. Only a few scales of classifications are used officially by the meteorological agencies monitoring the tropical cyclones, but other scales also exist, such as accumulated cyclone energy, the Power Dissipation Index, the Integrated Kinetic Energy Index, and the Hurricane Severity Index.

<span class="mw-page-title-main">1915 New Orleans hurricane</span> Category 4 Atlantic hurricane in 1915

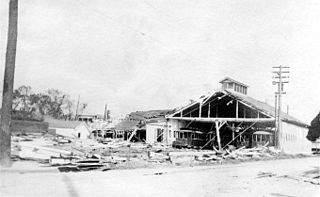
The New Orleans Hurricane of 1915 was an intense Category 4 hurricane that made landfall near Grand Isle, Louisiana, and the most intense tropical cyclone during the 1915 Atlantic hurricane season. The storm formed in late September when it moved westward and peaked in intensity of 145 mph (233 km/h) to weaken slightly by time of landfall on September 29 with recorded wind speeds of 126 mph (203 km/h) as a strong category 3 Hurricane. The hurricane killed 275 people and caused $13 million in damage.

This article describes severe weather terminology used by the Meteorological Service of Canada, a branch within Environment and Climate Change Canada. The article primarily describes various weather warnings, and their criteria. Related weather scales and general weather terms are also addressed in this article. Some terms are specific to certain regions.

<span class="mw-page-title-main">Meteorological instrumentation</span> Measuring device used in meteorology

Meteorological instruments, including meteorological sensors, are the equipment used to find the state of the atmosphere at a given time. Each science has its own unique sets of laboratory equipment. Meteorology, however, is a science which does not use much laboratory equipment but relies more on on-site observation and remote sensing equipment. In science, an observation, or observable, is an abstract idea that can be measured and for which data can be taken. Rain was one of the first quantities to be measured historically. Two other accurately measured weather-related variables are wind and humidity. Many attempts had been made prior to the 15th century to construct adequate equipment to measure atmospheric variables.

The maximum sustained wind associated with a tropical cyclone is a common indicator of the intensity of the storm. Within a mature tropical cyclone, it is found within the eyewall at a distance defined as the radius of maximum wind, or RMW. Unlike gusts, the value of these winds are determined via their sampling and averaging the sampled results over a period of time. Wind measuring has been standardized globally to reflect the winds at 10 metres (33 ft) above mean sea level, and the maximum sustained wind represents the highest average wind over either a one-minute (US) or ten-minute time span, anywhere within the tropical cyclone. Surface winds are highly variable due to friction between the atmosphere and the Earth's surface, as well as near hills and mountains over land.

<span class="mw-page-title-main">Hurricane Ava</span> Category 5 Pacific hurricane in 1973

Hurricane Ava was the earliest forming Category 5 hurricane on record in the East Pacific basin. The storm is also tied with 2006's Hurricane Ioke as the fifth-strongest Pacific hurricane on record. It was the first named storm of the 1973 Pacific hurricane season. Forming in early June, Hurricane Ava eventually reached Category 5 intensity on the Saffir–Simpson hurricane scale, the first Pacific hurricane to do so in June and the earliest ever in a season. Its central pressure made it the most intense known Pacific hurricane at the time. Despite its intensity, Ava stayed at sea without significant impact.

<span class="mw-page-title-main">1947 Florida–Georgia hurricane</span> Category 2 Atlantic hurricane in 1947

The 1947 Florida–Georgia hurricane(Air Weather Service designation: King) was a moderate hurricane that caused catastrophic flooding in South Florida and the Everglades in mid-October 1947. The ninth tropical storm and fourth hurricane of the 1947 Atlantic hurricane season, it first developed on October 9 in the southern Caribbean Sea and hence moved north by west until a few days later it struck western Cuba. The cyclone then turned sharply to the northeast, accelerated, and strengthened to a hurricane, within 30 hours crossing the southern Florida peninsula. Across South Florida, the storm produced widespread rainfall of up to 15 inches (380 mm) and severe flooding, among the worst ever recorded in the area, that led to efforts by the United States Congress to improve drainage in the region.

<span class="mw-page-title-main">Cyclone Olivia</span> Category 4 region cyclone in 1996

Severe Tropical Cyclone Olivia was a powerful cyclone, the 13th named storm of the 1995–96 Australian region cyclone season, which formed on 3 April 1996 to the north of Australia's Northern Territory. The storm moved generally to the southwest, gradually intensifying off Western Australia. On 8 April, Olivia intensified into a severe tropical cyclone and subsequently turned more to the south, steered by a passing trough. On the morning of 10 April, passing over Barrow Island off the Western Australian northwest coast, Olivia produced the strongest non-tornadic winds ever recorded, with peak gusts of 408 kilometres per hour (254 mph). On the same day the cyclone made landfall on the Pilbara coast, about 75 kilometres (47 mi) north-northwest of Pannawonica. The storm quickly weakened over land, dissipating over the Great Australian Bight on 12 April.

<span class="mw-page-title-main">Glossary of tropical cyclone terms</span>

The following is a glossary of tropical cyclone terms.

The following is a glossary of tornado terms. It includes scientific as well as selected informal terminology.

<span class="mw-page-title-main">Glossary of meteorology</span> List of definitions of terms and concepts commonly used in meteorology

This glossary of meteorology is a list of terms and concepts relevant to meteorology and atmospheric science, their sub-disciplines, and related fields.

References

  1. Brun, P., Zimmermann, N.E., Hari, C., Pellissier, L., Karger, D.N. (preprint): Global climate-related predictors at kilometre resolution for the past and future. Earth Syst. Sci. Data Discuss. https://doi.org/10.5194/essd-2022-212
  2. Hogan, C. Michael (2010). "Abiotic factor". In Emily Monosson; C. Cleveland (eds.). Encyclopedia of Earth. Washington D.C.: National Council for Science and the Environment. Archived from the original on 2013-06-08.
  3. Windspeed | Icelandic Meteorological office "The Icelandic Meteorological Office now uses the SI (Systeme Internationale d'Unites) measurement metres per second (m/s) […] other Nordic meteorological institutes have used this system for years with satisfactory results"
  4. International Civil Aviation Organization – International Standards and Recommended Practices – Units of Measurement to be Used in Air and Ground Operations – Annex 5 to the Convention on International Civil Aviation
  5. Measuring Wind Speed in Knots "The reason why sea winds are measured in knots at all has to do with maritime tradition"
  6. 1 2 "Documentation and verification of the world extreme wind gust record: 113.3 m s–1 on Barrow Island, Australia, during passage of tropical cyclone Olivia" (PDF). Australian Meteorological and Oceanographic Journal.
  7. "World record wind gust". World Meteorological Association. 5 November 2015. Archived from the original on December 18, 2023. Retrieved 12 February 2017.
  8. "The story of the world record wind". Mount Washington Observatory. Retrieved 26 January 2010.
  9. "Massive Okla. tornado had windspeed up to 200 mph". CBS News. 20 May 2013. Retrieved 17 May 2014.
  10. Lyza, Anthony W.; Flournoy, Matthew D.; Alford, A. Addison (19 March 2024). "Comparison of Tornado Damage Characteristics to Low-Altitude WSR-88D Radar Observations and Implications for Tornado Intensity Estimation". Monthly Weather Review . National Oceanic and Atmospheric Administration and University of Oklahoma via the American Meteorological Society. doi:10.1175/MWR-D-23-0242.1 . Retrieved 19 March 2024.
  11. "Historical Tornadoes". National Weather Service.
  12. 1 2 "Highest surface wind speed-Tropical Cyclone Olivia sets world record". World Record Academy. 26 January 2010. Retrieved 17 May 2014.
  13. Wurman, Joshua (2007). "Doppler On Wheels". Center for Severe Weather Research. Archived from the original on 2011-07-19.
  14. "5400mph winds discovered hurtling around planet outside solar system". warwick.ac.uk. Retrieved 2020-08-08.
  15. Koen, Joshua. "Make and Use an Anemometer to measure Wind Speed". www.ciese.org. Retrieved 2018-04-18.
  16. Chris Woodford. Ultrasonic anemometers. https://www.explainthatstuff.com/anemometers.html
  17. Kapartis, Savvas (1999) "Anemometer employing standing wave normal to fluid flow and travelling wave normal to standing wave" U.S. patent 5,877,416
  18. "Wind and Structures". Korea Science (in Korean). Retrieved 2018-04-18.
  19. NBC 2005 Structural Commentaries – Part 4 of Div. B, Comm. I
  20. ASCE 7-05 commentary Figure C6-4, ASCE 7-10 C26.5-1