Related Research Articles
Bayesian statistics is a theory in the field of statistics based on the Bayesian interpretation of probability where probability expresses a degree of belief in an event. The degree of belief may be based on prior knowledge about the event, such as the results of previous experiments, or on personal beliefs about the event. This differs from a number of other interpretations of probability, such as the frequentist interpretation that views probability as the limit of the relative frequency of an event after many trials.
JMP is a suite of computer programs for statistical analysis developed by JMP, a subsidiary of SAS Institute. It was launched in 1989 to take advantage of the graphical user interface introduced by the Macintosh operating systems. It has since been significantly rewritten and made available also for the Windows operating system. JMP is used in applications such as Six Sigma, quality control, and engineering, design of experiments, as well as for research in science, engineering, and social sciences.

Data analysis is a process of inspecting, cleansing, transforming, and modeling data with the goal of discovering useful information, informing conclusions, and supporting decision-making. Data analysis has multiple facets and approaches, encompassing diverse techniques under a variety of names, and is used in different business, science, and social science domains. In today's business world, data analysis plays a role in making decisions more scientific and helping businesses operate more effectively.
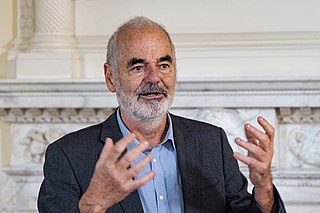
Sir David John Spiegelhalter is a British statistician and a Fellow of Churchill College, Cambridge. From 2007 to 2018 he was Winton Professor of the Public Understanding of Risk in the Statistical Laboratory at the University of Cambridge. Spiegelhalter is an ISI highly cited researcher.

Data and information visualization is the practice of designing and creating easy-to-communicate and easy-to-understand graphic or visual representations of a large amount of complex quantitative and qualitative data and information from a certain domain of expertise with the help of static, dynamic or interactive visual items for a broader audience to help them visually explore and discover, quickly understand, interpret and gain important insights into otherwise difficult-to-identify structures, relationships, correlations, local and global patterns, trends, variations, constancy, clusters, outliers and unusual groupings within data. When intended for the general public to convey a concise version of known, specific information in a clear and engaging manner, it is typically called information graphics.

Chernoff faces, invented by applied mathematician, statistician and physicist Herman Chernoff in 1973, display multivariate data in the shape of a human face. The individual parts, such as eyes, ears, mouth and nose represent values of the variables by their shape, size, placement and orientation. The idea behind using faces is that humans easily recognize faces and notice small changes without difficulty. Chernoff faces handle each variable differently. Because the features of the faces vary in perceived importance, the way in which variables are mapped to the features should be carefully chosen.

Fernanda Bertini Viégas is a Brazilian computer scientist and graphical designer, whose work focuses on the social, collaborative and artistic aspects of information visualization.
Joseph Michael Hilbe was an American statistician and philosopher, founding President of the International Astrostatistics Association(IAA) and one of the most prolific authors of books on statistical modeling in the early twenty-first century. Hilbe was an elected Fellow of the American Statistical Association as well as an elected member of the International Statistical Institute (ISI), for which he founded the ISI astrostatistics committee in 2009. Hilbe was also a Fellow of the Royal Statistical Society and Full Member of the American Astronomical Society.

Anscombe's quartet comprises four data sets that have nearly identical simple descriptive statistics, yet have very different distributions and appear very different when graphed. Each dataset consists of eleven (x,y) points. They were constructed in 1973 by the statistician Francis Anscombe to demonstrate both the importance of graphing data when analyzing it, and the effect of outliers and other influential observations on statistical properties. He described the article as being intended to counter the impression among statisticians that "numerical calculations are exact, but graphs are rough."
Michael Louis Friendly is an American-Canadian psychologist, Professor of Psychology at York University in Ontario, Canada, and director of its Statistical Consulting Service, especially known for his contributions to graphical methods for categorical and multivariate data, and on the history of data and information visualisation.
Tableau Software is an American interactive data visualization software company focused on business intelligence. It was founded in 2003 in Mountain View, California, and is currently headquartered in Seattle, Washington. In 2019 the company was acquired by Salesforce for $15.7 billion. At the time, this was the largest acquisition by Salesforce since its foundation. It was later surpassed by Salesforce's acquisition of Slack.

Leland Wilkinson was an American statistician and computer scientist at H2O.ai and Adjunct Professor of Computer Science at University of Illinois at Chicago. Wilkinson developed the SYSTAT statistical package in the early 1980s, sold it to SPSS in 1995, and worked at SPSS for 10 years recruiting and managing the visualization team. He left SPSS in 2008 and became Executive VP of SYSTAT Software Inc. in Chicago. He then served as the VP of Data Visualization at Skytree, Inc and VP of Statistics at Tableau Software before joining H2O.ai. His research focused on scientific visualization and statistical graphics. In these communities he was well known for his book The Grammar of Graphics, which was the foundation for the R package ggplot2.

ggplot2 is an open-source data visualization package for the statistical programming language R. Created by Hadley Wickham in 2005, ggplot2 is an implementation of Leland Wilkinson's Grammar of Graphics—a general scheme for data visualization which breaks up graphs into semantic components such as scales and layers. ggplot2 can serve as a replacement for the base graphics in R and contains a number of defaults for web and print display of common scales. Since 2005, ggplot2 has grown in use to become one of the most popular R packages.

Data science is an interdisciplinary academic field that uses statistics, scientific computing, scientific methods, processes, algorithms and systems to extract or extrapolate knowledge and insights from noisy, structured, and unstructured data.

Hadley Alexander Wickham is a New Zealand statistician known for his work on open-source software for the R statistical programming environment. He is the chief scientist at Posit, PBC and an adjunct professor of statistics at the University of Auckland, Stanford University, and Rice University. His work includes the data visualisation system ggplot2 and the tidyverse, a collection of R packages for data science based on the concept of tidy data.
Mark Henry Hansen is an American statistician, professor at the Columbia University Graduate School of Journalism and Director of the David and Helen Gurley Brown Institute for Media Innovation. His special interest is the intersection of data, art and technology. He adopts an interdisciplinary approach to data science, drawing on various branches of applied mathematics, information theory and new media arts. Within the field of journalism, Hansen has promoted coding literacy for journalists.

Amanda Cox is an American journalist and head of special data projects at USAFacts. Until January 2022 she was the editor of the New York Times data journalism section The Upshot. Cox helps develop and teach data journalism courses at the New York University School of Journalism.
Jennifer "Jenny" Bryan is a data scientist and an associate professor of statistics at the University of British Columbia where she developed the Master in Data Science Program. She is a statistician and software engineer at RStudio from Vancouver, Canada and is known for creating open source tools which connect R to Google Sheets and Google Drive.
Jen Christiansen is an American author, data illustrator, and a senior graphics editor for Scientific American. She has published many books on her work which include her insight on collaboration and the visualization spectrum.
RAWGraphs is a web-based open-source data visualization software made in JavaScript. It employs D3.js for the creation of editable visualizations in SVG format.
References
- 1 2 3 "Extraordinary Minds". UCLA College Magazine. Los Angeles: University of California, Los Angeles. 2017. p. 31. Retrieved March 10, 2021– via Issuu.
- 1 2 "An Online Tool for Personal Data Collection and Exploration". 2013. Retrieved March 12, 2021.
- 1 2 "Here's how you're probably going to die – in a stunning visualisation". The Daily Telegraph . January 19, 2016. Retrieved December 4, 2019.
- ↑ "Visualizing Data And Telling Compelling Stories With OkCupid And FlowingData". Fast Company. August 8, 2011. Retrieved December 4, 2019.
- 1 2 "Our Researchers | Nathan Yau". United States Census . August 11, 2016. Archived from the original on March 10, 2021. Retrieved March 12, 2021.
- ↑ "Chapter 1. Seeing Your Life in Data". O'Reilly Media . Retrieved March 12, 2021.
- ↑ Segaran, Toby; Hammerbacher, Jeff (2009). Beautiful Data: the stories behind elegant data solutions (First ed.). Sebastopol, California: O'Reilly. ISBN 9780596157111. OCLC 827947721.
- 1 2 "Visualize This: How to Tell Stories with Data". Brain Pickings . July 26, 2011. Retrieved December 4, 2019.
- ↑ "The Art of Flowing Data: An interview with Dr Nathan Yau". Statistics Views. November 25, 2015. Retrieved December 4, 2019.
- ↑ "The Top 30 Best Data Visualization Books on Our Reading List". Solutions Review. November 12, 2019. Retrieved December 4, 2019.
- ↑ "Infographics: Winds of Change". The Economist . July 6, 2013. Archived from the original on July 15, 2013. Retrieved December 4, 2019.