A histogram is an approximate representation of the distribution of numerical data. The term was first introduced by Karl Pearson. To construct a histogram, the first step is to "bin" the range of values—that is, divide the entire range of values into a series of intervals—and then count how many values fall into each interval. The bins are usually specified as consecutive, non-overlapping intervals of a variable. The bins (intervals) must be adjacent and are often of equal size.

William Edwards Deming was an American business theorist, composer, economist, industrial engineer, management consultant, statistician, and writer. Educated initially as an electrical engineer and later specializing in mathematical physics, he helped develop the sampling techniques still used by the United States Census Bureau and the Bureau of Labor Statistics. He is also known as the father of the quality movement and was hugely influential in post-WWII Japan. He is best known for his theories of management.
Quality assurance (QA) is the term used in both manufacturing and service industries to describe the systematic efforts taken to assure that the product(s) delivered to customer(s) meet with the contractual and other agreed upon performance, design, reliability, and maintainability expectations of that customer. The core purpose of Quality Assurance is to prevent mistakes and defects in the development and production of both manufactured products, such as automobiles and shoes, and delivered services, such as automotive repair and athletic shoe design. Assuring quality and therefore avoiding problems and delays when delivering products or services to customers is what ISO 9000 defines as that "part of quality management focused on providing confidence that quality requirements will be fulfilled". This defect prevention aspect of quality assurance differs from the defect detection aspect of quality control and has been referred to as a shift left since it focuses on quality efforts earlier in product development and production and on avoiding defects in the first place rather than correcting them after the fact.

Walter Andrew Shewhart was an American physicist, engineer and statistician, sometimes known as the father of statistical quality control and also related to the Shewhart cycle.
Common and special causes are the two distinct origins of variation in a process, as defined in the statistical thinking and methods of Walter A. Shewhart and W. Edwards Deming. Briefly, "common causes", also called natural patterns, are the usual, historical, quantifiable variation in a system, while "special causes" are unusual, not previously observed, non-quantifiable variation.

Control charts are graphical plots used in production control to determine whether quality and manufacturing processes are being controlled under stable conditions. The hourly status is arranged on the graph, and the occurrence of abnormalities is judged based on the presence of data that differs from the conventional trend or deviates from the control limit line. Control charts are classified into Shewhart individuals control chart and CUSUM(CUsUM)(or cumulative sum control chart)(ISO 7870-4).
Statistical process control (SPC) or statistical quality control (SQC) is the application of statistical methods to monitor and control the quality of a production process. This helps to ensure that the process operates efficiently, producing more specification-conforming products with less waste scrap. SPC can be applied to any process where the "conforming product" output can be measured. Key tools used in SPC include run charts, control charts, a focus on continuous improvement, and the design of experiments. An example of a process where SPC is applied is manufacturing lines.
PDCA or plan–do–check–act is an iterative design and management method used in business for the control and continual improvement of processes and products. It is also known as the Shewhart cycle, or the control circle/cycle. Another version of this PDCA cycle is OPDCA. The added "O" stands for observation or as some versions say: "Observe the current condition." This emphasis on observation and current condition has currency with the literature on lean manufacturing and the Toyota Production System. The PDCA cycle, with Ishikawa's changes, can be traced back to S. Mizuno of the Tokyo Institute of Technology in 1959.
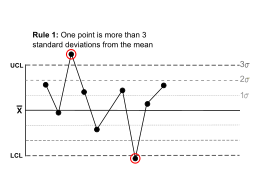
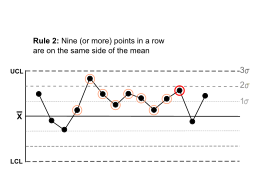
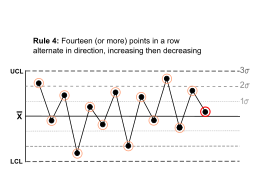
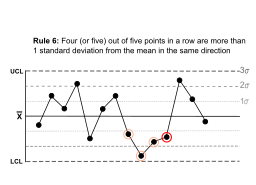
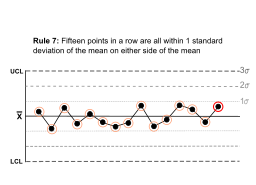
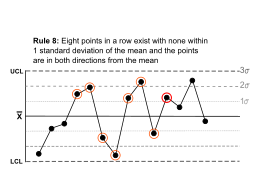
The Western Electric rules are decision rules in statistical process control for detecting out-of-control or non-random conditions on control charts. Locations of the observations relative to the control chart control limits and centerline indicate whether the process in question should be investigated for assignable causes. The Western Electric rules were codified by a specially-appointed committee of the manufacturing division of the Western Electric Company and appeared in the first edition of a 1956 handbook, that became a standard text of the field. Their purpose was to ensure that line workers and engineers interpret control charts in a uniform way.

In statistical process control (SPC), the and R chart is a type of scheme, popularly known as control chart, used to monitor the mean and range of a normally distributed variables simultaneously, when samples are collected at regular intervals from a business or industrial process. It is often used to monitor the variables data but the performance of the and R chart may suffer when the normality assumption is not valid.

In statistical quality control, the p-chart is a type of control chart used to monitor the proportion of nonconforming units in a sample, where the sample proportion nonconforming is defined as the ratio of the number of nonconforming units to the sample size, n.
The combination of quality control and genetic algorithms led to novel solutions of complex quality control design and optimization problems. Quality is the degree to which a set of inherent characteristics of an entity fulfils a need or expectation that is stated, general implied or obligatory. ISO 9000 defines quality control as "A part of quality management focused on fulfilling quality requirements". Genetic algorithms are search algorithms, based on the mechanics of natural selection and natural genetics.
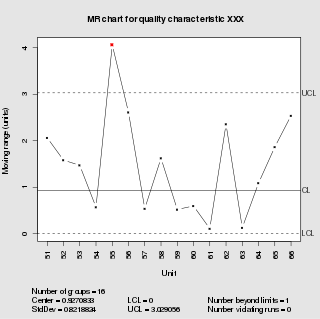
In statistical quality control, the individual/moving-range chart is a type of control chart used to monitor variables data from a business or industrial process for which it is impractical to use rational subgroups.
Process Window Index (PWI) is a statistical measure that quantifies the robustness of a manufacturing process, e.g. one which involves heating and cooling, known as a thermal process. In manufacturing industry, PWI values are used to calibrate the heating and cooling of soldering jobs while baked in a reflow oven.
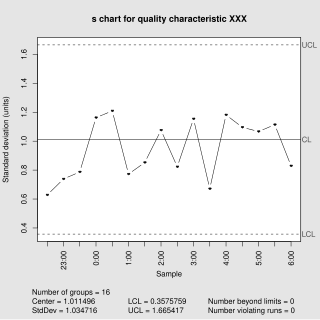
In statistical quality control, the and s chart is a type of control chart used to monitor variables data when samples are collected at regular intervals from a business or industrial process. This is connected to traditional statistical quality control (SQC) and statistical process control (SPC). However, Woodall noted that "I believe that the use of control charts and other monitoring methods should be referred to as “statistical process monitoring,” not “statistical process control (SPC).”"
Laboratory quality control is designed to detect, reduce, and correct deficiencies in a laboratory's internal analytical process prior to the release of patient results, in order to improve the quality of the results reported by the laboratory. Quality control (QC) is a measure of precision, or how well the measurement system reproduces the same result over time and under varying operating conditions. Laboratory quality control material is usually run at the beginning of each shift, after an instrument is serviced, when reagent lots are changed, after equipment calibration, and whenever patient results seem inappropriate. Quality control material should approximate the same matrix as patient specimens, taking into account properties such as viscosity, turbidity, composition, and color. It should be simple to use, with minimal vial-to-vial variability, because variability could be misinterpreted as systematic error in the method or instrument. It should be stable for long periods of time, and available in large enough quantities for a single batch to last at least one year. Liquid controls are more convenient than lyophilized (freeze-dried) controls because they do not have to be reconstituted, minimizing pipetting error. Dried Tube Specimen (DTS) is slightly cumbersome as a QC material but it is very low-cost, stable over long periods and efficient, especially useful for resource-restricted settings in under-developed and developing countries. DTS can be manufactured in-house by a laboratory or Blood Bank for its use.

A plot is a graphical technique for representing a data set, usually as a graph showing the relationship between two or more variables. The plot can be drawn by hand or by a computer. In the past, sometimes mechanical or electronic plotters were used. Graphs are a visual representation of the relationship between variables, which are very useful for humans who can then quickly derive an understanding which may not have come from lists of values. Given a scale or ruler, graphs can also be used to read off the value of an unknown variable plotted as a function of a known one, but this can also be done with data presented in tabular form. Graphs of functions are used in mathematics, sciences, engineering, technology, finance, and other areas.

In statistical quality control, the EWMA chart is a type of control chart used to monitor either variables or attributes-type data using the monitored business or industrial process's entire history of output. While other control charts treat rational subgroups of samples individually, the EWMA chart tracks the exponentially-weighted moving average of all prior sample means. EWMA weights samples in geometrically decreasing order so that the most recent samples are weighted most highly while the most distant samples contribute very little.
In statistics, the Cucconi test is a nonparametric test for jointly comparing central tendency and variability in two samples. Many rank tests have been proposed for the two-sample location-scale problem. Nearly all of them are Lepage-type tests, that is a combination of a location test and a scale test. The Cucconi test was first proposed by Odoardo Cucconi in 1968.
In statistics, the Lepage test is an exact distribution-free test for jointly monitoring the location and scale (variability) in two-sample treatment versus control comparisons. This is one of the most famous rank tests for the two-sample location-scale problem. The Lepage test statistic is the squared Euclidean distance of standardized Wilcoxon rank-sum test for location and the standardized Ansari–Bradley test for scale. The Lepage test was first introduced by Yves Lepage in 1971 in a paper in Biometrika. A large number of Lepage-type tests exists in statistical literature for simultaneously testing location and scale shifts in case-control studies. The details may be found in the book: Nonparametric statistical tests: A computational approach. Kössler, W. in 2006 also introduced various Lepage type tests using some alternative score functions optimal for various distributions. Dr. Amitava Mukherjee and Dr. Marco Marozzi introduced a class of percentile modified version of the Lepage test. An alternative to the Lepage-type tests is known as the Cucconi test proposed by Odoardo Cucconi in 1968.