In microeconomics, supply and demand is an economic model of price determination in a market. It postulates that, holding all else equal, in a competitive market, the unit price for a particular good, or other traded item such as labor or liquid financial assets, will vary until it settles at a point where the quantity demanded will equal the quantity supplied, resulting in an economic equilibrium for price and quantity transacted. The concept of supply and demand forms the theoretical basis of modern economics.
In economics, elasticity measures the responsiveness of one economic variable to a change in another. If the price elasticity of the demand of something is -2, a 10% increase in price causes the quantity demanded to fall by 20%. Elasticity in economics provides an understanding of changes in the behavior of the buyers and sellers with price changes. There are two types of elasticity for demand and supply, one is inelastic demand and supply and other one is elastic demand and supply.
A good's price elasticity of demand is a measure of how sensitive the quantity demanded is to its price. When the price rises, quantity demanded falls for almost any good, but it falls more for some than for others. The price elasticity gives the percentage change in quantity demanded when there is a one percent increase in price, holding everything else constant. If the elasticity is −2, that means a one percent price rise leads to a two percent decline in quantity demanded. Other elasticities measure how the quantity demanded changes with other variables.
In economics, the crosselasticity of demand measures the effect of changes in the price of one good on the quantity demanded of another good. This reflects the fact that the quantity demanded of good is dependent on not only its own price but also the price of other "related" good.

In economics and consumer theory, a Giffen good is a product that people consume more of as the price rises and vice versa—violating the basic law of demand in microeconomics. For any other sort of good, as the price of the good rises, the substitution effect makes consumers purchase less of it, and more of substitute goods; for most goods, the income effect reinforces this decline in demand for the good. But a Giffen good is so strongly an inferior good in the minds of consumers that this contrary income effect more than offsets the substitution effect, and the net effect of the good's price rise is to increase demand for it. This phenomenon is known as the Giffen paradox. A Giffen good is considered to be the opposite of an ordinary good.

In economics, an inferior good is a good whose demand decreases when consumer income rises, unlike normal goods, for which the opposite is observed. Normal goods are those goods for which the demand rises as consumer income rises.

In microeconomics, two goods are substitutes if the products could be used for the same purpose by the consumers. That is, a consumer perceives both goods as similar or comparable, so that having more of one good causes the consumer to desire less of the other good. Contrary to complementary goods and independent goods, substitute goods may replace each other in use due to changing economic conditions. An example of substitute goods is Coca-Cola and Pepsi; the interchangeable aspect of these goods is due to the similarity of the purpose they serve, i.e fulfilling customers' desire for a soft drink. These types of substitutes can be referred to as close substitutes.
In microeconomics, an Engel curve describes how household expenditure on a particular good or service varies with household income. There are two varieties of Engel curves. Budget share Engel curves describe how the proportion of household income spent on a good varies with income. Alternatively, Engel curves can also describe how real expenditure varies with household income. They are named after the German statistician Ernst Engel (1821–1896), who was the first to investigate this relationship between goods expenditure and income systematically in 1857. The best-known single result from the article is Engel's law which states that as income grows, spending on food becomes a smaller share of income; therefore, the share of a household's or country's income spent on food is an indication of their affluence.
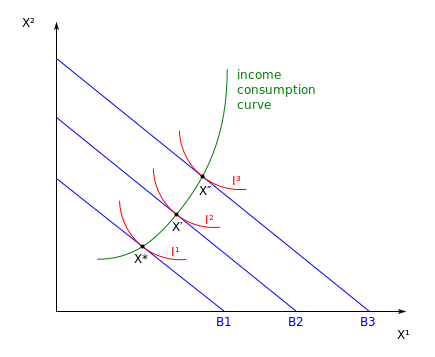
In economics and particularly in consumer choice theory, the income-consumption curve is a curve in a graph in which the quantities of two goods are plotted on the two axes; the curve is the locus of points showing the consumption bundles chosen at each of various levels of income.
In economics and particularly in consumer choice theory, the substitution effect is one component of the effect of a change in the price of a good upon the amount of that good demanded by a consumer, the other being the income effect.

In microeconomics, the law of demand is a fundamental principle which states that there is an inverse relationship between price and quantity demanded. In other words, "conditional on all else being equal, as the price of a good increases (↑), quantity demanded will decrease (↓); conversely, as the price of a good decreases (↓), quantity demanded will increase (↑)". Alfred Marshall worded this as: "When we say that a person's demand for anything increases, we mean that he will buy more of it than he would before at the same price, and that he will buy as much of it as before at a higher price". The law of demand, however, only makes a qualitative statement in the sense that it describes the direction of change in the amount of quantity demanded but not the magnitude of change.

In economics, a luxury good is a good for which demand increases more than what is proportional as income rises, so that expenditures on the good become a greater proportion of overall spending. Luxury goods are in contrast to necessity goods, where demand increases proportionally less than income. Luxury goods is often used synonymously with superior goods.
A demand curve is a graph depicting the inverse demand function, a relationship between the price of a certain commodity and the quantity of that commodity that is demanded at that price. Demand curves can be used either for the price-quantity relationship for an individual consumer, or for all consumers in a particular market.
The Slutsky equation in economics, named after Eugen Slutsky, relates changes in Marshallian (uncompensated) demand to changes in Hicksian (compensated) demand, which is known as such since it compensates to maintain a fixed level of utility.
The wealth effect is the change in spending that accompanies a change in perceived wealth. Usually the wealth effect is positive: spending changes in the same direction as perceived wealth.
In economics, tax incidence or tax burden is the effect of a particular tax on the distribution of economic welfare. Economists distinguish between the entities who ultimately bear the tax burden and those on whom the tax is initially imposed. The tax burden measures the true economic effect of the tax, measured by the difference between real incomes or utilities before and after imposing the tax, and taking into account how the tax causes prices to change. For example, if a 10% tax is imposed on sellers of butter, but the market price rises 8% as a result, most of the tax burden is on buyers, not sellers. The concept of tax incidence was initially brought to economists' attention by the French Physiocrats, in particular François Quesnay, who argued that the incidence of all taxation falls ultimately on landowners and is at the expense of land rent. Tax incidence is said to "fall" upon the group that ultimately bears the burden of, or ultimately suffers a loss from, the tax. The key concept of tax incidence is that the tax incidence or tax burden does not depend on where the revenue is collected, but on the price elasticity of demand and price elasticity of supply. As a general policy matter, the tax incidence should not violate the principles of a desirable tax system, especially fairness and transparency. The concept of tax incidence is used in political science and sociology to analyze the level of resources extracted from each income social stratum in order to describe how the tax burden is distributed among social classes. That allows one to derive some inferences about the progressive nature of the tax system, according to principles of vertical equity.
In economics, demand is the quantity of a good that consumers are willing and able to purchase at various prices during a given time. The relationship between price and quantity demand is also called the demand curve. Demand for a specific item is a function of an item's perceived necessity, price, perceived quality, convenience, available alternatives, purchasers' disposable income and tastes, and many other options.
Economic theory evaluates how taxes are able to provide the government with required amount of the financial resources and what are the impacts of this tax system on overall economic efficiency. If tax efficiency needs to be assessed, tax cost must be taken into account, including administrative costs and excessive tax burden also known as the dead weight loss of taxation (DWL). Direct administrative costs include state administration costs for the organisation of the tax system, for the evidence of taxpayers, tax collection and control. Indirect administrative costs can include time spent filling out tax returns or money spent on paying tax advisors.
In economics, a necessity good or a necessary good is a type of normal good. Necessity goods are product(s) and services that consumers will buy regardless of the changes in their income levels, therefore making these products less sensitive to income change. Examples include repetitive purchases of different durations such as haircuts, addictive habits including tobacco, everyday essentials such as electricity and water, and critical medicine such as insulin. As for any other normal good, an income rise will lead to a rise in demand, but the increase for a necessity good is less than proportional to the rise in income, so the proportion of expenditure on these goods falls as income rises. If income elasticity of demand is lower than unity, it is a necessity good. This observation for food, known as Engel's law, states that as income rises, the proportion of income spent on food falls, even if absolute expenditure on food rises. This makes the income elasticity of demand for food between zero and one.
In economics, the income elasticity of demand (YED) is the responsivenesses of the quantity demanded for a good to a change in consumer income. It is measured as the ratio of the percentage change in quantity demanded to the percentage change in income. For example, if in response to a 10% increase in income, quantity demanded for a good or service were to increase by 20%, the income elasticity of demand would be 20%/10% = 2.0.