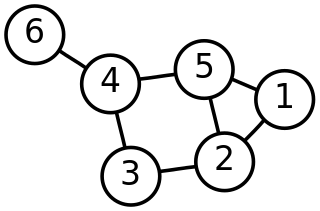
Discrete mathematics is the study of mathematical structures that can be considered "discrete" rather than "continuous". Objects studied in discrete mathematics include integers, graphs, and statements in logic. By contrast, discrete mathematics excludes topics in "continuous mathematics" such as real numbers, calculus or Euclidean geometry. Discrete objects can often be enumerated by integers; more formally, discrete mathematics has been characterized as the branch of mathematics dealing with countable sets. However, there is no exact definition of the term "discrete mathematics".

In descriptive statistics, the interquartile range (IQR) is a measure of statistical dispersion, which is the spread of the data. The IQR may also be called the midspread, middle 50%, fourth spread, or H‑spread. It is defined as the difference between the 75th and 25th percentiles of the data. To calculate the IQR, the data set is divided into quartiles, or four rank-ordered even parts via linear interpolation. These quartiles are denoted by Q1 (also called the lower quartile), Q2 (the median), and Q3 (also called the upper quartile). The lower quartile corresponds with the 25th percentile and the upper quartile corresponds with the 75th percentile, so IQR = Q3 − Q1.
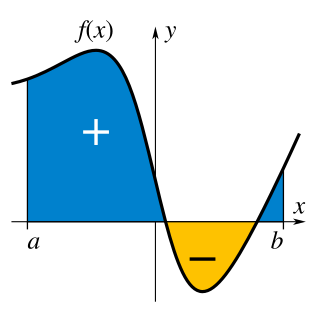
In mathematics, an integral is the continuous analog of a sum, which is used to calculate areas, volumes, and their generalizations. Integration, the process of computing an integral, is one of the two fundamental operations of calculus, the other being differentiation. Integration started as a method to solve problems in mathematics and physics, such as finding the area under a curve, or determining displacement from velocity. Today integration is used in a wide variety of scientific fields.

Maple is a symbolic and numeric computing environment as well as a multi-paradigm programming language. It covers several areas of technical computing, such as symbolic mathematics, numerical analysis, data processing, visualization, and others. A toolbox, MapleSim, adds functionality for multidomain physical modeling and code generation.

A chart is a graphical representation for data visualization, in which "the data is represented by symbols, such as bars in a bar chart, lines in a line chart, or slices in a pie chart". A chart can represent tabular numeric data, functions or some kinds of quality structure and provides different info.

Graph paper, coordinate paper, grid paper, or squared paper is writing paper that is printed with fine lines making up a regular grid. The lines are often used as guides for plotting graphs of functions or experimental data and drawing curves. It is commonly found in mathematics and engineering education settings and in laboratory notebooks. Graph paper is available either as loose leaf paper or bound in notebooks.

In probability theory and statistics, the probit function is the quantile function associated with the standard normal distribution. It has applications in data analysis and machine learning, in particular exploratory statistical graphics and specialized regression modeling of binary response variables.

In statistics, kernel density estimation (KDE) is the application of kernel smoothing for probability density estimation, i.e., a non-parametric method to estimate the probability density function of a random variable based on kernels as weights. KDE answers a fundamental data smoothing problem where inferences about the population are made, based on a finite data sample. In some fields such as signal processing and econometrics it is also termed the Parzen–Rosenblatt window method, after Emanuel Parzen and Murray Rosenblatt, who are usually credited with independently creating it in its current form. One of the famous applications of kernel density estimation is in estimating the class-conditional marginal densities of data when using a naive Bayes classifier, which can improve its prediction accuracy.
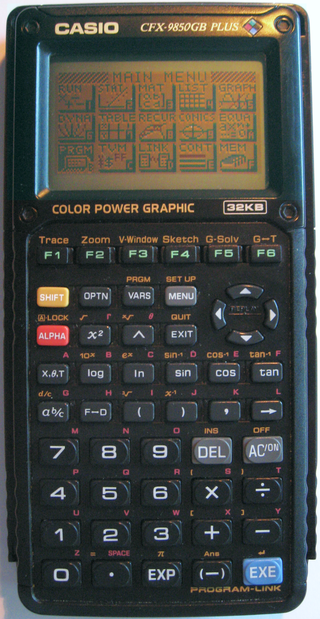
The Casio CFX-9850G series is a series of graphing calculators manufactured by Casio Computer Co., Ltd. from 1996 to 2008.

Xcas is a user interface to Giac, which is an open source computer algebra system (CAS) for Windows, macOS and Linux among many other platforms. Xcas is written in C++. Giac can be used directly inside software written in C++.

The KDE Education Project develops free educational software based on the KDE technologies for students and parents. These educational software is translated into more than 65 languages, so that users can access them without any problems. The KDE-Edu project also provides free software educational to support and facilitate teachers in planning lessons.

Graphic calculators made by Casio include the touchscreen ClassPad 300 as well as the models with traditional buttons which can be divided into two main generations listed below. Casio produced the world's first graphing calculator, the fx-7000G.

A plot is a graphical technique for representing a data set, usually as a graph showing the relationship between two or more variables. The plot can be drawn by hand or by a computer. In the past, sometimes mechanical or electronic plotters were used. Graphs are a visual representation of the relationship between variables, which are very useful for humans who can then quickly derive an understanding which may not have come from lists of values. Given a scale or ruler, graphs can also be used to read off the value of an unknown variable plotted as a function of a known one, but this can also be done with data presented in tabular form. Graphs of functions are used in mathematics, sciences, engineering, technology, finance, and other areas.

In mathematics, the integral of a non-negative function of a single variable can be regarded, in the simplest case, as the area between the graph of that function and the X axis. The Lebesgue integral, named after French mathematician Henri Lebesgue, is a limit of weighted sums, with weights defined by a chosen measure. There are Lebesgue integrable functions which are not Riemann integrable, and also Riemann integrable functions which are not Lebesgue integrable.
The survival function is a function that gives the probability that a patient, device, or other object of interest will survive past a certain time. The survival function is also known as the survivor function or reliability function. The term reliability function is common in engineering while the term survival function is used in a broader range of applications, including human mortality. The survival function is the complementary cumulative distribution function of the lifetime. Sometimes complementary cumulative distribution functions are called survival functions in general.

KAlgebra is a mathematical graph calculator included in the KDE education package. While it is based on the MathML content markup language, knowledge of MathML is not required for use. The calculator includes numerical, logical, symbolic, and analytical functions, and can plot the results onto a 2D or 3D graph. KAlgebra is free and open source software, licensed under the GPL-2.0-or-later license.