A hierarchy is an arrangement of items that are represented as being "above", "below", or "at the same level as" one another. Hierarchy is an important concept in a wide variety of fields, such as architecture, philosophy, design, mathematics, computer science, organizational theory, systems theory, systematic biology, and the social sciences.
A hierarchical organization or hierarchical organisation is an organizational structure where every entity in the organization, except one, is subordinate to a single other entity. This arrangement is a form of hierarchy. In an organization, this hierarchy usually consists of a singular/group of power at the top with subsequent levels of power beneath them. This is the dominant mode of organization among large organizations; most corporations, governments, criminal enterprises, and organized religions are hierarchical organizations with different levels of management power or authority. For example, the broad, top-level overview of the hierarchy of the Catholic Church consists of the Pope, then the Cardinals, then the Archbishops, and so on. Another example is the hierarchy between the four castes in the Hindu caste system, which arises from the religious belief "that each is derived from a different part of the creator God’s (Brahma) body, descending from the head downwards.”

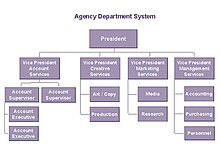
A tree structure, tree diagram, or tree model is a way of representing the hierarchical nature of a structure in a graphical form. It is named a "tree structure" because the classic representation resembles a tree, although the chart is generally upside down compared to a biological tree, with the "stem" at the top and the "leaves" at the bottom.
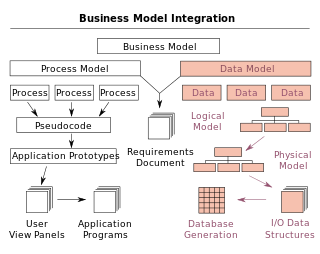
A data model is an abstract model that organizes elements of data and standardizes how they relate to one another and to the properties of real-world entities. For instance, a data model may specify that the data element representing a car be composed of a number of other elements which, in turn, represent the color and size of the car and define its owner.

A chart is a graphical representation for data visualization, in which "the data is represented by symbols, such as bars in a bar chart, lines in a line chart, or slices in a pie chart". A chart can represent tabular numeric data, functions or some kinds of quality structure and provides different info.
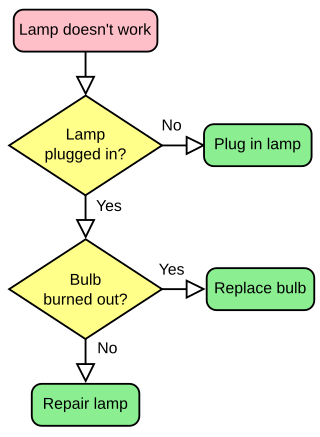
A flowchart is a type of diagram that represents a workflow or process. A flowchart can also be defined as a diagrammatic representation of an algorithm, a step-by-step approach to solving a task.
An organizational structure defines how activities such as task allocation, coordination, and supervision are directed toward the achievement of organizational aims.
A concept map or conceptual diagram is a diagram that depicts suggested relationships between concepts. Concept maps may be used by instructional designers, engineers, technical writers, and others to organize and structure knowledge.

An entity–relationship model describes interrelated things of interest in a specific domain of knowledge. A basic ER model is composed of entity types and specifies relationships that can exist between entities.

Infographics are graphic visual representations of information, data, or knowledge intended to present information quickly and clearly. They can improve cognition by using graphics to enhance the human visual system's ability to see patterns and trends. Similar pursuits are information visualization, data visualization, statistical graphics, information design, or information architecture. Infographics have evolved in recent years to be for mass communication, and thus are designed with fewer assumptions about the readers' knowledge base than other types of visualizations. Isotypes are an early example of infographics conveying information quickly and easily to the masses.
Senpai and kōhai are Japanese terms used to describe an informal hierarchical interpersonal relationship found in organizations, associations, clubs, businesses, and schools in Japan and expressions of Japanese culture worldwide. The senpai and kōhai relationship has its roots in Confucianism, but has developed a distinctive Japanese style. The term senpai can be considered a term in Japanese honorifics.

Business process modeling (BPM), mainly used in business process management; software development or systems engineering, is the action of capturing and representing processes of an enterprise, so that the current business processes may be analyzed, applied securely and consistently, improved, and automated. BPM is typically performed by business analysts, who provide expertise in the modeling discipline; by subject matter experts, who have specialized knowledge of the processes being modeled; or more commonly by a team comprising both. Alternatively, the process model can be derived directly from digital traces in IT systems using process mining tools.
A heterarchy is a system of organization where the elements of the organization are unranked (non-hierarchical) or where they possess the potential to be ranked a number of different ways. Definitions of the term vary among the disciplines: in social and information sciences, heterarchies are networks of elements in which each element shares the same "horizontal" position of power and authority, each playing a theoretically equal role. In biological taxonomy, however, the requisite features of heterarchy involve, for example, a species sharing, with a species in a different family, a common ancestor which it does not share with members of its own family. This is theoretically possible under principles of "horizontal gene transfer".
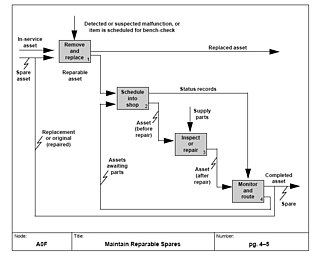
A data-flow diagram is a way of representing a flow of data through a process or a system. The DFD also provides information about the outputs and inputs of each entity and the process itself. A data-flow diagram has no control flow — there are no decision rules and no loops. Specific operations based on the data can be represented by a flowchart.
Business process mapping refers to activities involved in defining what a business entity does, who is responsible, to what standard a business process should be completed, and how the success of a business process can be determined.
Lateral communication is "the exchange, imparting or sharing of information, ideas or feelings between people within a community, peer groups, departments or units of an organization who are at or about the same hierarchical level as each other for the purpose of coordinating activities, efforts or fulfilling a common purpose or goal
In systems engineering, software engineering, and computer science, a function model or functional model is a structured representation of the functions within the modeled system or subject area.
Text and conversation is a theory in the field of organizational communication illustrating how communication makes up an organization. In the theory's simplest explanation, an organization is created and defined by communication. Communication "is" the organization and the organization exists because communication takes place. The theory is built on the notion, an organization is not seen as a physical unit holding communication. Text and conversation theory puts communication processes at the heart of organizational communication and postulates, an organization doesn't contain communication as a "causal influence", but is formed by the communication within. This theory is not intended for direct application, but rather to explain how communication exists. The theory provides a framework for better understanding organizational communication.

Classification chart or classification tree is a synopsis of the classification scheme, designed to illustrate the structure of any particular field.
The operations manual is the documentation by which an organisation provides guidance for members and employees to perform their functions correctly and reasonably efficiently. It documents the approved standard procedures for performing operations safely to produce goods and provide services. Compliance with the operations manual will generally be considered as activity approved by the persons legally responsible for the organisation.