Orienteering map

Last updated
Orienteering map Orienteringskort bygholm 2005.PNG
Orienteering map

An orienteering map is a map specially prepared for use in orienteering events. It is a large-scale topographic map with extra markings to help the participant navigate through the course.

Contents

These maps are much more detailed than general-purpose topographic maps, and incorporate a standard symbology that is designed to be useful to anyone, regardless of native language. In addition to indicating the topography of the terrain with contour lines, orienteering maps also show forest density, water features, clearings, trails and roads, earthen banks and rock walls, ditches, wells and pits, fences and power lines, buildings, boulders, and other features of the terrain.

Orienteering maps meant for competition in forested areas are usually 1:15 000 or 1:10 000 scale [1] and 1:4.000 for sprint-maps in cities and parks.

The International Orienteering Federation (IOF) publishes the standard for orienteering maps, including:

Orienteering map (not to IOF standard) marked for amateur radio direction finding, with a triangle at Start, large and small concentric circles at Finish, and two of five control points (hidden radio beacons). Beacon control points are shown for post-competition analysis; ARDF competitors must find the beacons. Ardf map.png
Orienteering map (not to IOF standard) marked for amateur radio direction finding, with a triangle at Start, large and small concentric circles at Finish, and two of five control points (hidden radio beacons). Beacon control points are shown for post-competition analysis; ARDF competitors must find the beacons.

Purpose

An orienteering map, and a compass, are the primary aids for the competitor to complete an orienteering course of control points as quickly as possible. [2] A map that is reliable and accurate is essential so that a course can be provided which will test the navigational skills of the competitor. The map also needs to be relevant to the needs of the competitor showing the terrain in neither too much nor too little detail.

Because the competition must test the navigational skills of the competitor, areas are sought which have a terrain that is rich in usable features. In addition, the area should be attractive and interesting. Notable examples in the US include Pawtuckaway State Park, New Hampshire and Valles Caldera, New Mexico, both having many boulders and boulder fields, and a wide variety of other terrain types.

Orienteering maps are produced by local orienteering clubs and are a valuable resource for the club. Orienteering maps are expensive to produce and the principal costs are: the fieldwork, drawing (cartography), and printing. Each of these can use up valuable resources of a club, be it in manpower or financial costs. Established clubs with good resources e.g. maps and manpower are usually able to host more events.

History

Orienteering map Orienteering map.jpg
Orienteering map

In the early days of orienteering, competitors used whatever maps were available; these were typically topographic maps from the national mapping agency. While national mapping agencies update their topographic maps on a regular basis, they are usually not sufficiently up to date for orienteering purposes. Gradually, specially drawn maps have been provided to meet the specific requirements of orienteering.

Maps produced specifically for orienteering show a more detailed and up-to-date description of terrain features. For example, large rocks above the soil surface do not normally appear on topographic maps but can be important features on many orienteering maps. New features such as fence lines can be important navigational aids and may also affect route choice. Orienteering maps include these new features.

Cartographer Jan Martin Larsen was a pioneer in the development of the specialized orienteering map.

Map content

The map scale depends on the purpose of the competition and also the standard used, for example, a map used in a foot orienteering long distance event has a scale of 1:15000. The map is printed in six base colours, [3] which cover the main groups: Land forms, rock and boulders, water and marsh, vegetation, and man-made features, and an extra colour for overprinting symbols.

Example of different land forms Land forms orienteering map.svg
Example of different land forms

Brown: Land forms

Land forms are shown using contour lines. The contour interval is normally 5 metres, but other interval such as 2 or 2.5 metres may be used in sprint maps. Additional symbols are provided to show e.g. earth bank, knoll, depression, small depression, pit, broken ground etc.

Black: Rock features

This group covers cliffs, boulders, boulder fields, and boulder clusters etc.

Blue: Water features

This group covers lakes, ponds, rivers, water channels, marshes, and wells etc.

Vegetation: White colour is forest, yellow is open area, and green indicates reduced runability. Example distinct vegetation boundary orienteering.png
Vegetation: White colour is forest, yellow is open area, and green indicates reduced runability.

Green/Yellow: Vegetation

This group covers vegetation. White is typically open runnable forest. Green means a forest of low visibility with reduced running speed, being graded from slow running, through difficult running, to impassable. Yellow colour shows open areas. Green vertical stripes are used to indicate undergrowth (slow or difficult running) but otherwise with good visibility.

Black: Man-made features

Man-made features include roads, tracks, paths, power lines, stone walls, fences, buildings, etc.

Technical symbols

Two technical symbols are required on all maps: Magnetic north lines printed in blue, and register crosses (these show that the printed colours are coincident). [2]

Other map information

Other information is required to be on the printed map although the presentation is not specified, e.g. scale, contour interval and scale bar. Good practice requires information such as date of survey, survey scale, copyright information, and proper credit for the people who produced the map (surveyor, cartographer).

Course Percorso di orientamento (ita).png
Course

Purple or Red: Overprinting symbols

Symbols are specified so that a course can be overprinted on the map. It includes symbols for the start, control points, control numbers, lines between control points, and finish. Extra symbols are available so that information relating to that event may be shown e.g. crossing points, forbidden route, first aid post, and refreshment point etc. These are not permanent features and cannot be included when the map is printed.

The International Specification for Orienteering Maps [2] sets out the specifications for orienteering maps for use in foot orienteering, together with specifications for the other sports governed by the International Orienteering Federation (IOF) i.e. mountain bike orienteering, ski orienteering, and trail orienteering. The specifications are mostly the same but with a few sport specific symbols e.g. ski-o needs to distinguish snow-covered roads from cleared roads.

Mapping process

The mapping process has four main stages: Creation of the base map, field-work, drawing, and printing.

Base map

The base map can be a topographic map made for other purposes e.g. mapping from the National Mapping Agency, or a photogrammetric plot produced from an aerial survey.

As LIDAR-surveying advances, base maps consisting of 1 meter contours and other data derived from the LIDAR data get more common. As these base maps contain large amounts of information the cartographic generalization becomes important in creating a readable map. [4]

Magnetic north

Cartographers use a projection to project the curved surface of the earth onto a flat surface. This generates a grid that is used as a base for national topographic mapping. The projection introduces a distortion so that grid north differs from true north; magnetic north is a natural feature that differs from both. As an example: at 52° 35' N 1° 10' E (approx 7 km west of Norwich, England) true north is 2° 33' west of grid north, and magnetic north is about 7° west of grid north. Magnetic north varies continually and in this example (1986) was reducing by about 12° in four years. [5] Orienteering maps are printed using magnetic north and this requires an adjustment to be made to the base map.

Field-work

Field-work is carried out using a small part of the base map fixed to a survey board, covered with a piece of draughting film, and drawn with pencils. Some map-drawing software has been adapted for making it easy to use a tablet to take notes in the field.

The final map needs to be drawn with sufficient accuracy so that a feature shown on the map can be identified clearly on the ground by the competitor, thus, field-workers need to locate features with a high level of accuracy, to ensure consistency between map and terrain. Where the map and terrain are inconsistent, the feature becomes unusable: no control point can be placed there. Periodic corrections to the map may be necessary, typically vegetation changes in forested areas.

Drawing (cartography)

Corrected topographic maps

The earliest orienteering maps used existing topographic maps e.g. United Kingdom Ordnance Survey 1:25 000 plans. These were cut down to a suitable size, corrected by hand, and then copied.

Hand-drawn orienteering maps

Hand-drawn maps

These were initially drawn by hand on tracing paper using one sheet for each of the five colours; the various dot or line screens being added using dry transfer screens, for example Letratone manufactured by Letraset in the UK. The map was drawn at twice final map scale, and photographically reduced to produce the five film positives for printing. This was a simple process that required very few specialist tools. Draughting film has replaced tracing paper. This is a plastic waterproof material etched on one side so that the ink will hold.

Scribed maps

This is the standard process used by National Mapping Agencies. It uses a plastic film, which is coated on one side with a photo-opaque film. The layer is removed with a scribing tool or scalpel to produce a negative image. One sheet of film is needed for each solid colour, and one for each screen, usually requiring about ten sheets of film altogether. The map is drawn at final map scale, and the negatives are printed with high quality dot screens to produce the five film positives for printing. The process makes it easy to produce high quality maps, but it does require a number of specialist tools.

Computer aided maps (digital cartography)

Computer software is available to aid in the drawing of digital maps. OCAD is the leading provider. Another one is opensource OpenOrienteering Mapper application, created by community as free alternative to OCAD. [6] Other computer software is available that will link with OCAD, or with the digital map files, so that courses can be incorporated into the map ready for printing.

Printing

Colour maps were sent to commercial printers for printing in five colours, with the overprinting being added after the map had been printed. This process was chosen as it gave a higher quality for the fine line-work than the industry standard four-colour process (CMYK). As computer and software technology has advanced, and the cost reduced, many clubs are now in a position to print their own maps. This enables clubs to print the six colours together (map and overprinting symbols) using that same four-colour process, but with a reduction in quality over traditional printing. Printing costs can be minimised by using standard stock sizes of paper e.g. A4 or Letter. It is important to use the correct type of paper: both the weight and the coating affect the usability of the final map.

Map accuracy and map quality

Map accuracy refers to the work of the surveyor (field-worker) and relates not so much to the positional accuracy of the survey but rather to its utility for the competitor. Map quality refers to the quality of the artwork. Many national bodies[ who? ] have a competition in which awards are made to cartographers after assessment by a national panel.

Related Research Articles

<span class="mw-page-title-main">Cartography</span> Study and practice of making maps

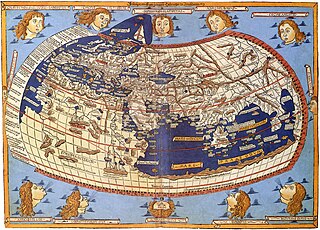
Cartography is the study and practice of making and using maps. Combining science, aesthetics and technique, cartography builds on the premise that reality can be modeled in ways that communicate spatial information effectively.

<span class="mw-page-title-main">Map</span> Symbolic depiction of relationships

A map is a symbolic depiction emphasizing relationships between elements of some space, such as objects, regions, or themes.

<span class="mw-page-title-main">Orienteering</span> Group of sports that requires navigational skills

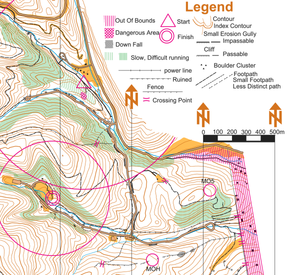
Orienteering is a group of sports that involve using a map and compass to navigate from point to point in diverse and usually unfamiliar terrain whilst moving at speed. Participants are given a topographical map, usually a specially prepared orienteering map, which they use to find control points. Originally a training exercise in land navigation for military officers, orienteering has developed many variations. Among these, the oldest and the most popular is foot orienteering. For the purposes of this article, foot orienteering serves as a point of departure for discussion of all other variations, but almost any sport that involves racing against a clock and requires navigation with a map is a type of orienteering.

<span class="mw-page-title-main">Topographic map</span> Medium to large scale map that shows a precise map of the terrain

In modern mapping, a topographic map or topographic sheet is a type of map characterized by large-scale detail and quantitative representation of relief features, usually using contour lines, but historically using a variety of methods. Traditional definitions require a topographic map to show both natural and artificial features. A topographic survey is typically based upon a systematic observation and published as a map series, made up of two or more map sheets that combine to form the whole map. A topographic map series uses a common specification that includes the range of cartographic symbols employed, as well as a standard geodetic framework that defines the map projection, coordinate system, ellipsoid and geodetic datum. Official topographic maps also adopt a national grid referencing system.

<span class="mw-page-title-main">Topography</span> Study of the forms of land surfaces

Topography is the study of the forms and features of land surfaces. The topography of an area may refer to the land forms and features themselves, or a description or depiction in maps.

<span class="mw-page-title-main">Nautical chart</span> Topographic map of a maritime area and adjacent coastal regions

A nautical chart or hydrographic chart is a graphic representation of a sea region or water body and adjacent coasts or banks. Depending on the scale of the chart, it may show depths of water (bathymetry) and heights of land (topography), natural features of the seabed, details of the coastline, navigational hazards, locations of natural and human-made aids to navigation, information on tides and currents, local details of the Earth's magnetic field, and human-made structures such as harbours, buildings, and bridges. Nautical charts are essential tools for marine navigation; many countries require vessels, especially commercial ships, to carry them. Nautical charting may take the form of charts printed on paper or computerized electronic navigational charts. Recent technologies have made available paper charts which are printed "on demand" with cartographic data that has been downloaded to the commercial printing company as recently as the night before printing. With each daily download, critical data such as Local Notices to Mariners are added to the on-demand chart files so that these charts are up to date at the time of printing.

<span class="mw-page-title-main">Contour line</span> Curve along which a 3-D surface is at equal elevation

A contour line of a function of two variables is a curve along which the function has a constant value, so that the curve joins points of equal value. It is a plane section of the three-dimensional graph of the function parallel to the -plane. More generally, a contour line for a function of two variables is a curve connecting points where the function has the same particular value.

<span class="mw-page-title-main">Geologic map</span> Special-purpose map to show geological features

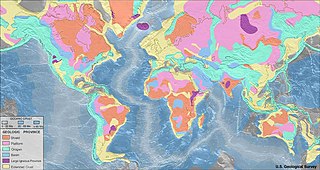
A geologic map or geological map is a special-purpose map made to show various geological features. Rock units or geologic strata are shown by color or symbols. Bedding planes and structural features such as faults, folds, are shown with strike and dip or trend and plunge symbols which give three-dimensional orientations features.

<span class="mw-page-title-main">Swisstopo</span> Swiss geological survey

Swisstopo is the official name for the Swiss Federal Office of Topography, Switzerland's national mapping agency.

<span class="mw-page-title-main">Thematic map</span> Type of map that visualizes data

A thematic map is a type of map that portrays the geographic pattern of a particular subject matter (theme) in a geographic area. This usually involves the use of map symbols to visualize selected properties of geographic features that are not naturally visible, such as temperature, language, or population. In this, they contrast with general reference maps, which focus on the location of a diverse set of physical features, such as rivers, roads, and buildings. Alternative names have been suggested for this class, such as special-subject or special-purpose maps, statistical maps, or distribution maps, but these have generally fallen out of common usage. Thematic mapping is closely allied with the field of Geovisualization.

<span class="mw-page-title-main">Terrain cartography</span> Representation of surface shape on maps

Terrain cartography or relief mapping is the depiction of the shape of the surface of the Earth on a map, using one or more of several techniques that have been developed. Terrain or relief is an essential aspect of physical geography, and as such its portrayal presents a central problem in cartographic design, and more recently geographic information systems and geovisualization.

<span class="mw-page-title-main">Stereoplotter</span>

A stereoplotter uses stereo photographs to determine elevations. It has been the primary method to plot contour lines on topographic maps since the 1930s. Although the specific devices have advanced technologically, they are all based on the apparent change in position of a feature in the two stereo photographs.

The Land Utilisation Survey of Britain was a comprehensive survey of land use in Great Britain in the 1930s. The survey was the first such comprehensive survey in Britain since the Domesday Book survey in the 11th century. A Second Land Use Survey was carried out in the 1960s. Subsequent work has mainly been based on satellite imagery, with sample field survey work for quality checking.

<span class="mw-page-title-main">Hachure map</span> Mode of representing relief on a map

Hachures are an older mode of representing relief. They show orientation of slope, and by their thickness and overall density they provide a general sense of steepness. Being non-numeric, they are less useful to a scientific survey than contours, but can successfully communicate quite specific shapes of terrain. They are a form of shading, although different from the one used in shaded maps.

<span class="mw-page-title-main">Ski orienteering</span> Winter sport combining cross-country skiing with orienteering

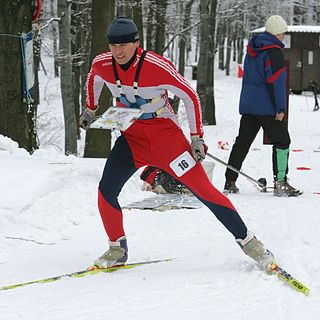
Ski orienteering (SkiO) is a cross-country skiing endurance winter racing sport and one of the four orienteering disciplines recognized by the IOF. A successful ski orienteer combines high physical endurance, strength and excellent technical skiing skills with the ability to navigate and make the best route choices while skiing at a high speed.

Planetary cartography, or cartography of extraterrestrial objects (CEO), is the cartography of solid objects outside of the Earth. Planetary maps can show any spatially mapped characteristic for extraterrestrial surfaces. Some well-known examples of these maps have been produced by the USGS, such as the latest Geologic Map of Mars, but many others are published in specialized scientific journals.

<span class="mw-page-title-main">Course (orienteering)</span>

An orienteering course is composed of a start point, a series of control points, and a finish point. Controls are marked with a white and orange flag in the terrain, and corresponding purple symbols on an orienteering map. The challenge is to complete the course by visiting all control points in the shortest possible time, aided only by the map and a compass.

<span class="mw-page-title-main">National mapping agency</span> Organisation that produces maps and geographic information of a country

A national mapping agency (NMA) is an organisation, usually publicly owned, that produces topographic maps and geographic information of a country. Some national mapping agencies also deal with cadastral matters.

<span class="mw-page-title-main">Topographic Atlas of Switzerland</span>

The Topographic Atlas of Switzerland, also known as the Siegfried Atlas or Siegfried Map is an official map series of Switzerland. Its publication was begun by the Federal Topographic Bureau under Hermann Siegfried, and continued from 1870 to 1926. During this period the individual maps were drawn by different lithographers, including Walter Hauenstein, Georg Christian von Hoven and Rudolf Leuzinger. Since it is, in today's parlance, not strictly an atlas but a map series, map historians now describe it only by the expression Siegfried Map.

<span class="mw-page-title-main">Cartographic design</span> Process of designing maps

Cartographic design or map design is the process of crafting the appearance of a map, applying the principles of design and knowledge of how maps are used to create a map that has both aesthetic appeal and practical function. It shares this dual goal with almost all forms of design; it also shares with other design, especially graphic design, the three skill sets of artistic talent, scientific reasoning, and technology. As a discipline, it integrates design, geography, and geographic information science.

References

  1. Zentai, László, ed. (2000) International Drawing Specifications for Orienteering Maps (ISOM2000) . International Orienteering Federation.
  2. 1 2 3 "International Specification for Orienteering Maps" (PDF). International Orienteering Federation. 2000. Retrieved 2011-12-03.
  3. ISOM 2017, page 10
  4. Turka, Janeta (2010). Using Laserscanning in Latvia . 14th International Conference on Orienteering Mapping.
  5. [United Kingdom] Ordnance Survey, 1:50 000 Landranger Series, sheet 144, 1984
  6. OpenOrienteering Mapper ICOM Presentation