Fundamental analysis, in accounting and finance, is the analysis of a business's financial statements ; health; and competitors and markets. It also considers the overall state of the economy and factors including interest rates, production, earnings, employment, GDP, housing, manufacturing and management. There are two basic approaches that can be used: bottom up analysis and top down analysis. These terms are used to distinguish such analysis from other types of investment analysis, such as quantitative and technical.
Investment is traditionally defined as the "commitment of resources to achieve later benefits". If an investment involves money, then it can be defined as a "commitment of money to receive more money later". From a broader viewpoint, an investment can be defined as "to tailor the pattern of expenditure and receipt of resources to optimise the desirable patterns of these flows". When expenditures and receipts are defined in terms of money, then the net monetary receipt in a time period is termed cash flow, while money received in a series of several time periods is termed cash flow stream.

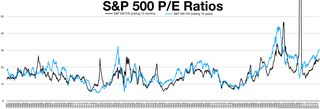
The price–earnings ratio, also known as P/E ratio, P/E, or PER, is the ratio of a company's share (stock) price to the company's earnings per share. The ratio is used for valuing companies and to find out whether they are overvalued or undervalued.
In finance, a growth stock is a stock of a company that generates substantial and sustainable positive cash flow and whose revenues and earnings are expected to increase at a faster rate than the average company within the same industry. A growth company typically has some sort of competitive advantage that allows it to fend off competitors. Growth stocks usually pay smaller dividends, as the companies typically reinvest most retained earnings in capital-intensive projects.
The dividend yield or dividend–price ratio of a share is the dividend per share divided by the price per share. It is also a company's total annual dividend payments divided by its market capitalization, assuming the number of shares is constant. It is often expressed as a percentage.
In financial markets, stock valuation is the method of calculating theoretical values of companies and their stocks. The main use of these methods is to predict future market prices, or more generally, potential market prices, and thus to profit from price movement – stocks that are judged undervalued are bought, while stocks that are judged overvalued are sold, in the expectation that undervalued stocks will overall rise in value, while overvalued stocks will generally decrease in value. A target price is a price at which an analyst believes a stock to be fairly valued relative to its projected and historical earnings.
Business valuation is a process and a set of procedures used to estimate the economic value of an owner's interest in a business. Here various valuation techniques are used by financial market participants to determine the price they are willing to pay or receive to effect a sale of the business. In addition to estimating the selling price of a business, the same valuation tools are often used by business appraisers to resolve disputes related to estate and gift taxation, divorce litigation, allocate business purchase price among business assets, establish a formula for estimating the value of partners' ownership interest for buy-sell agreements, and many other business and legal purposes such as in shareholders deadlock, divorce litigation and estate contest.
In finance, an investment strategy is a set of rules, behaviors or procedures, designed to guide an investor's selection of an investment portfolio. Individuals have different profit objectives, and their individual skills make different tactics and strategies appropriate. Some choices involve a tradeoff between risk and return. Most investors fall somewhere in between, accepting some risk for the expectation of higher returns. Investors frequently pick investments to hedge themselves against inflation. During periods of high inflation investments such as shares tend to perform less well in real terms.
Capitalization rate is a real estate valuation measure used to compare different real estate investments. Although there are many variations, the cap rate is generally calculated as the ratio between the annual rental income produced by a real estate asset to its current market value. Most variations depend on the definition of the annual rental income and whether it is gross or net of annual costs, and whether the annual rental income is the actual amount received, or the potential rental income that could be received if the asset was optimally rented.
The "Fed model", or "Fed Stock Valuation Model" (FSVM), is a disputed theory of equity valuation that compares the stock market's forward earnings yield to the nominal yield on long-term government bonds, and that the stock market – as a whole – is fairly valued, when the one-year forward-looking I/B/E/S earnings yield equals the 10-year nominal Treasury yield; deviations suggest over-or-under valuation.
In economics, valuation using multiples, or "relative valuation", is a process that consists of:
An undervalued stock is defined as a stock that is selling at a price significantly below what is assumed to be its intrinsic value. For example, if a stock is selling for $50, but it is worth $100 based on predictable future cash flows, then it is an undervalued stock. The undervalued stock has the intrinsic value below the investment's true intrinsic value.

Financial statement analysis is the process of reviewing and analyzing a company's financial statements to make better economic decisions to earn income in future. These statements include the income statement, balance sheet, statement of cash flows, notes to accounts and a statement of changes in equity. Financial statement analysis is a method or process involving specific techniques for evaluating risks, performance, valuation, financial health, and future prospects of an organization.
The Benjamin Graham formula is a formula for the valuation of growth stocks.
The price-to-book ratio, or P/B ratio, is a financial ratio used to compare a company's current market value to its book value. The calculation can be performed in two ways, but the result should be the same. In the first way, the company's market capitalization can be divided by the company's total book value from its balance sheet. The second way, using per-share values, is to divide the company's current share price by the book value per share. It is also known as the market-to-book ratio and the price-to-equity ratio, and its inverse is called the book-to-market ratio.
A financial ratio or accounting ratio states the relative magnitude of two selected numerical values taken from an enterprise's financial statements. Often used in accounting, there are many standard ratios used to try to evaluate the overall financial condition of a corporation or other organization. Financial ratios may be used by managers within a firm, by current and potential shareholders (owners) of a firm, and by a firm's creditors. Financial analysts use financial ratios to compare the strengths and weaknesses in various companies. If shares in a company are traded in a financial market, the market price of the shares is used in certain financial ratios.
In finance, the capital structure substitution theory (CSS) describes the relationship between earnings, stock price and capital structure of public companies. The CSS theory hypothesizes that managements of public companies manipulate capital structure such that earnings per share (EPS) are maximized. Managements have an incentive to do so because shareholders and analysts value EPS growth. The theory is used to explain trends in capital structure, stock market valuation, dividend policy, the monetary transmission mechanism, and stock volatility, and provides an alternative to the Modigliani–Miller theorem that has limited descriptive validity in real markets. The CSS theory is only applicable in markets where share repurchases are allowed. Investors can use the CSS theory to identify undervalued stocks.
Dividend policy is concerned with financial policies regarding paying cash dividend in the present or paying an increased dividend at a later stage. Whether to issue dividends, and what amount, is determined mainly on the basis of the company's unappropriated profit and influenced by the company's long-term earning power. When cash surplus exists and is not needed by the firm, then management is expected to pay out some or all of those surplus earnings in the form of cash dividends or to repurchase the company's stock through a share buyback program.
The cyclically adjusted price-to-earnings ratio, commonly known as CAPE, Shiller P/E, or P/E 10 ratio, is a valuation measure usually applied to the US S&P 500 equity market. It is defined as price divided by the average of ten years of earnings, adjusted for inflation. As such, it is principally used to assess likely future returns from equities over timescales of 10 to 20 years, with higher than average CAPE values implying lower than average long-term annual average returns.
In corporate finance, the present value of growth opportunities (PVGO) is a valuation measure applied to growth stocks. It represents the component of the company's stock value that corresponds to (expected) growth in earnings. It thus allows an analyst to assess the extent to which the share price represents the current business, and to what extent it reflects assumptions about the future. As a proportion of market cap, PVGO can then also be used in relative valuation, i.e. when comparing between two investments (see similar re PEG ratio).
