Under its commitment to the EU renewable energy directive of 2009, France has a target of producing 23% of its total energy needs from renewable energy by 2020. This figure breaks down to renewable energy providing 33% of energy used in the heating and cooling sector, 27% of the electricity sector and 10.5% in the transport sector. By the end of 2014, 14.3% of France's total energy requirements came from renewable energy, a rise from 9.6% in 2005. [1]
The outlook for renewable electricity in France received a boost following the publication in October 2016 of the "Programmation pluriannuelle de l'énergie", showing a commitment to re-balancing the electricity mix towards renewables. According to the report, renewable electricity capacity is planned to grow from 41 GW in 2014 to between 71 and 78 GW by 2023. [2] Historically the electricity sector in France has been dominated by the country's longstanding commitment to nuclear power. However, the report emphasizes that by 2025 more than half of France's nuclear power capacity will come from stations that will be 40 years or older, and subject to closure or refurbishment to extend their operation. Thus, there is a need to look to other sources, including renewables, to meet the expected generating-capacity shortfall. [3]
| 2014 | 2015 | 2016 | 2017 | 2018 | 2019 | 2020 | 2021 | 2022 | 2023 |
| 40,733 | 43,024 | 45,059 | 48,036 | 50,687 | 53,544 | 55,847 | 59,700 | 64,692 | 69,301 |
A key component of France's renewable target is the commitment to greatly increase energy efficiency, particularly for buildings and thermal insulation. Heat wastage is targeted to be reduced by 38% by 2020. The renewable targets are also intended to stimulate new trades and changes to existing trades to enable green growth. [1] The PPE plan targets the reduction of the consumption of primary fossil energy by 22% in 2023 from 2012 levels (reference scenario) or a fallback scenario of an 11% reduction under less-favorable conditions (variant scenario). [5] In terms of the reduction in primary consumption, petroleum products are targeted to fall by 23% between 2012 and 2023 (reference scenario) or 9.5% (variant scenario), gas by 16% (9% variant scenario) and coal by 37% (30% variant scenario). [5]
In the transport sector, France has a range of initiatives designed to promote renewable energy use and increase efficiency. These include changing transport behavior, such as increasing the amount of remote work. [6] By 2023, the country aims to have a fleet of 2.4 million rechargeable electric and hybrid vehicles and for 3% of heavy-duty applications to use natural gas vehicles (NGVs). Biofuels blended with petrol are set for 1.8% in 2018 and 3.4% in 2023, and for diesel 1% in 2018 and 2.3% in 2023. [6] By 2030, non-road freight transport is targeted to reach 20% of all goods. Initiatives to increase walking and cycling are also being undertaken. Carpooling and digital services will be promoted to increase occupancy rates to between 1.8 and 2 people by 2030. The country is also pursuing research and development of vehicular automation, particularly in public transport. [6]
| 2014 | 2018 | 2023 | ||
|---|---|---|---|---|
| low scenario | high scenario | |||
| Onshore wind | 9,300 | 15,000 | 21,800 | 26,000 |
| Offshore wind | 500 | 3,000 [7] | ||
| Marine energy floating wind turbines, underwater turbines etc. | 100 [8] | |||
| Solar PV | 5,300 | 10,200 | 18,200 | 20,200 |
| Hydroelectric | 25,300 | 25,300 | 25,800 | 26,050 |
| Bio energy | 357 | 540 | 790 | 1,040 |
| Methanisation | 85 | 137 | 237 | 300 |
| Geothermal power | 8 | 53 | ||
| Waste biogas from landfill and treatment works | ~1200 | ~1350 | ~1500 | |
| Total | 41,000 | 52,000 | 71,000 | 78,000 |
During 2016, renewable electricity accounted for 19.6% of France's total domestic power consumption, of which 12.2% was provided by hydroelectricity, 4.3% by wind power, 1.7% by solar power and 1.4% by bio energy. [9] According to the report "Programmation pluriannuelle de l'énergie" [2] renewable electricity capacity is targeted to grow from 41 GW capacity in 2014 to 52 GW by 2018 and between 71 and 78 GW by 2023. The target for 2023 includes a high and low scenario to take into account external factors such as cost and consultations that may affect future deployment. The sources that are planned to grow fastest are wind and solar photovoltaic (PV) power; 500 MW of offshore wind power is expected to be grid-connected by 2018. Onshore wind power is set to grow from around 9 GW in 2014 to between approximately 22 and 26 GW by 2023. Offshore wind power is targeted to grow from zero capacity in 2014 to between 3.5 GW and 9 GW by 2023, and up to an additional 2 GW of marine energy. Solar PV power is projected to grow from around 5.3 GW in 2014 to between 18.2 GW and 20.2 GW by 2023. Hydroelectric power is already well developed in France but is targeted to grow 500–750 MW by 2023.
| Geothermal (excluding low temperature heat pump applications) | 126 | |
| Solar | 159 | |
| Biomass | solid biomass | 8,552 |
| biogas | 109 | |
| bioliquids | 0 | |
| Total biomass | 8,661 | |
| Heat pump | aerothermal | 1,533 |
| geothermal & hydrothermal | 262 | |
| Total heat pump | 1,794 | |
| Total | 10,740 | |
Solid biomass accounted for the largest share of renewable energy consumption in the heating and cooling sector at 8,661 ktoe (thousand tonnes of oil equivalent) in 2014. The next-largest source was provided by heat pumps at 1,794 ktoe. Heat accounts for about 95% of the energy produced by solid biomass, while the remaining 5% is used to produce electricity. [11] Energy from wood and wood products accounts for almost all of this production, of which 73% is used to heat family dwellings. [11] During 2015, heat consumption in France (excluding dependencies) from solid biomass amounted to 8,836 ktoe, of which 8,115 ktoe were accounted for by direct use of end user, and 721 ktoe from district heating sources. [11] District heating networks were supplied during 2015 by both heat-only plants (326 ktoe), and combined heat and power plants (395 ktoe). [11]
The Thassalia marine geothermal plant is located in the Grand Port Maritime de Marseille and uses marine thermal energy to provide heating and cooling to buildings connected to its network. The first phase of the network was inaugurated in October 2016 and covered 150,000 square metres (1,600,000 sq ft). [12] The network is planned to be expanded to cover around 500,000 square metres (5,400,000 sq ft) of Marseille. [13] The plant pumps seawater from the port of Marseille and extracts the natural heat from the water using large-scale heat pumps to provide heating for the town. The process can be reversed to provide cooling during the hot Mediterranean summer. The project is regarded as a flagship example and it is hoped more will follow, including a much-larger geothermal marine project on the island of La Réunion to supply air conditioning utilizing seawater piped from 1,100 metres (3,600 ft). [12]
| Bioethanol/bio-ETBE | biofuels per Article 21(2) | 17 |
| imports | 109 | |
| Total biofuels | 474 | |
| Biodiesel | biofuels per Article 21(2) | 126 |
| imports | 786 | |
| Total biodiesel | 2,641 | |
| Hydrogen from renewables | 0 | |
| Renewable electricity | for road transport | 4 |
| for non-road transport | 229 | |
| Total | 233 | |
| Others (e.g.: biogas, vegetable oils) | 0 | |
| Total | 3,348 | |
Biodiesel provided the largest share of renewable energy in the transport sector at 2,641 ktoe in 2016. In the same year bioethanol provided the next-largest share at 474 ktoe followed by renewable electricity at 233 ktoe.
The stock of light-duty plug-in electric vehicles registered in France passed the 100,000-unit milestone in October 2016, making the country the second-largest plug-in market in Europe after Norway, and fifth worldwide. [14] [15]
Hydroelectric power is the largest single source of renewable electricity in France accounting for 12.2% of total domestic power consumption in 2016. [9] According to industry sources in 2014, there were around 2,600 hydroelectric plants of widely varying capacity accounting for 25,400 MW of installed capacity, 436 of these plants were run by EDF (Électricité de France, a French-based utility company largely owned by the state) and accounted for around 19,900 MW of the total capacity. [23]
| 2014 | 2015 | 2016 | 2017 | 2018 | 2019 | 2020 | 2021 | 2022 | 2023 |
| 25,526 | 25,552 | 25,621 | 25,707 | 25,727 | 25,868 | 25,954 | 25,991 | 25,964 | 25,881 |
In 2014 France was the world's tenth-largest producer of hydroelectricity, and Europe's second-largest after Norway, producing 69 TWh including pumped storage production. [10] [25] In 2016, aggregated hydroelectric plants of greater than 1 MW capacity of the run-of-the-river or poundage type accounted for 10,327 MW, the water reservoir type accounted for 8,231 MW and pumped-storage type 4,965 MW. [16]
| 2014 | 2015 | 2016 | 2017 | 2018 | 2019 | 2020 | 2021 | 2022 | 2023 |
| 9,201 | 10,298 | 11,567 | 11,567 | 14,900 | 16,427 | 17,535 | 18,551 | 20,811 | 22,196 |
France has the second-largest wind potential in Europe. [26] Wind power capacity grew from 3,577 MW in 2008 to 10,358 MW by 2015 as France continues to develop this potential. [27] As of year end 2015, all wind power in France is onshore, total onshore capacity is planned to more than double by 2023. [2] France is committed to developing a large offshore capability, with the first 500 MW of capacity scheduled to come online by 2018. [28] By 2023, France could have up to 11 GW of offshore wind and marine energy. [29]
In line with these goals, Belgium's Elicio and Germany's BayWa r.e. AG are planning to construct France's first commercial-scale floating wind farm by 2031, with an investment of up to €1 billion. This project, located off Brittany's coast, will consist of up to 13 turbines, each with a capacity of over 20 megawatts. This farm is expected to supply electricity to approximately 450,000 people at a guaranteed price of 86.45 euros per megawatt-hour. To secure their commitment, the consortium has also provided a €50 million bank guarantee to the French government. [30]
| 2008 | 2009 | 2010 | 2011 | 2012 | 2013 | 2014 | 2015 | 2016 | 2017 | 2018 | |
|---|---|---|---|---|---|---|---|---|---|---|---|
| Capacity (MW) | 104 | 289 | 1,197 | 2,949 | 4,060 | 4,673 | 5,660 | 6,549 | 7,165 | 8,610 | 9,466 |
| Generation (GWh) | 677 | 2,400 | 4,000 | 4,661 | 5,500 | 6,700 | 8,790 | 9,573 | 10,196 | ||
| Ref | [31] | [32] [33] | [34] [35] | [36] [37] | [38] [39] | [40] | [41] [42] | [43] | [44] | [45] | [45] |
Solar photovoltaic (PV) power grew from 104 MW capacity in 2008 to 6,549 MW by year end 2015 at which time France had the seventh-largest solar PV installed capacity in the world. [46] France and is set to undergo significant expansion of its solar power with a target of around 18–20 GW installed capacity by 2023. [47] In January 2016, President François Hollande and the Prime Minister of India, Narendra Modi, laid the foundation stone for the headquarters of the International Solar Alliance (ISA) in Gwalpahari, Gurgaon, India. The ISA will focus on promoting and developing solar energy and solar products for countries lying wholly or partially between the Tropic of Cancer and the Tropic of Capricorn.
In 2018, EDF had plans to invest up to €25 billion in PV power generation, and introduce green electricity tariffs. [48]
France opened Rance Tidal Power Station, the world's first tidal power station, in 1966. It remained the world's largest tidal station until 2011. Its 24 turbines reach a peak output of 240 MW with an annual output of around 500 GWh. The dam traverses the estuary of the Rance River in Brittany, connecting the tourist towns of Dinard and Saint Malo, providing both a roadbridge and footbridge. In addition the barrage is a popular destination in its own right amongst both tourists and anglers providing a pleasant walkway across the entire estuary.
| 2005 | 2008 | 2010 | 2011 | 2012 | 2013 | 2014 | 2015 | 2016 | 2017 | 2018 | 2019 | 2020 | |
|---|---|---|---|---|---|---|---|---|---|---|---|---|---|
| RES-H&C | 13.6% | 14.9% | 17.0% | 18.0% | 19.0% | 20.5% | 22.0% | 24.0% | 25.5% | 27.5% | 29.0% | 31.0% | 33.0% |
| RES-E | 13.5% | 14.0% | 15.5% | 16.0% | 17.0% | 18.0% | 19.0% | 20.5% | 21.5% | 23.0% | 24.0% | 25.5% | 27.0% |
| RES-T | 1.2% | 5.6% | 6.5% | 6.9% | 7.2% | 7.5% | 7.6% | 7.7% | 8.4% | 8.8% | 9.4% | 10.0% | 10.5% |
| Overall RES share | 9.6% | 11.4% | 12.5% | 13.5% | 14.0% | 15.0% | 16.0% | 17.0% | 18.0% | 19.5% | 20.5% | 22.0% | 23.0% |
Note: Percentage values are shares of renewable energy sources (RES) in the total domestic market for heating and cooling (H&C), electricity (E), and transport (T) sectors.
France has an overall target of producing 23% of its total energy needs from renewable energy by 2020, encompassing 33% in the heating and cooling sector, 27% in the electricity sector and 10.5% in the transport sector. [1]
| 2011 | 2012 | 2013 | 2014 | 2015 | 2016 | |
|---|---|---|---|---|---|---|
| RES-H&C | 15.8% | 17.2% | 17.8% | 17.9% | 19.8% | 21.1% |
| RES-E | 16.4% | 16.7% | 16.9% | 18.4% | 18.8% | 19.3% |
| RES-T | 6.9% | 7.1% | 7.0% | 7.6% | 8.3% | 8.6% |
| Overall RES share | 12.7% | 13.7% | 14.0% | 14.3% | 15.1% | 16.0% |
| Relative difference to target trajectory | -5.9% | -2.1% | -6.7% | -10.6% | -11.2% | -11.1% |
By 2016 France had achieved a 16.0% renewable energy share of its total energy use, a figure 11% below the target of 18.0% for that year. Figures for the transport sector was above its target while the heating and cooling and electricity sectors were below theirs.

Renewable energy progress in the European Union (EU) is driven by the European Commission's 2023 revision of the Renewable Energy Directive, which raises the EU's binding renewable energy target for 2030 to at least 42.5%, up from the previous target of 32%. Effective since November 20, 2023, across all EU countries, this directive aligns with broader climate objectives, including reducing greenhouse gas emissions by at least 55% by 2030 and achieving climate neutrality by 2050. Additionally, the Energy 2020 strategy exceeded its goals, with the EU achieving a 22.1% share of renewable energy in 2020, surpassing the 20% target.

Solar power is a growing source in the Portuguese energy mix. At the end of 2020, solar power installed capacity totalled 1.03 GW and represented 3.6% of total power generation in 2020.

Renewable energy in Spain, comprising bioenergy, wind, solar, and hydro sources, accounted for 15.0% of the Total Energy Supply (TES) in 2019. Oil was the largest contributor at 42.4% of the TES, followed by gas, which made up 25.4%.
Solar power consists of photovoltaics (PV) and solar thermal energy in the European Union (EU).

Energy in Belgium describes energy and electricity production, consumption and import in Belgium.
EDF Renewables is a wholly owned subsidiary of the French utility EDF Group, specializing in renewable energy production. As an integrated operator, the Group develops and finances the construction of renewable energy facilities, and manages operations and maintenance for its own account and for third parties.
The electricity sector in France is dominated by its nuclear power, which accounted for 71.7% of total production in 2018, while renewables and fossil fuels accounted for 21.3% and 7.1%, respectively. France has the largest share of nuclear electricity in the world, and together with renewable energy supplies, this has helped its grid achieve very low carbon intensity.
The Polish energy sector is the fifth largest in Europe. In 2023, the country consumed 167.52 TWh of electricity, a 3.44% year–on–year decrease from 2022. Out of this, 76.61 TWh came from hard coal, 34.57 TWh from lignite, 22 TWh from wind energy, and 13.65 TWh from gas, with the remainder coming from other sources, such as solar, biomass, and hydropower.
The France National Renewable Energy Action Plan, aligned with EU Directive 2009/28/EC, outlines France's commitment to reaching specific renewable energy targets by 2020. This includes achieving a 23% share of energy from renewable sources in its gross final energy consumption, with sector-specific targets of 33% in heating and cooling, 27% in electricity, and 10.5% in transport. To meet these goals, France has implemented measures such as modifying administrative procedures, providing tax reliefs and grants, and investing in energy-efficient railway infrastructure. Additionally, under this directive, EU Member States are required to submit biennial progress reports on the use and promotion of renewable energy, evaluating their progress towards national objectives.
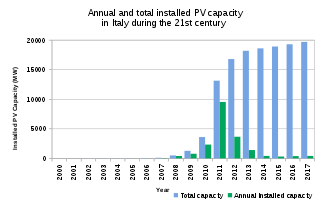
Solar power is an important contributor to electricity generation in Italy, accounting for 8% of the total in 2017. As of 2022, the country has a total installed capacity of 22.56 GW. In 2019, Italy set a national goal of reaching 50 GW by 2030.
Renewable energy has developed rapidly in Italy over the past decade and provided the country a means of diversifying from its historical dependency on imported fuels. Solar power accounted for around 8% of the total electric production in the country in 2014, making Italy the country with the highest contribution from solar energy in the world that year. Rapid growth in the deployment of solar, wind and bio energy in recent years lead to Italy producing over 40% of its electricity from renewable sources in 2014.

Despite the historic usage of wind power to drain water and grind grain, the Netherlands today lags 21 of the 26 other member states of the European Union in the consumption of energy from renewable sources. In 2022, the Netherlands consumed just 15% of its total energy from renewables. According to statistics published by Eurostat, it was the last among the EU countries in the shift away from global warming-inducing energy sources. The leading renewable sources in the country are biomass, wind, solar and both geothermal and aerothermal power. In 2018 decisions were made to replace natural gas as the main energy source in the Netherlands with increased electrification being a major part of this process.

The Czech Republic had almost two gigawatts (GW) of photovoltaic capacity at the end of 2010, but installed less than 10 megawatts (MW) in 2011 due to the feed-in tariff being reduced by 25%, after installing almost 1,500 MW the year before. Installations increased to 109 MW in 2012. In 2014, no new installations were reported.
Solar power in France including overseas territories reached an installed capacity figure of 11.2 GW in 2020, and rose further to 17.1 GW at the end of 2022. Government plans announced in 2022 foresee solar PV capacity in France rising to 100 GW by 2050.

Solar power generated 12% of Bulgaria’s electricity in 2023.

Solar power in Belgium reached an installed capacity of 9.9 GW at the end of 2023, an increase of 1.8 GW from 2022.

Solar power in Cyprus benefits from over 3,300 hours of sunlight annually, giving it the highest potential in the European Union (EU).

Solar energy in Poland includes the production of solar thermal energy and solar photovoltaics. By the end of 2021, there were around 3,000,000 square metres (32,000,000 sq ft) of installed solar thermal collectors which in Poland are primarily used for heating up household water.
Renewable energy in Greece accounted for 29 percent of its electricity from renewable sources in 2021. By 2030, renewables are expected to have a capacity of 28GW, and exceed 61 percent of Greece's electricity consumption. This is a significant increase from 8% of the country's total energy consumption in 2008. By 2022, Greece occasionally reached 100% renewables for a few hours. The target for 2050 is a capacity of 65GW.

Under the original 2009 Renewable Energy Directive Ireland had set a target of producing 16% of all its energy needs from renewable energy sources by 2020 but that has been updated by a second Renewable Energy Directive whose targets are 32% by 2030. Between 2005 and 2014 the percentage of energy from renewable energy sources grew from just 3.1% to 8.6% of total final consumption. By 2020 the overall renewable energy share was 13.5%, short of its Renewable Energy Drive target of 16%. Renewable electricity accounted for 69% of all renewable energy used in 2020, up from two thirds (66.8%) in 2019.
| Africa | |||||
|---|---|---|---|---|---|
| Asia | |||||
| Europe |
| ||||
| North America | |||||
| Oceania | |||||
| South America | |||||