Renewable energy is energy from renewable natural resources that are replenished on a human timescale. The most widely used renewable energy types are solar energy, wind power and hydropower. Bioenergy and geothermal power are also significant in some countries. Some also consider nuclear power a renewable power source, although this is controversial. Renewable energy installations can be large or small and are suited for both urban and rural areas. Renewable energy is often deployed together with further electrification. This has several benefits: electricity can move heat and vehicles efficiently, and is clean at the point of consumption. Variable renewable energy sources are those that have a fluctuating nature, such as wind power and solar power. In contrast, controllable renewable energy sources include dammed hydroelectricity, bioenergy, or geothermal power.

Renewable energy progress in the European Union (EU) is driven by the European Commission's 2023 revision of the Renewable Energy Directive, which raises the EU's binding renewable energy target for 2030 to at least 42.5%, up from the previous target of 32%. Effective since November 20, 2023, across all EU countries, this directive aligns with broader climate objectives, including reducing greenhouse gas emissions by at least 55% by 2030 and achieving climate neutrality by 2050. Additionally, the Energy 2020 strategy exceeded its goals, with the EU achieving a 22.1% share of renewable energy in 2020, surpassing the 20% target.
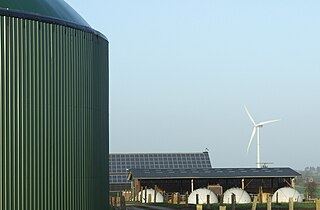
Renewable energy in Germany is mainly based on wind and biomass, plus solar and hydro. Germany had the world's largest photovoltaic installed capacity until 2014, and as of 2023 it has over 82 GW. It is also the world's third country by installed total wind power capacity, 64 GW in 2021 and second for offshore wind, with over 7 GW. Germany has been called "the world's first major renewable energy economy".

As of 2023, Europe had a total installed wind capacity of 255 gigawatts (GW). In 2017, a total of 15,680 MW of wind power was installed, representing 55% of all new power capacity, and the wind power generated 336 TWh of electricity, enough to supply 11.6% of the EU's electricity consumption.

As of 2018, renewable energy accounted for 79% of the domestically produced electricity used in Brazil.

Wind power in Romania has total cumulative installed capacity of 3,028 MW as of the end of 2016, up from the 14 MW installed capacity in 2009.

Wind power is a growing source of electricity in Poland. In 2019, wind was the second most important source of electricity produced in Poland, after coal, accounting for about 10% of the electricity production.
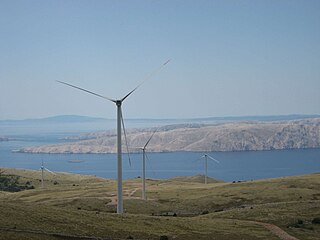
Wind power in Croatia has been growing since the first wind farm was installed in the country in 2004. During 2021, the energy produced from wind farms amounted to 1,904 GWh. The total wind power grid-connected capacity in Croatia was 1,143 MW as of 2023.

Energy in Belgium describes energy and electricity production, consumption and import in Belgium.

Energy in Croatia describes energy and electricity production, consumption and import in Croatia.
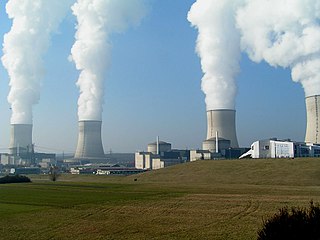
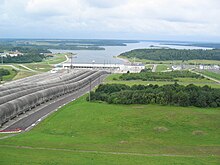
The electricity sector in France is dominated by its nuclear power, which accounted for 71.7% of total production in 2018, while renewables and fossil fuels accounted for 21.3% and 7.1%, respectively. France has the largest share of nuclear electricity in the world, and together with renewable energy supplies, this has helped its grid achieve very low carbon intensity.
Estonia's electricity sector is interconnected with regional energy markets, particularly through connections with Finland, Latvia, and Russia. The direct electrical interconnection with Finland was established in 2006 and was further strengthened by the Estlink 2 interconnector in 2014. Estonia joined the Nord Pool Spot market by 2012, securing its own price area within this regional electricity market.
The Polish energy sector is the fifth largest in Europe. By the end of 2023, the installed generation capacity had reached 55.216 GW, while electricity consumption for that year was 167.52 TWh and generation was 163.63 TWh, with 26% of this coming from renewables.
Lithuania is a net energy importer. In 2019 Lithuania used around 11.4 TWh of electricity after producing just 3.6 TWh.

Despite the historic usage of wind power to drain water and grind grain, the Netherlands today lags 21 of the 26 other member states of the European Union in the consumption of energy from renewable sources. In 2022, the Netherlands consumed just 15% of its total energy from renewables. According to statistics published by Eurostat, it was the last among the EU countries in the shift away from global warming-inducing energy sources. The leading renewable sources in the country are biomass, wind, solar and both geothermal and aerothermal power. In 2018 decisions were made to replace natural gas as the main energy source in the Netherlands with increased electrification being a major part of this process.
Under its commitment to the EU renewable energy directive of 2009, France has a target of producing 23% of its total energy needs from renewable energy by 2020. This figure breaks down to renewable energy providing 33% of energy used in the heating and cooling sector, 27% of the electricity sector and 10.5% in the transport sector. By the end of 2014, 14.3% of France's total energy requirements came from renewable energy, a rise from 9.6% in 2005.

Hungary is a member of the European Union and thus takes part in the EU strategy to increase its share of renewable energy. The EU has adopted the 2009 Renewable Energy Directive, which included a 20% renewable energy target by 2020 for the EU. By 2030 wind should produce in average 26-35% of the EU's electricity and save Europe €56 billion a year in avoided fuel costs. The national authors of Hungary forecast is 14.7% renewables in gross energy consumption by 2020, exceeding their 13% binding target by 1.7 percentage points. Hungary is the EU country with the smallest forecast penetration of renewables of the electricity demand in 2020, namely only 11%.

In 2008, Net electricity use in Portugal was 51.2 TWh. Portugal imported 9 TWh electricity in 2008. Population was 10.6 million.
Wind power generated 2% of electricity in 2023. By the end of 2020 almost 1 GW of onshore wind power had been installed. It has been estimated that there is potential for at least another 2 GW by 2030. The total wind power grid-connected capacity in Bulgaria was 702 MW as of 2023.

The electricity sector in Bulgaria is an important part of energy in Bulgaria and is highly diversified. As of 2021 nuclear power accounts for 34.7% of Bulgaria's power, coal power provides 39.4%, while renewable energy provides 15.8% of the country's electricity needs.