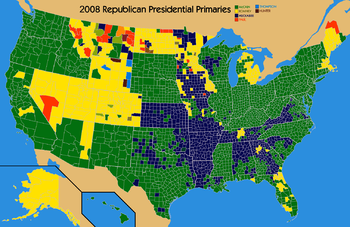
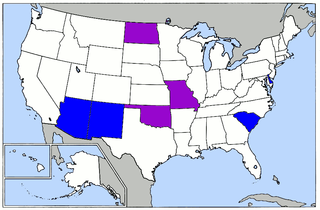
This article needs to be updated.(November 2010) |
2008 U.S. presidential election | |
---|---|
Democratic Party | |
Republican Party | |
Minor parties | |
Related races | |
| |
This article contains the results of the 2008 Republican presidential primaries and caucuses.
The 2008 Republican primaries were the selection processes by which the Republican Party selected delegates to attend the 2008 Republican National Convention. The series of primaries, caucuses, and state conventions culminated in the National Convention which was held in Saint Paul, Minnesota, September 1–4, 2008, where the delegates voted on and selected a candidate. A simple majority of delegate votes in September (1,191 out of 2,380) was required to become the party's nominee; estimates based on delegate pledges had John McCain surpassing this total after the March 4 primaries in Ohio, Rhode Island, Texas, and Vermont.
The only candidate with a national campaign at the end of the primary season was John McCain. Withdrawn candidates who had national campaigns were Ron Paul, Mike Huckabee, [1] Sam Brownback, John H. Cox, Jim Gilmore, Rudy Giuliani, Duncan Hunter, Mitt Romney, Tom Tancredo, Fred Thompson, and Tommy Thompson.
The data contained in the row entitled Actual pledged delegates is a subset of the data in the row entitled Estimated pledged delegates. It represents delegates won in contests where the final apportionment of delegates has already been decided, but does not include delegates from contests where the final apportionment depends upon the outcome of further caucuses or conventions. [2] Caveat lector: the below "Estimated total delegates" row totals 2,390 delegates, but there are only 2,380 delegates.
Candidates | Uncommitted | Mike Huckabee | John McCain | Ron Paul | Mitt Romney | Rudy Giuliani | Fred Thompson | Duncan Hunter | ||||||||||||
Final convention totals (1,191 to win of 2,380 total) [3] | 14 [n 1] 0.6% | 0 0% | 2,341 98.4% | 23 [n 2] 1.0% | 2 [n 3] 0.1% | 0 0% | 0 0% | 0 0% | ||||||||||||
Estimated total delegates (1,477 of 2,380; 62%, 1,191 to win) [4] | 903 38% | 267 15% | 1,367 66% | 21 1% | (274) 17% | – | (9) 1% | (1) 0% | ||||||||||||
Estimated unpledged delegates (51 of 463; 11% of 19%) [4] | 412 89% | 3 1% | 82 10% | – | – | – | – | – | ||||||||||||
Estimated pledged delegates (1,426 of 1,917, 74% of 81%) [5] | 491 26% | 229 12% | 1,243 47% | 21 1% | (274) 14% | – | (9) 0% | (1) 0% | ||||||||||||
Actual pledged delegates (1,167 of 1,451, 80% of 61%) [2] | 284 20% | 197 14% | 1,243 56% | 6 0% | (147) 10% | – | – | – | ||||||||||||
Jan. 3 | Iowa Delegates: 37 [6] [A] [B] | 3 | 17 34% | 3 13% | 2 10% | (12) 25% | 3% | (3) 13% | 0% | |||||||||||
Jan. 5 | Wyoming Delegates: 12 (of 14; was 12 of 28) [7] [C] | – | 0% | 0% | 0% | (8) 67% | 0% | (3) 25% | (1) 8% | |||||||||||
Jan. 8 | New Hampshire Delegates: 12 (was 24) [8] | – | 1 11% | 7 38% | 8% | (4) 32% | 9% | 1% | 1% | |||||||||||
Jan. 15 | Michigan Delegates: 30 (was 60) [9] | 2% | 1 16% | 5 30% | 6% | (24) 39% | 3% | 4% | 0% | |||||||||||
Jan. 19 | Nevada Delegates: 31 [10] [A] [B] | 3 | 3 8% | 4 13% | 4 14% | (17) 51% | 4% | (3) 8% | 2% | |||||||||||
South Carolina Delegates: 24 (was 47) [11] | – | 5 30% | 19 33% | 4% | 15% | 2% | 16% | 0% | ||||||||||||
Jan. 22 | Louisiana Delegates: 0 (of 44) [12] [B] [C] | 3 | – | – | – | – | – | – | – | |||||||||||
Jan. 29 | Florida Delegates: 57 (was 114) [13] | – | 13% | 57 36% | 3% | 31% | 15% | 1% | 0% | |||||||||||
Feb. 1–3 | Maine Delegates: 18 [14] [A] [B] | 3 2% | 6% | 21% | 18% | (18) 52% | 0% | 0% | 0% | |||||||||||
Jan. 25 – Feb. 5 | Hawaii Delegates: 20 [15] | 20 | – | – | – | – | – | – | – | |||||||||||
Feb. 5 Super Tuesday | Alabama Delegates: 45 [16] [B] | 12 0% | 20 41% | 16 37% | 3% | 18% | 0% | 0% | 0% | |||||||||||
Alaska Delegates: 26 [17] [B] | 3 2% | 6 22% | 3 16% | 5 17% | (12) 44% | – | – | – | ||||||||||||
Arizona Delegates: 50 [18] [B] | 3 | 9% | 50 47% | 4% | 35% | 3% | 2% | 0% | ||||||||||||
Arkansas Delegates: 31 [19] [B] | 3 0% | 29 60% | 1 20% | 5% | (1) 14% | 0% | 0% | – | ||||||||||||
California Delegates: 170 [20] [B] | 3 | 12% | 158 42% | 4% | (12) 35% | 4% | 2% | 0% | ||||||||||||
Colorado Delegates: 22 (of 43) [21] [B] [C] | 3 | 13% | 19% | 8% | (22) 60% | 0% | 0% | 0% | ||||||||||||
Connecticut Delegates: 27 [22] [B] | 3 2% | 7% | 27 52% | 4% | 33% | 2% | 0% | 0% | ||||||||||||
Delaware Delegates: 18 [23] | – | 15% | 18 45% | 4% | 33% | 3% | – | – | ||||||||||||
Georgia Delegates: 72 [24] | 9 | 51 34% | 9 32% | 3% | 9 30% | 1% | 0% | 0% | ||||||||||||
Illinois Delegates: 57 (of 67) [25] [B] [C] | 3 | 17% | 54 47% | 5% | (3) 29% | 1% | 1% | – | ||||||||||||
Massachusetts Delegates: 40 [26] [B] | 3 0% | 4% | 18 41% | 3% | (22) 51% | 1% | 0% | 0% | ||||||||||||
Minnesota Delegates: 38 [27] [A] [B] [C] | 3 | 20% | 23% | 16% | (38) 41% | – | – | – | ||||||||||||
Missouri Delegates: 58 [28] | 0% | 32% | 58 33% | 5% | 29% | 1% | 1% | 0% | ||||||||||||
Montana Delegates: 25 [29] | – | 15% | 22% | 25% | (25) 38% | – | – | – | ||||||||||||
New Jersey Delegates: 52 [30] | – | 8% | 52 55% | 5% | 28% | 3% | 1% | – | ||||||||||||
New York Delegates: 87 (of 98) [31] [B] [C] | 3 | 10% | 87 50% | 6% | 27% | 3% | – | – | ||||||||||||
North Dakota Delegates: 26 [32] | 0% | 5 20% | 6 23% | 6 21% | (9) 36% | – | – | – | ||||||||||||
Oklahoma Delegates: 38 [33] [B] | 3 | 6 33% | 32 37% | 3% | 25% | 1% | 1% | 0% | ||||||||||||
Tennessee Delegates: 40 (of 52) [34] [B] [C] | 3 0% | 25 34% | 19 32% | 6% | (8) 24% | 1% | 3% | 0% | ||||||||||||
Utah Delegates: 36 [35] [B] | 3 | 1% | 5% | 3% | (36) 89% | 0% | 0% | 0% | ||||||||||||
West Virginia Delegates: 18 (of 27) [36] [B] [C] | 3 | 18 52% | 1% | 0% | 47% | 0% | – | – | ||||||||||||
Feb. 9 | Kansas Delegates: 36 (of 36) [37] [C] | 0% | 36 60% | 24% | 11% | 3% | 0% | 0% | – | |||||||||||
Louisiana Delegates: 20 (of 44) [12] [B] [C] | 20 | 43% | 42% | 5% | 6% | 1% | 1% | 0% | ||||||||||||
Washington Delegates: 18 (of 37) [38] [B] [C] | 21 14% | 23% | 25% | 22% | 16% | – | – | – | ||||||||||||
Feb. 12 Potomac Primaries | District of Columbia Delegates: 16 [39] [B] | 3 | 16% | 16 68% | 8% | 6% | 1% | – | – | |||||||||||
Maryland Delegates: 37 [40] | – | 29% | 37 55% | 6% | 7% | 1% | 1% | 0% | ||||||||||||
Virginia Delegates: 60 [41] [B] | 3 | 41% | 60 50% | 5% | 4% | 0% | 1% | – | ||||||||||||
Feb. 16 | Louisiana Delegates: 21 (of 44) [12] [42] [43] [B] [C] | 6 | – | 15 | – | – | – | – | – | |||||||||||
Feb. 19 | Washington Delegates: 19 (of 37) [38] [B] [C] | 13 | 24% | 6 50% | 8% | 16% | 1% | 1% | 0% | |||||||||||
Wisconsin Delegates: 40 [44] [B] | 0% | 6 37% | 34 55% | 5% | 2% | 0% | 1% | 0% | ||||||||||||
Feb. 23 | American Samoa Delegates: 6 [45] [B] | 3 | – | 6 | – | – | – | – | – | |||||||||||
Northern Mariana Islands Delegates: 9 [46] [B] | – | 4% | 9 91% | 4% | – | – | – | – | ||||||||||||
Feb. 24 | Puerto Rico Delegates: 20 [47] [B] | 3 | 5% | 20 91% | 4% | – | – | – | – | |||||||||||
Mar. 4 | Ohio Delegates: 85 [48] [B] | 3 | 32%/31% | 55%/60% | 5%/5% | 5%/3% | - | 3%/2% | – | |||||||||||
Rhode Island Delegates: 17 [49] [B] | 3 2% | 4 22% | 13 65% | 7% | 4% | – | – | – | ||||||||||||
Texas Delegates: 137 [50] [B] | 3 1% | 16 38% | 80 51% | 5% | 2% | 0% | 1% | 1% | ||||||||||||
Vermont Delegates: 17 [51] | – | 14% | 17 72% | 7% | 5% | 2% | – | – | ||||||||||||
Mar. 8 | Guam Delegates: 6 [52] [B] | 3 | 0% | 6 100% | – 0% | – | – | – | – | |||||||||||
Mar. 11 | Mississippi Delegates: 36 [53] [B] | 3 | 13% | 36 79% | 4% | 2% | 1% | 2% | 0% | |||||||||||
Apr. 5 | Tennessee Delegates: 12 (of 52) [34] [B] [C] | – | – | – | – | – | – | – | – | |||||||||||
U. S. Virgin Islands Delegates: 6 [54] [B] | 9 47% | – | 31% | 2% | 19% | – | – | – | ||||||||||||
Apr. 22 | Pennsylvania Delegates: 62 (of 71) [55] [B] [C] | 3 | 11% | 73% | 16% | – | – | – | – | |||||||||||
May 6 | Indiana Delegates: 27 (of 54) [56] [B] [C] | 3 | 10% | 27 78% | 8% | 5% | – | – | – | |||||||||||
North Carolina Delegates: 69 [57] | 4% | 9 12% | 53 74% | 5 7% | – | – | – | – | ||||||||||||
May 13 | Nebraska Delegates: 33 [58] | – | – | 87% | 13% | – | – | – | – | |||||||||||
West Virginia Delegates: 9 (of 27) [36] [B] [C] | – | 10% | 76% | 5% | 4% | 2% | – | – | ||||||||||||
May 20 | Kentucky Delegates: 45 [59] | 5% | 8% | 42 72% | 7% | 5% | 2% | – | – | |||||||||||
Oregon Delegates: 30 [60] | – | – | 23 81% | 4 15% | – | – | – | – | ||||||||||||
May 20–21 | New York Delegates: 11 (of 98) [31] [B] [C] | – | – | – | – | – | – | – | – | |||||||||||
May 22 | Kansas Delegates: 10 (of 36) [37] [C] | – | – | – | – | – | – | – | – | |||||||||||
May 3–24 | Minnesota Delegates: 24 (of 38) [27] [B] [C] | – | – | – | – | – | – | – | – | |||||||||||
May 27 | Idaho Delegates: 32 [61] [B] | 9 | – | 17 70% | 6 24% | – | – | – | – | |||||||||||
May 31 | Wyoming Delegates: 2 (of 14; was 16 of 28) [7] [C] | – | – | – | – | – | – | – | – | |||||||||||
Jun. 3 | South Dakota Delegates: 24 [62] [B] | 3 | – | – | – | – | – | – | – | |||||||||||
New Mexico Delegates: 29 [63] [B] | 3 | – | – | – | – | – | – | – | ||||||||||||
May 24 – Jun. 7 | Colorado Delegates: 21 (of 43) [21] [B] [C] | – | – | – | – | – | – | – | – | |||||||||||
Jun. 6-7 | Pennsylvania Delegates: 9 (of 71) [55] [B] [C] | – | – | – | – | – | – | – | – | |||||||||||
Jun. 7 | Illinois Delegates: 10 (of 67) [25] [B] [C] | – | – | – | – | – | – | – | – | |||||||||||
Minnesota Delegates: 14 (of 38) [27] [B] [C] | – | – | – | – | – | – | – | – | ||||||||||||
Jun. 9–10 | Indiana Delegates: 27 (of 54) [64] [B] [C] | – | – | – | – | – | – | – | – | |||||||||||
|
Caucus date: January 3, 2008
National delegates: 37
Candidate | Votes | Percentage | National delegates |
---|---|---|---|
Mike Huckabee | 40,841 | 34.41% | 17 |
Mitt Romney | 29,949 | 25.23% | 12 |
Fred Thompson | 15,904 | 13.40% | 3 |
John McCain | 15,559 | 13.11% | 3 |
Ron Paul | 11,817 | 9.96% | 2 |
Rudy Giuliani | 4,097 | 3.45% | 0 |
Duncan Hunter | 524 | 0.44% | 0 |
Alan Keyes | 247 | 0.08% | 0 |
Tom Tancredo | 5 | 0.00% | 0 |
Total | 118,696 | 100.00% | 37 |
Official allocation of delegates will be decided during the state convention on June 14, 2008; until then, delegate allocations are estimates. [6]
According to his campaign Website, Alan Keyes's votes were not counted nor recorded by the Republican Party of Iowa. [66]
Convention date: January 5, 2008
National delegates: 12
Candidate | Percentage | National delegates |
---|---|---|
Mitt Romney | 67% | 8 |
Fred Thompson | 25% | 3 |
Duncan Hunter | 8% | 1 |
Rudy Giuliani | 0% | 0 |
Mike Huckabee | 0% | 0 |
John McCain | 0% | 0 |
Ron Paul | 0% | 0 |
Total | 100% | 12 |
Two additional national delegates will be elected at the state convention on May 10, 2008. Also, in accordance with Republican National Committee rules, Wyoming was stripped of half of its 28 delegates for holding primary contests before February 5, 2008. [7]
Votes were not released by the Wyoming Republican Party.
Primary date: January 8, 2008
National delegates: 12 (see note below)
In accordance with Republican National Committee rules, New Hampshire was stripped of half of its 24 delegates for holding primary contests before February 5, 2008. [68]
Candidate | Votes | Percentage | National delegates |
---|---|---|---|
John McCain | 88,571 | 37.01% | 7 |
Mitt Romney | 75,546 | 31.57% | 4 |
Mike Huckabee | 26,859 | 11.22% | 1 |
Rudy Giuliani | 20,439 | 8.54% | 0 |
Ron Paul | 18,308 | 7.65% | 0 |
Fred Thompson | 2,894 | 1.21% | 0 |
Duncan Hunter | 1,225 | 0.51% | 0 |
Alan Keyes | 203 | 0.08% | 0 |
Write-in candidates | 4,691 | 1.96% | 0 |
Total | 239,315 | 100.00% | 12 |
Primary date: January 15, 2008
National delegates: 30
In accordance with Republican National Committee rules, Michigan was stripped of 27 of its 57 delegates for holding primary contests before February 5, 2008. [68]
Candidate | Votes | Percentage | National delegates |
---|---|---|---|
Mitt Romney | 338,316 | 38.92% | 24 |
John McCain | 257,985 | 29.68% | 5 |
Mike Huckabee | 139,764 | 16.08% | 1 |
Ron Paul | 54,475 | 6.27% | 0 |
Fred Thompson | 32,159 | 3.70% | 0 |
Rudy Giuliani | 24,725 | 2.84% | 0 |
Duncan Hunter | 2,819 | 0.32% | 0 |
Tom Tancredo | 457 | 0.05% | 0 |
Sam Brownback | 351 | 0.04% | 0 |
Uncommitted | 18,118 | 2.08% | 0 |
Total | 869,169 | 100.00% | 30 |
Caucus date: January 19, 2008
National delegates: 31
Official allocation of delegates will be decided during the state convention on April 26, 2008; until then, delegate allocations are estimates. [10]
Tom Tancredo did appear on the official ballot, but Nevada Republican Party did not count or record votes cast for him. [10]
Candidate | Votes | Percentage | National delegates |
---|---|---|---|
Mitt Romney | 22,646 | 51.10% | 18 |
Ron Paul | 6,084 | 13.73% | 4 |
John McCain | 5,650 | 12.75% | 4 |
Mike Huckabee | 3,616 | 8.16% | 2 |
Fred Thompson | 3,519 | 7.94% | 2 |
Rudy Giuliani | 1,910 | 4.31% | 1 |
Duncan Hunter | 890 | 2.01% | 0 |
Tom Tancredo | Unrecorded | 0.00% | 0 |
Total | 44,315 | 100.00% | 31 |
Primary date: January 19, 2008
National delegates: 24 (see note below)
In accordance with Republican National Committee rules, South Carolina was stripped of 23 of its 47 delegates for holding primary contests before February 5, 2008. [68]
Candidate | Votes | Percentage | National delegates |
---|---|---|---|
John McCain | 147,686 | 33.15% | 19 |
Mike Huckabee | 132,943 | 29.84% | 5 |
Fred Thompson | 69,651 | 15.63% | 0 |
Mitt Romney | 68,142 | 15.30% | 0 |
Ron Paul | 16,154 | 3.63% | 0 |
Rudy Giuliani | 9,557 | 2.15% | 0 |
Duncan Hunter | 1,051 | 0.24% | 0 |
Tom Tancredo | 121 | 0.03% | 0 |
Hugh Cort | 88 | 0.02% | 0 |
John H. Cox | 83 | 0.02% | 0 |
Cap Fendig | 23 | 0.01% | 0 |
Total | 445,499 | 100.00% | 24 |
Caucus date: January 22, 2008
National delegates: 0 (see note below)
The Louisiana caucus is not considered an official race and all the state delegates chosen during the caucuses are nationally uncommitted, but they could run on one or multiple slates. Louisiana chooses 20 national delegates plus 3 PLEO delegates during the state convention on February 16, 2008. All the delegates elected at the state convention are officially considered uncommitted due to state party rules, but the delegation of John McCain is having the majority at the state convention since he won the majority of delegates in the districts 1, 2, 3, 6, and 7. So it is very likely that all 20 + 3 delegates will support John McCain.
The official results have not been released, and some media have reported that John McCain won, that Ron Paul took second, and that Mitt Romney took a distant third. [74] A slate of uncommitted delegates running on a pro-life platform was the overall winner. [75]
Caucus date: January 25 – February 5
National delegates: 20
Primary date: January 29, 2008
National delegates: 57 (see note below)
In accordance with Republican National Committee rules, Florida was stripped of 57 of its 114 delegates for holding primary contests before February 5, 2008. [68]
Candidate | Votes | Percentage | National delegates |
---|---|---|---|
John McCain | 701,761 | 36.0% | 57 |
Mitt Romney | 604,932 | 31.0% | 0 |
Rudy Giuliani | 286,089 | 14.7% | 0 |
Mike Huckabee | 262,681 | 13.5% | 0 |
Ron Paul | 62,887 | 3.2% | 0 |
Fred Thompson | 22,668 | 1.2% | 0 |
Alan Keyes | 4,060 | 0.2% | 0 |
Duncan Hunter | 2,847 | 0.1% | 0 |
Tom Tancredo | 1,573 | 0.1% | 0 |
Total | 1,949,498 | 100.00% | 57 |
Caucus date: February 9, 2008 – February 29, 2008 [77]
National delegates: 18
Official allocation of delegates will be decided during district caucuses and the state convention on May 3, 2008; until then, delegate allocations are estimates. [14]
Candidate | Votes | Percentage | National delegates |
---|---|---|---|
Mitt Romney | 2,837 | 51.66% | 18 |
John McCain | 1,176 | 21.41% | 0 |
Ron Paul | 1,002 | 18.24% | 0 |
Mike Huckabee | 318 | 5.79% | 0 |
Fred Thompson | 8 | 0.14% | 0 |
Rudy Giuliani | 3 | 0.05% | 0 |
Alan Keyes | 1 | 0.02% | 0 |
Duncan Hunter | 1 | 0.02% | 0 |
John H. Cox | 0 | 0.00% | 0 |
Write-in candidates | 9 | 0.16% | 0 |
Uncommitted | 136 | 2.47% | 0 |
Total | 5,491 | 100.00% | 18 |
Primary date: February 5, 2008
National delegates: 45
Candidate | Votes | Percentage | National delegates |
---|---|---|---|
Mike Huckabee | 230,608 | 40.90% | 20 |
John McCain | 210,989 | 37.42% | 16 |
Mitt Romney | 103,295 | 18.32% | 0 |
Ron Paul | 15,454 | 2.74% | 0 |
Rudy Giuliani | 2,224 | 0.39% | 0 |
Uncommitted | 1,252 | 0.22% | 0 |
Total | 563,822 | 100.00% | 36 |
Caucus date: February 5, 2008
National delegates: 26
Candidate | Votes | Percentage | National delegates |
---|---|---|---|
Mitt Romney | 5,126 | 44.00% | 12 |
Mike Huckabee | 2,548 | 22.00% | 6 |
Ron Paul | 1,955 | 17.00% | 5 |
John McCain | 1,804 | 15.00% | 3 |
Uncommitted | 187 | 2% | 0 |
Total | 11,260 | 100.00% | 26 |
Primary date: February 5, 2008
National delegates: 50
Candidate | Votes | Percentage | National delegates |
---|---|---|---|
John McCain | 227,764 | 48% | 50 |
Mitt Romney | 163,967 | 34% | 0 |
Mike Huckabee | 43,118 | 9% | 0 |
Ron Paul | 20,197 | 4% | 0 |
Rudy Giuliani | 12,716 | 3% | 0 |
Total | 467,762 | 100.00% | 50 |
Primary date: February 5, 2008
National delegates: 31
Candidate | Votes | Percentage | National delegates |
---|---|---|---|
Mike Huckabee | 130,541 | 60% | 29 |
John McCain | 44,091 | 20% | 1 |
Mitt Romney | 29,359 | 14% | 1 |
Ron Paul | 10,401 | 5% | 0 |
Uncommitted | 993 | 1% | 0 |
Rudy Giuliani | 625 | 0% | 0 |
Total | 216,010 | 100.00% | 31 |
Primary date: February 5, 2008
National delegates: 170
Candidate | Votes | Percentage | National delegates |
---|---|---|---|
John McCain | 1,197,757 | 42.21% | 158 |
Mitt Romney | 980,969 | 34.57% | 12 |
Mike Huckabee | 328,387 | 11.57% | 0 |
Rudy Giuliani | 126,415 | 4.45% | 0 |
Ron Paul | 120,374 | 4.24% | 0 |
Fred Thompson | 49,318 | 1.74% | 0 |
Duncan Hunter | 13,682 | 0.48% | 0 |
Alan Keyes | 11,362 | 0.40% | 0 |
Tom Tancredo | 3,810 | 0.13% | 0 |
John H. Cox | 3,101 | 0.11% | 0 |
Sam Brownback | 2,426 | 0.10% | 0 |
Total | 2,249,429 | 100.00% | 170 |
Caucus date: February 5, 2008
National delegates: 22 (see note below)
Colorado chooses 21 other delegates during district conventions from May 24 to June 7, 2008. [21]
Candidate | State delegates | Percentage | National delegates |
---|---|---|---|
Mitt Romney | 33,288 | 60% | 22 |
John McCain | 10,621 | 19% | 0 |
Mike Huckabee | 7,266 | 13% | 0 |
Ron Paul | 4,670 | 8% | 0 |
Total | 55,845 | 100.00% | 22 |
Primary date: February 5, 2008
National delegates: 27
Candidate | Votes | Percentage | National delegates |
---|---|---|---|
John McCain | 78,741 | 52% | 27 |
Mitt Romney | 49,851 | 33% | 0 |
Mike Huckabee | 10,591 | 7% | 0 |
Ron Paul | 6,092 | 4% | 0 |
Rudy Giuliani | 2,470 | 2% | 0 |
Uncommitted | 2,414 | 2% | 0 |
Total | 150,159 | 100% | 27 |
Primary date: February 5, 2008
National delegates: 18
Candidate | Votes | Percentage | National delegates |
---|---|---|---|
John McCain | 22,626 | 45.20% | 18 |
Mitt Romney | 16,344 | 32.65% | 0 |
Mike Huckabee | 7,706 | 15.39% | 0 |
Ron Paul | 2,131 | 4.26% | 0 |
Rudy Giuliani | 1,255 | 2.51% | 0 |
Total | 50,062 | 100.00% | 18 |
Primary date: February 5, 2008
National delegates: 72
Candidate | Votes | Percentage | National delegates |
---|---|---|---|
Mike Huckabee | 326,874 | 33.9% | 51 |
John McCain | 304,751 | 31.6% | 9 |
Mitt Romney | 290,707 | 30.2% | 3 |
Ron Paul | 28,096 | 2.9% | 0 |
Alan Keyes | 1,458 | 0.2% | 0 |
Rudy Giuliani | 7,162 | 0.7% | 0 |
Fred Thompson | 3,414 | 0.4% | 0 |
Duncan Hunter | 755 | 0.1% | 0 |
Tom Tancredo | 324 | 0.0% | 0 |
Total | 960,372 | 100% | 72 |
Primary date: February 5, 2008
National delegates: 57 (see note below)
Illinois chooses 10 other delegates during the state convention on June 7, 2008. [25]
Candidate | Votes | Percentage | National delegates |
---|---|---|---|
John McCain | 424,071 | 47.52% | 54 |
Mitt Romney | 256,805 | 28.77% | 3 |
Mike Huckabee | 147,626 | 16.54% | 0 |
Ron Paul | 45,166 | 5.06% | 0 |
Rudy Giuliani | 11,314 | 1.27% | 0 |
Fred Thompson | 7,100 | 0.80% | 0 |
Tom Tancredo | 369 | 0.04% | 0 |
Totals | 895,247 | 100% | 57 |
Primary date: February 5, 2008
National delegates: 40
Candidate | Votes | Percentage | National delegates |
---|---|---|---|
Mitt Romney | 255,248 | 51.50% | 22 |
John McCain | 204,027 | 41.16% | 18 |
Mike Huckabee | 19,168 | 3.87% | 0 |
Ron Paul | 13,210 | 2.67% | 0 |
Rudy Giuliani | 2,643 | 0.53% | 0 |
Fred Thompson | 942 | 0.19% | 0 |
Duncan Hunter | 263 | 0.05% | 0 |
Tom Tancredo | 155 | 0.03% | 0 |
Total | 497,531 | 100% | 40 |
Caucus date: February 5, 2008
National delegates: 0
Candidate | Votes | Percentage | Estimated delegates |
---|---|---|---|
Mitt Romney | 25,990 | 41.36% | 38 |
John McCain | 13,813 | 22.98% | 0 |
Mike Huckabee | 12,522 | 19.93% | 0 |
Ron Paul | 9,856 | 15.69% | 0 |
Rudy Giuliani | 2,643 | 0.53% | 0 |
Total | 62,837 | 100% | 38 |
This caucus is considered a non-binding straw poll. Minnesota chooses 24 delegates during district conventions from May 3 to May 24, 2008 and 14 delegates during the state convention on June 7, 2008. [27]
Primary date: February 5, 2008
National delegates: 58
Candidate | Votes | Percentage | National delegates |
---|---|---|---|
John McCain | 194,145 | 32.97% | 58 |
Mike Huckabee | 185,598 | 31.51% | 0 |
Mitt Romney | 172,414 | 29.28% | 0 |
Ron Paul | 26,428 | 4.49% | 0 |
Rudy Giuliani | 3,593 | 0.61% | 0 |
Fred Thompson | 3,101 | 0.53% | 0 |
Alan Keyes | 894 | 0.15% | 0 |
Duncan Hunter | 306 | 0.05% | 0 |
Tom Tancredo | 107 | 0.02% | 0 |
Other | 257 | 0.04% | 0 |
Uncommitted | 2,083 | 0.35% | 0 |
Total | 588,926 | 100.00% | 58 |
Caucus date: February 5, 2008
National delegates: 25
Candidate | State delegates | Percentage | National delegates |
---|---|---|---|
Mitt Romney | 625 | 38.39% | 25 |
Ron Paul | 400 | 24.57% | 0 |
John McCain | 358 | 21.99% | 0 |
Mike Huckabee | 245 | 15.04% | 0 |
Total | 1,628 | 100.00% | 25 |
Primary date: February 5, 2008
National delegates: 52
Candidate | Votes | Percentage | National delegates |
---|---|---|---|
John McCain | 313,459 | 55.36% | 52 |
Mitt Romney | 160,388 | 28.32% | 0 |
Mike Huckabee | 46,284 | 8.17% | 0 |
Ron Paul | 27,301 | 4.82% | 0 |
Rudy Giuliani | 15,516 | 2.74% | 0 |
Fred Thompson | 3,253 | 0.57% | 0 |
Total | 566,201 | 100.00% | 52 |
Primary date: February 5, 2008
National delegates: 87 (see note below)
New York chooses 11 other delegates during the state committee meeting from May 20 to May 21, 2008. [31]
Candidate | Votes | Percentage | National delegates |
---|---|---|---|
John McCain | 310,814 | 51.20% | 87 |
Mitt Romney | 168,801 | 27.81% | 0 |
Mike Huckabee | 65,648 | 10.81% | 0 |
Ron Paul | 38,918 | 6.41% | 0 |
Rudy Giuliani | 18,556 | 3.06% | 0 |
Fred Thompson | 2,047 | 0.34% | 0 |
Duncan Hunter | 954 | 0.16% | 0 |
Total | 607,011 | 100% | 87 |
Caucus date: February 5, 2008
National delegates: 26
Candidate | Votes | Percentage | Delegates [98] |
---|---|---|---|
Mitt Romney | 3,490 | 35.67% | 9 |
John McCain | 2,224 | 22.73% | 6 |
Ron Paul | 2,082 | 21.28% | 6 |
Mike Huckabee | 1,947 | 19.90% | 5 |
Alan Keyes | 42 | 0.43% | 0 |
Total | 9,785 | 100% | 26 |
Primary date: February 5, 2008
National delegates: 38
Candidate | Votes | Percentage | Delegates |
---|---|---|---|
John McCain | 122,748 | 36.64% | 32 |
Mike Huckabee | 111,865 | 33.39% | 6 |
Mitt Romney | 83,018 | 24.78% | 0 |
Ron Paul | 11,179 | 3.34% | 0 |
Rudy Giuliani | 2,412 | 0.72% | 0 |
Fred Thompson | 1,924 | 0.57% | 0 |
Alan Keyes | 817 | 0.24% | 0 |
Jerry R. Curry | 387 | 0.12% | 0 |
Duncan Hunter | 317 | 0.09% | 0 |
Tom Tancredo | 189 | 0.06% | 0 |
Daniel Ayers Gilbert | 124 | 0.04% | 0 |
Total | 334,980 | 100% | 38 |
Primary date: February 5, 2008
National delegates: 40 (see note below)
Tennessee chooses 12 other delegates during the state committee meeting on April 5, 2008. [34]
Candidate | Votes | Percentage | Estimated delegates |
---|---|---|---|
Mike Huckabee | 189,443 | 34.47% | 25 |
John McCain | 174,763 | 31.80% | 19 |
Mitt Romney | 129,722 | 23.61% | 8 |
Ron Paul | 30,730 | 5.59% | 0 |
Fred Thompson | 16,044 | 2.92% | 0 |
Rudy Giuliani | 5,100 | 0.93% | 0 |
Uncommitted | 1,812 | 0.33% | 0 |
Duncan Hunter | 738 | 0.13% | 0 |
Tom Tancredo | 192 | 0.03% | 0 |
Others | 971 | 0.18% | 0 |
Total | 549,515 | 100% | 52 |
Primary date: February 5, 2008
National delegates: 36
Candidate | Votes | Percentage | National delegates |
---|---|---|---|
Mitt Romney | 255,218 | 90% | 36 |
John McCain | 15,264 | 5% | 0 |
Ron Paul | 8,295 | 3% | 0 |
Mike Huckabee | 4,054 | 1% | 0 |
Rudy Giuliani | 928 | 0% | 0 |
Total | 283,759 | 100.00% | 36 |
Caucus date: February 5, 2008
National delegates: 18 (see note below)
West Virginia chooses nine other delegates during a primary on May 13, 2008. [36]
Candidate | State delegates | Percentage | National delegates |
---|---|---|---|
Mike Huckabee | 567 | 51.55% | 18 (15) |
Mitt Romney | 521 | 47.36% | 0 |
John McCain | 12 | 1.09% | 0 |
Ron Paul | 0 | 0.00% | 0 (3) |
Rudy Giuliani | 0 | 0.00% | 0 |
Total | 1,100 | 100% | 18 |
Caucus date: February 9, 2008
National delegates: 36 (see note below)
Candidate | Votes | Percentage | National delegates |
---|---|---|---|
Mike Huckabee | 11,627 | 60% | 33 |
John McCain | 4,587 | 24% | 0 |
Ron Paul | 2,182 | 11% | 0 |
Mitt Romney | 653 | 3% | 0 |
Alan Keyes | 288 | 1% | 0 |
Uncommitted | 84 | 0% | 0 |
Fred Thompson | 61 | 0% | 0 |
Rudy Giuliani | 34 | 0% | 0 |
Total | 19,516 | 100% | 36 |
Kansas chooses three other delegates during the state committee meeting on May 22, 2008. [37]
Primary date: February 9, 2008
National delegates: 20 (see note below)
Party rules in Louisiana would give the winner (with more than 50%) of the primary all 20 delegates as pledged delegates, chosen at the primary February 9, 2008. Since no candidate won the primary with this majority, the 20 delegates selected at the state convention will be official uncommitted delegates to the RNC. In addition, Louisiana holds an unofficial caucus on January 22, 2008 where in each of the seven districts 15 delegates where chosen to the state convention. Each district delegation is choosing three pledged delegates for the RNC. John McCain received the majority in the districts 1,2,3,6 and 7, so he won 15 pledged delegates. [106]
Caucus date: February 9, 2008
National delegates: 18
Washington's 18 delegates chosen at the caucus are not bound to a candidate. Washington chooses 19 other delegates during a primary on February 19, 2008. [38]
Primary date: February 12, 2008
National delegates: 16
Candidate | Votes | Percentage | National delegates |
---|---|---|---|
John McCain | 3,967 | 67.55% | 16 |
Mike Huckabee | 984 | 16.75% | 0 |
Ron Paul | 477 | 8.12% | 0 |
Mitt Romney | 354 | 6.03% | 0 |
Rudy Giuliani | 91 | 1.55% | 0 |
Total | 5,873 | 100.00% | 16 |
Primary date: February 12, 2008
National delegates: 37
Candidate | Votes | Percentage | National delegates |
---|---|---|---|
John McCain | 171,528 | 54.88% | 37 |
Mike Huckabee | 89,151 | 28.53% | 0 |
Mitt Romney | 21,849 | 6.99% | 0 |
Ron Paul | 18,602 | 5.95% | 0 |
Rudy Giuliani | 4,384 | 1.40% | 0 |
Alan Keyes | 3,285 | 1.05% | 0 |
Fred Thompson | 2,853 | 0.91% | 0 |
Duncan Hunter | 514 | 0.16% | 0 |
Tom Tancredo | 361 | 0.12% | 0 |
Total | 312,527 | 100.00% | 37 |
Primary date: February 12, 2008
National delegates: 60
Candidate | Votes | Percentage | National delegates |
---|---|---|---|
John McCain | 243,981 | 50.05% | 60 |
Mike Huckabee | 198,787 | 40.78% | 0 |
Ron Paul | 21,867 | 4.49% | 0 |
Mitt Romney | 17,500 | 3.59% | 0 |
Fred Thompson | 3,368 | 0.69% | 0 |
Rudy Giuliani | 1,975 | 0.40% | 0 |
Total | 487,478 | 100.00% | 60 |
Convention date: February 16, 2008
National delegates: 23 (see note below)
Since there was no majority of votes (more than 50% for one candidate) primary on February 9, 2008, the right of determining the 20n delegates went to the state convention. Due to party state rules these 20 delegates will be going to the RNC as uncommitted delegates. In addition, Louisiana held an unofficial caucus on January 22, 2008, where 21 other delegates were selected . [12]
Primary date: February 19, 2008
National delegates: 19 (see note below)
Washington chooses 18 other delegates during caucuses on February 9, 2008. [38]
Candidate | Votes | Percentage | National delegates |
---|---|---|---|
John McCain | 202,219 | 49.11% | 0 |
Mike Huckabee | 90,988 | 22.10% | 0 |
Mitt Romney | 77,925 | 18.93% | 0 |
Ron Paul | 30,577 | 7.43% | 0 |
Rudy Giuliani | 4,117 | 1.00% | 0 |
Fred Thompson | 3,539 | 0.86% | 0 |
Alan Keyes | 1,617 | 0.39% | 0 |
Duncan Hunter | 768 | 0.19% | 0 |
Total | 411,750 | 100.00% | 0 |
Primary date: February 19, 2008
National delegates: 37
Candidate | Votes | Percentage | National delegates |
---|---|---|---|
John McCain | 224,206 | 55.68% | 34 |
Mike Huckabee | 151,201 | 37.55% | 6 |
Ron Paul | 19,210 | 4.77% | 0 |
Mitt Romney | 8,082 | 2.00% | 0 |
Total | 402,699 | 100.00% | 40 |
Caucus date: February 23, 2008
National delegates: 9
Candidate | Votes | Percentage | National delegates |
---|---|---|---|
John McCain | 9 | N/A% | 9 |
Mike Huckabee | N/A% | 0 | |
Ron Paul | N/A% | 0 | |
Mitt Romney | N/A% | 0 | |
Total | 9 | 100.00% | 9 |
Convention date: February 23, 2008
National delegates: 9
Candidate | Votes | Percentage | National delegates |
---|---|---|---|
John McCain | 105 | 91.30% | 9 |
Mike Huckabee | 5 | 4.38% | 0 |
Ron Paul | 5 | 4.38% | 0 |
Mitt Romney | 0 | 0.00% | 0 |
Total | 115 | 100.00% | 9 |
Caucus date: February 24, 2008
National delegates: 20
Candidate | Votes | Percentage | National delegates |
---|---|---|---|
John McCain | 188 | 90.38% | 20 |
Mike Huckabee | 10 | 4.80% | 0 |
Ron Paul | 9 | 4.32% | 0 |
Mitt Romney | 0 | 0.00% | 0 |
Total | 208 | 100.00% | 20 |
Primary date: March 4, 2008
National delegates: 85
Candidate | Votes | Percentage | National delegates |
---|---|---|---|
John McCain | 636,256 | 60% | 79 |
Mike Huckabee | 325,581 | 31% | 0 |
Ron Paul | 49,027 | 5% | 0 |
Total | 1,010,864 | 100% | 79 |
Primary date: March 4, 2008
National delegates: 17
Candidate | Votes | Percentage | National delegates |
---|---|---|---|
John McCain | 17,468 | 68.1% | 13 |
Mike Huckabee | 5,839 | 22.8% | 4 |
Ron Paul | 1,775 | 6.9% | 0 |
Uncommitted | 567 | 2.2% | 0 |
Total | 25,649 | 100 | 17 |
Primary date: March 4, 2008
National delegates: 137
Candidate | Votes | Percentage | National delegates |
---|---|---|---|
John McCain | 707,622 | 51% | 80 |
Mike Huckabee | 521,950 | 38% | 16 |
Ron Paul | 69,824 | 5% | 0 |
Total | 1,380,907 | 94% | 96 |
Primary date: March 4, 2008
National delegates: 17
Candidate | Votes | Percentage | National delegates |
---|---|---|---|
John McCain | 28,488 | 77.6% | 17 |
Mike Huckabee | 5,615 | 15.3% | 0 |
Ron Paul | 2,627 | 7.1% | 0 |
Total | 36,730 | 100% | 17 |
Caucus date: March 8, 2008
National delegates: 6
Candidate | Votes | Percentage | National delegates |
---|---|---|---|
John McCain | 9 | 100.0% | 6 |
Ron Paul | 0 | 0% | 0 |
Mike Huckabee | 0 | 0% | 0 |
Total | - | 100.00% | 6 |
Primary date: March 11, 2008
National delegates: 36
Candidate | Votes | Percentage | National delegates |
---|---|---|---|
John McCain | 113,074 | 79.0% | 36 |
Mike Huckabee | 17,943 | 13.0% | 0 |
Ron Paul | 5,510 | 4.0% | 0 |
Total | 136,527 | 100.00% | 36 |
Committee meeting date: March 1, 2008
National delegates: 39 (see note below)
Tennessee chooses 13 other delegates during the state committee meeting on March 1, 2008. [34]
Caucus date: April 5, 2008
National delegates: 6
Candidate | Votes | Percentage | National delegates |
---|---|---|---|
John McCain | 102 | 31.5% | 0 |
Mitt Romney | 60 | 18.5% | 0 |
Ron Paul | 9 | 2.8% | 0 |
Uncommitted | 153 | 47.2% | 6 |
Total | 324 | 100 | 6 |
Primary date: April 22, 2008
National delegates: 62 (see note below)
Candidate | Votes | Percentage | National delegates |
---|---|---|---|
John McCain | 587,210 | 73% | 74* |
Ron Paul | 128,483 | 16% | 0 |
Mike Huckabee | 91,430 | 11% | 0 |
Total | 807,123 | 100% | 74 |
* Delegates are essentially elected as unpledged to the national convention in the Pennsylvania primary.
Convention date: May 3, 2008 – May 24, 2008
National delegates: 24 (see note below)
Minnesota chooses 14 other delegates during the state convention on June 7, 2008. In addition, Minnesota holds non-binding caucuses on February 5, 2008. [27]
Primary date: May 6, 2008
National delegates: 27 (see note below)
Indiana chooses 27 other delegates during the state convention from June 9 to June 10, 2008. [64]
Primary date: May 6, 2008
National delegates: 69
Primary date: May 13, 2008
National delegates: 33
Primary date: May 13, 2008
National delegates: 9 (see note below)
West Virginia chooses 18 other delegates during caucuses on February 5, 2008. [36]
Candidate | Votes | Percentage | Delegates |
---|---|---|---|
John McCain | 89,683 | 76.0% | 9 |
Mike Huckabee* | 12,175 | 10.3% | 0 |
Ron Paul | 5,914 | 5.0% | 0 |
Mitt Romney* | 5,188 | 4.4% | 0 |
Rudolph Giuliani* | 2,831 | 2.4% | 0 |
Alan Keyes | 1,427 | 1.2% | 0 |
Others | 727 | 0.6% | 0 |
Total | 117,945 | 100% | 9 |
*Candidate suspended campaign prior to this primary
Primary date: May 20, 2008
National delegates: 45
Candidate | Votes | Percentage | National delegates |
---|---|---|---|
John McCain | 142,918 | 72.26% | 42 |
Mike Huckabee | 16,388 | 8.29% | 0 |
Ron Paul | 13,427 | 6.79% | 0 |
Mitt Romney | 9,206 | 4.65% | 0 |
Rudy Giuliani | 3,055 | 1.54% | 0 |
Alan Keyes | 2,044 | 1.03% | 0 |
Meeting dates: May 20, 2008 – May 21, 2008
National delegates: 11 (see note below)
New York chooses 87 other delegates during a primary on February 5, 2008. [31]
Primary date: May 20, 2008
National delegates: 30
Meeting date: May 22, 2008
National delegates: 10
Kansas chooses 26 other delegates during a primary on February 9, 2008. [37]
Convention dates: May 24, 2008 – June 7, 2008
National delegates: 21 (see note below)
Colorado chooses 22 other delegates during caucuses on February 5, 2008. [21]
Primary date: May 27, 2008
National delegates: 26
Candidate | Votes | Percentage | Delegates |
---|---|---|---|
John McCain | 87,460 | 69.65% | 17 |
Ron Paul | 29,785 | 23.72% | 6 |
Uncommitted | 8,325 | 6.63% | 1 |
Convention date: May 31, 2008
National delegates: 2 (see note below)
Wyoming held county conventions on January 5, 2008 to choose 12 other delegates. Also, in accordance with Republican National Committee rules, Wyoming was stripped of half of its 28 delegates for holding primary contests before February 5, 2008. [7]
Primary date: June 3, 2008
National delegates: 24
Primary date: June 3, 2008
National delegates: 29
Meeting date: June 6, 2008 – June 7, 2008
National delegates: 9 (see note below)
Pennsylvania chooses 62 other delegates during a primary on April 22, 2008. [55]
Convention date: June 7, 2008
National delegates: 10 (see note below)
Illinois chooses 57 other delegates during a primary on February 5, 2008. [25]
Convention date: June 7, 2008
National delegates: 14 (see note below)
Minnesota chooses 24 other delegates during district conventions from May 3 to May 24, 2008. In addition, Minnesota holds non-binding caucuses on February 5, 2008. [27]
Convention dates: June 9, 2008 – June 10, 2008
National delegates: 27 (see note below)
Indiana chooses 27 other delegates during a primary on May 6, 2008. [64]
Convention date: July 12, 2008
National delegates: 33 (see note below)
Nebraska's National Convention delegates are not bound by the results of the Presidential Preference Primary held on May 13, 2008. [58]
Each of the 50 U.S. states, the District of Columbia, and territories of the United States holds either primary elections or caucuses to help nominate individual candidates for president of the United States. This process is designed to choose the candidates that will represent their political parties in the general election.
Mini-Tuesday was the name given to the February 3, 2004 U.S. presidential primary where several states, which to that point had participated in "Super Tuesday," cast their votes for the Presidential nominees of the 2004 Presidential election. Mini-Tuesday was also called Super Tuesday I. With the large number of states moving their election dates up to Mini-Tuesday for the 2008 election cycle, pundits have largely shied away from using the term again, instead choosing to reappropriate the term "Super Tuesday" to better represent the primaries held on that approximate date. The date is also known as "Super Duper Tuesday," "Giga Tuesday," and "Tsunami Tuesday," among others, with the term "Mini Tuesday" falling to apparent disuse for the time being.
The 2008 Iowa Democratic presidential caucus occurred on January 3, and was the state caucuses of the Iowa Democratic Party. It was the first election for the Democrats of the 2008 presidential election. Also referred to as "the First in the Nation Caucus," it was the first election of the primary season on both the Democratic and Republican sides. Of the eight major Democratic presidential candidates, then-U.S. Senator Barack Obama of Illinois received the most votes and was ultimately declared the winner of the Iowa Democratic Caucus of 2008, making him the first African American to win the caucus and the first African American to win a primary state since Jesse Jackson in 1988. Former U.S. Senator John Edwards of North Carolina came in second place and then-U.S. Senator Hillary Clinton of New York finished third, though Clinton received more delegates than Edwards. Campaigning had begun as early as two years before the event.
From January 3 to June 3, 2008, voters of the Republican Party chose their nominee for president in the 2008 United States presidential election. Senator John McCain of Arizona was selected as the nominee through a series of primary elections and caucuses culminating in the 2008 Republican National Convention held from Monday, September 1, through Thursday, September 4, 2008, in Saint Paul, Minnesota. President George W. Bush was ineligible to be elected to a third term due to the term limits established by the 22nd Amendment.
The results of the 2008 Democratic Party presidential primaries are the detailed outcomes of a series of contests by which members of the United States Democratic Party chose their candidate for the 2008 U.S. presidential election. The contests are held in each of the fifty U.S. states, as well as the District of Columbia, Puerto Rico, American Samoa, Guam, the U.S. Virgin Islands, and Democrats Abroad. The Northern Mariana Islands was the lone U.S. state or territory which did not have a primary or caucus election in 2008. The outcomes include totals of delegates selected as well as popular votes.
The 2008 West Virginia Republican presidential caucuses took place on February 5, 2008, to select 18 delegates to the 2008 Republican National Convention. An additional nine delegates were selected in a primary election on May 13, 2008, for a total of 27 delegates to the national convention. Mike Huckabee won the caucuses, and John McCain later won the primary.
The 2008 North Dakota Democratic presidential caucuses took place on February 5, 2008, one of the many Super Tuesday nominating contests held that day. Barack Obama won the caucuses, securing 8 out of 13 national delegates.
Voters of the Republican Party elected state delegations to the 2012 Republican National Convention in presidential primaries. The national convention then selected its nominee to run for President of the United States in the 2012 presidential election. There were 2,286 delegates chosen, and a candidate needed to accumulate 1,144 delegate votes at the convention to win the nomination. The caucuses allocated delegates to the respective state delegations to the national convention, but the actual election of the delegates were, many times, at a later date. Delegates were elected in different ways that vary from state to state. They could be elected at local conventions, selected from slates submitted by the candidates, selected at committee meetings, or elected directly at the caucuses and primaries.
From January 3 to June 5, 2012, voters of the Democratic Party chose its nominee for president in the 2012 United States presidential election. President Barack Obama won the Democratic Party nomination by securing more than the required 2,383 delegates on April 3, 2012, after a series of primary elections and caucuses. He was formally nominated by the 2012 Democratic National Convention on September 5, 2012, in Charlotte, North Carolina.
The 2012 United States presidential election in Maine took place on November 6, 2012, as part of the 2012 United States presidential election in which all 50 states plus the District of Columbia participated. Maine voters chose four electors to represent them in the Electoral College via a popular vote pitting incumbent Democratic President Barack Obama and his running mate, Vice President Joe Biden, against Republican challenger and former Massachusetts Governor Mitt Romney and his running mate, Congressman Paul Ryan. Obama and Biden carried Maine with 56.27% of the popular vote to Romney's and Ryan's 40.98%, thus winning the state's four electoral votes.
This article contains the results of the 2012 Republican presidential primaries and caucuses, which resulted in the nomination of Mitt Romney as the Republican nominee for President of the United States. The 2012 Republican primaries were the selection processes by which the Republican Party selected delegates to attend the 2012 Republican National Convention from August 27–30. The series of primaries, caucuses, and state conventions culminated in the national convention, where the delegates cast their votes to formally select a candidate. A simple majority (1,144) of the total delegate votes (2,286) was required to become the party's nominee.
The 2012 United States presidential election in Louisiana took place on November 6, 2012, as part of the 2012 United States presidential election in which all 50 states plus the District of Columbia participated. Louisiana voters chose eight electors to represent them in the Electoral College via a popular vote pitting incumbent Democratic President Barack Obama and his running mate, Vice President Joe Biden, against Republican challenger and former Massachusetts Governor Mitt Romney and his running mate, Congressman Paul Ryan.
Presidential primaries and caucuses were organized by the Democratic Party to select the 4,051 delegates to the 2016 Democratic National Convention held July 25–28 and determine the nominee for president in the 2016 United States presidential election. The elections took place within all fifty U.S. states, the District of Columbia, five U.S. territories, and Democrats Abroad and occurred between February 1 and June 14, 2016.
This article contains the results of the 2016 Republican presidential primaries and caucuses, the processes by which the Republican Party selected delegates to attend the 2016 Republican National Convention from July 18–21. The series of primaries, caucuses, and state conventions culminated in the national convention, where the delegates cast their votes to formally select a candidate. A simple majority (1,237) of the total delegate votes (2,472) was required to become the party's nominee and was achieved by the nominee, businessman Donald Trump of New York.
This article includes the entire 2016 Democratic Party presidential primary schedule in a format that includes result tabulation. Below are the vote totals for everyone that appeared on the ballot during the 2016 Democratic presidential primaries. Two candidates, Bernie Sanders and Hillary Clinton, appeared on all 57 ballots. Two others, Martin O'Malley and Rocky De La Fuente, appeared in over 30 states and six others appeared on between two and ten states. Nearly 20 appeared on only New Hampshire's ballot. As of June 8, Hillary Clinton was considered the presumptive nominee according to media organizations. On July 26, the second day of the Democratic National Convention, Clinton was confirmed the Democratic nominee for the 2016 United States presidential election.
Although American Samoa did not participate in the 2020 presidential election because it is a U.S. territory and not a state, it still participated in the U.S. presidential primaries and caucuses. Former mayor Michael Bloomberg won the Democratic caucus, held on March 3. The Republican caucus, in the form of a territorial convention held on March 18, endorsed incumbent President Donald Trump.
Although the Northern Mariana Islands did not participate in the 2020 presidential election because it is a U.S. territory and not a state, it still participated in the U.S. presidential primaries and caucuses. Senator Bernie Sanders won the Democratic caucus, held on March 14, which would be his last win in the 2020 primary season. The Republican caucus, held on March 15 during the party's commonwealth convention, unanimously voted for incumbent President Donald Trump.
Although the United States Virgin Islands did not participate in the 2020 presidential election because it is a U.S. territory and not a state, it still participated in the U.S. presidential caucuses and primaries. Former vice president Joe Biden won the Democratic caucuses, held on June 6. The Republican caucuses, held on March 14 in the form of a territorial convention, voted for incumbent president Donald Trump.
Below is a detailed tally of the results of the 2020 Republican Party presidential primary elections in the United States. In most U.S. states outside New Hampshire, votes for write-in candidates remain untallied.
Although Guam did not participate in the 2020 presidential election because it is a U.S. territory and not a state, it still participated in the U.S. presidential primaries and caucuses. Former vice president Joe Biden won the Democratic caucus, held on June 6. The Republican caucus, held on March 14 in the form of a "state convention", endorsed incumbent President Donald Trump.