Robust Regression and Outlier Detection

Last updated

Robust Regression and Outlier Detection is a book on robust statistics, particularly focusing on the breakdown point of methods for robust regression. It was written by Peter Rousseeuw and Annick M. Leroy, and published in 1987 by Wiley.

Contents

Background

The Hertzsprung-Russell diagram of stars plotted by luminosity and color. Robust regression methods can fit a curve to the main sequence, the central curve in this diagram, without being strongly influenced by the groups of stars far from the main sequence. HRDiagram.png
The Hertzsprung–Russell diagram of stars plotted by luminosity and color. Robust regression methods can fit a curve to the main sequence, the central curve in this diagram, without being strongly influenced by the groups of stars far from the main sequence.

Linear regression is the problem of inferring a linear functional relationship between a dependent variable and one or more independent variables, from data sets where that relation has been obscured by noise. Ordinary least squares assumes that the data all lie near the fit line or plane, but depart from it by the addition of normally distributed residual values. In contrast, robust regression methods work even when some of the data points are outliers that bear no relation to the fit line or plane, possibly because the data draws from a mixture of sources or possibly because an adversarial agent is trying to corrupt the data to cause the regression method to produce an inaccurate result. [1] A typical application, discussed in the book, involves the Hertzsprung–Russell diagram of star types, in which one wishes to fit a curve through the main sequence of stars without the fit being thrown off by the outlying giant stars and white dwarfs. [2] The breakdown point of a robust regression method is the fraction of outlying data that it can tolerate while remaining accurate. For this style of analysis, higher breakdown points are better. [1] The breakdown point for ordinary least squares is near zero (a single outlier can make the fit become arbitrarily far from the remaining uncorrupted data) [2] while some other methods have breakdown points as high as 50%. [1] Although these methods require few assumptions about the data, and work well for data whose noise is not well understood, they may have somewhat lower efficiency than ordinary least squares (requiring more data for a given accuracy of fit) and their implementation may be complex and slow. [3]

Topics

The book has seven chapters. [1] [4] The first is introductory; it describes simple linear regression (in which there is only one independent variable), discusses the possibility of outliers that corrupt either the dependent or the independent variable, provides examples in which outliers produce misleading results, defines the breakdown point, and briefly introduces several methods for robust simple regression, including repeated median regression. [1] [2] The second and third chapters analyze in more detail the least median of squares method for regression (in which one seeks a fit that minimizes the median of the squared residuals) and the least trimmed squares method (in which one seeks to minimize the sum of the squared residuals that are below the median). These two methods both have breakdown point 50% and can be applied for both simple regression (chapter two) and multivariate regression (chapter three). [1] [5] Although the least median has an appealing geometric description (as finding a strip of minimum height containing half the data), its low efficiency leads to the recommendation that the least trimmed squares be used instead; least trimmed squares can also be interpreted as using the least median method to find and eliminate outliers and then using simple regression for the remaining data, [4] and approaches simple regression in its efficiency. [6] As well as describing these methods and analyzing their statistical properties, these chapters also describe how to use the authors' software for implementing these methods. [1] The third chapter also includes descriptions of some alternative estimators with high breakdown points. [7]

The fourth chapter describes one-dimensional estimation of a location parameter or central tendency and its software implementation, and the fifth chapter goes into more detail about the algorithms used by the software to compute these estimates efficiently. The sixth chapter concerns outlier detection, comparing methods for identifying data points as outliers based on robust statistics with other widely used methods, and the final chapter concerns higher-dimensional location problems as well as time series analysis and problems of fitting an ellipsoid or covariance matrix to data. [1] [4] [5] [7] As well as using the breakdown point to compare statistical methods, the book also looks at their equivariance: for which families of data transformations does the fit for transformed data equal the transformed version of the fit for the original data? [6]

In keeping with the book's focus on applications, it features many examples of analyses done using robust methods, comparing the resulting estimates with the estimates obtained by standard non-robust methods. [3] [7] Theoretical material is included, but set aside so that it can be easily skipped over by less theoretically inclined readers. The authors take the position that robust methods can be used both to check the applicability of ordinary regression (when the results of both methods agree) and to supplant them in cases where the results disagree. [5]

Audience and reception

The book is aimed at applied statisticians, with the goal of convincing them to use the robust methods that it describes. [1] Unlike previous work in robust statistics, it makes robust methods both understandable by and (through its associated software) available to practitioners. [3] No prior knowledge of robust statistics is required, [4] although some background in basic statistical techniques is assumed. [5] The book could also be used as a textbook, [5] although reviewer P. J. Laycock calls the possibility of such a use "bold and progressive" [4] and reviewers Seheult and Green point out that such a course would be unlikely to fit into British statistical curricula. [6]

Reviewers Seheult and Green complain that too much of the book acts as a user guide to the authors' software, and should have been trimmed. [6] However, reviewer Gregory F. Piepel writes that "the presentation is very good", and he recommends the book to any user of statistical methods. [1] And, while suggesting the reordering of some material, Karen Kafadar strongly recommends the book as a textbook for graduate students and a reference for professionals. [5] And reviewer A. C. Atkinson concisely summarizes the book as "interesting and important". [8]

There have been multiple previous books on robust regression and outlier detection, including: [5] [7]

In comparison, Robust Regression and Outlier Detection combines both robustness and the detection of outliers. [5] It is less theoretical, more focused on data and software, and more focused on the breakdown point than on other measures of robustness. [7] Additionally, it is the first to highlight the importance of "leverage", the phenomenon that samples with outlying values of the independent variable can have a stronger influence on the fit than samples where the independent variable has a central value. [8]

Related Research Articles

<span class="mw-page-title-main">Data set</span> Collection of data

A data set is a collection of data. In the case of tabular data, a data set corresponds to one or more database tables, where every column of a table represents a particular variable, and each row corresponds to a given record of the data set in question. The data set lists values for each of the variables, such as for example height and weight of an object, for each member of the data set. Data sets can also consist of a collection of documents or files.

<span class="mw-page-title-main">Median</span> Middle quantile of a data set or probability distribution

In statistics and probability theory, the median is the value separating the higher half from the lower half of a data sample, a population, or a probability distribution. For a data set, it may be thought of as "the middle" value. The basic feature of the median in describing data compared to the mean is that it is not skewed by a small proportion of extremely large or small values, and therefore provides a better representation of the center. Median income, for example, may be a better way to describe center of the income distribution because increases in the largest incomes alone have no effect on median. For this reason, the median is of central importance in robust statistics.

<span class="mw-page-title-main">Quantile</span> Statistical method of dividing data into equal-sized intervals for analysis

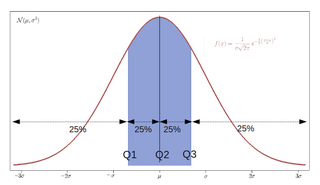
In statistics and probability, quantiles are cut points dividing the range of a probability distribution into continuous intervals with equal probabilities, or dividing the observations in a sample in the same way. There is one fewer quantile than the number of groups created. Common quantiles have special names, such as quartiles, deciles, and percentiles. The groups created are termed halves, thirds, quarters, etc., though sometimes the terms for the quantile are used for the groups created, rather than for the cut points.

Statistics is a field of inquiry that studies the collection, analysis, interpretation, and presentation of data. It is applicable to a wide variety of academic disciplines, from the physical and social sciences to the humanities; it is also used and misused for making informed decisions in all areas of business and government.

<span class="mw-page-title-main">Outlier</span> Observation far apart from others in statistics and data science

In statistics, an outlier is a data point that differs significantly from other observations. An outlier may be due to a variability in the measurement, an indication of novel data, or it may be the result of experimental error; the latter are sometimes excluded from the data set. An outlier can be an indication of exciting possibility, but can also cause serious problems in statistical analyses.

<span class="mw-page-title-main">Regression analysis</span> Set of statistical processes for estimating the relationships among variables

In statistical modeling, regression analysis is a set of statistical processes for estimating the relationships between a dependent variable and one or more independent variables. The most common form of regression analysis is linear regression, in which one finds the line that most closely fits the data according to a specific mathematical criterion. For example, the method of ordinary least squares computes the unique line that minimizes the sum of squared differences between the true data and that line. For specific mathematical reasons, this allows the researcher to estimate the conditional expectation of the dependent variable when the independent variables take on a given set of values. Less common forms of regression use slightly different procedures to estimate alternative location parameters or estimate the conditional expectation across a broader collection of non-linear models.

In robust statistics, robust regression seeks to overcome some limitations of traditional regression analysis. A regression analysis models the relationship between one or more independent variables and a dependent variable. Standard types of regression, such as ordinary least squares, have favourable properties if their underlying assumptions are true, but can give misleading results otherwise. Robust regression methods are designed to limit the effect that violations of assumptions by the underlying data-generating process have on regression estimates.

In statistics, the mid-range or mid-extreme is a measure of central tendency of a sample defined as the arithmetic mean of the maximum and minimum values of the data set:

Robust statistics are statistics with good performance for data drawn from a wide range of probability distributions, especially for distributions that are not normal. Robust statistical methods have been developed for many common problems, such as estimating location, scale, and regression parameters. One motivation is to produce statistical methods that are not unduly affected by outliers. Another motivation is to provide methods with good performance when there are small departures from a parametric distribution. For example, robust methods work well for mixtures of two normal distributions with different standard deviations; under this model, non-robust methods like a t-test work poorly.

<span class="mw-page-title-main">Local regression</span> Moving average and polynomial regression method for smoothing data

Local regression or local polynomial regression, also known as moving regression, is a generalization of the moving average and polynomial regression. Its most common methods, initially developed for scatterplot smoothing, are LOESS and LOWESS, both pronounced. They are two strongly related non-parametric regression methods that combine multiple regression models in a k-nearest-neighbor-based meta-model. In some fields, LOESS is known and commonly referred to as Savitzky–Golay filter.

In statistics, the Hodges–Lehmann estimator is a robust and nonparametric estimator of a population's location parameter. For populations that are symmetric about one median, such as the (Gaussian) normal distribution or the Student t-distribution, the Hodges–Lehmann estimator is a consistent and median-unbiased estimate of the population median. For non-symmetric populations, the Hodges–Lehmann estimator estimates the "pseudo–median", which is closely related to the population median.

Least absolute deviations (LAD), also known as least absolute errors (LAE), least absolute residuals (LAR), or least absolute values (LAV), is a statistical optimality criterion and a statistical optimization technique based on minimizing the sum of absolute deviations or the L1 norm of such values. It is analogous to the least squares technique, except that it is based on absolute values instead of squared values. It attempts to find a function which closely approximates a set of data by minimizing residuals between points generated by the function and corresponding data points. The LAD estimate also arises as the maximum likelihood estimate if the errors have a Laplace distribution. It was introduced in 1757 by Roger Joseph Boscovich.

<span class="mw-page-title-main">Plot (graphics)</span>

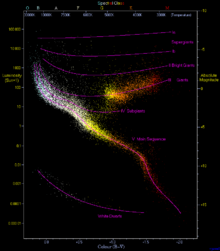
A plot is a graphical technique for representing a data set, usually as a graph showing the relationship between two or more variables. The plot can be drawn by hand or by a computer. In the past, sometimes mechanical or electronic plotters were used. Graphs are a visual representation of the relationship between variables, which are very useful for humans who can then quickly derive an understanding which may not have come from lists of values. Given a scale or ruler, graphs can also be used to read off the value of an unknown variable plotted as a function of a known one, but this can also be done with data presented in tabular form. Graphs of functions are used in mathematics, sciences, engineering, technology, finance, and other areas.

In statistics, robust measures of scale are methods that quantify the statistical dispersion in a sample of numerical data while resisting outliers. The most common such robust statistics are the interquartile range (IQR) and the median absolute deviation (MAD). These are contrasted with conventional or non-robust measures of scale, such as sample variance or standard deviation, which are greatly influenced by outliers.

The following outline is provided as an overview of and topical guide to regression analysis:

Least trimmed squares (LTS), or least trimmed sum of squares, is a robust statistical method that fits a function to a set of data whilst not being unduly affected by the presence of outliers. It is one of a number of methods for robust regression.

<span class="mw-page-title-main">Peter Rousseeuw</span> Belgian statistician

Peter J. Rousseeuw is a statistician known for his work on robust statistics and cluster analysis. He obtained his PhD in 1981 at the Vrije Universiteit Brussel, following research carried out at the ETH in Zurich, which led to a book on influence functions. Later he was professor at the Delft University of Technology, The Netherlands, at the University of Fribourg, Switzerland, and at the University of Antwerp, Belgium. Next he was a senior researcher at Renaissance Technologies. He then returned to Belgium as professor at KU Leuven, until becoming emeritus in 2022. His former PhD students include Annick Leroy, Hendrik Lopuhaä, Geert Molenberghs, Christophe Croux, Mia Hubert, Stefan Van Aelst, Tim Verdonck and Jakob Raymaekers.

<span class="mw-page-title-main">Theil–Sen estimator</span> Statistical method for fitting a line

In non-parametric statistics, the Theil–Sen estimator is a method for robustly fitting a line to sample points in the plane by choosing the median of the slopes of all lines through pairs of points. It has also been called Sen's slope estimator, slope selection, the single median method, the Kendall robust line-fit method, and the Kendall–Theil robust line. It is named after Henri Theil and Pranab K. Sen, who published papers on this method in 1950 and 1968 respectively, and after Maurice Kendall because of its relation to the Kendall tau rank correlation coefficient.

In statistics, linear regression is a linear approach for modelling the relationship between a scalar response and one or more explanatory variables. The case of one explanatory variable is called simple linear regression; for more than one, the process is called multiple linear regression. This term is distinct from multivariate linear regression, where multiple correlated dependent variables are predicted, rather than a single scalar variable.

References

  1. 1 2 3 4 5 6 7 8 9 10 Piepel, Gregory F. (May 1989), "Review of Robust Regression and Outlier Detection", Technometrics, 31 (2): 260–261, doi:10.2307/1268828, JSTOR   1268828
  2. 1 2 3 Sonnberger, Harold (July–September 1989), "Review of Robust Regression and Outlier Detection", Journal of Applied Econometrics, 4 (3): 309–311, JSTOR   2096530
  3. 1 2 3 Weisberg, Stanford (July–August 1989), "Review of Robust Regression and Outlier Detection", American Scientist, 77 (4): 402–403, JSTOR   27855903
  4. 1 2 3 4 5 Laycock, P. J. (1989), "Review of Robust Regression and Outlier Detection", Journal of the Royal Statistical Society, Series D (The Statistician), 38 (2): 138, doi:10.2307/2348319, JSTOR   2348319
  5. 1 2 3 4 5 6 7 8 Kafadar, Karen (June 1989), "Review of Robust Regression and Outlier Detection", Journal of the American Statistical Association, 84 (406): 617–618, doi:10.2307/2289958, JSTOR   2289958
  6. 1 2 3 4 Seheult, A. H.; Green, P. J. (1989), "Review of Robust Regression and Outlier Detection", Journal of the Royal Statistical Society, Series A (Statistics in Society), 152 (1): 133–134, doi:10.2307/2982847, JSTOR   2982847
  7. 1 2 3 4 5 Yohai, V. J. (1989), "Review of Robust Regression and Outlier Detection", Mathematical Reviews and zbMATH, MR   0914792, Zbl   0711.62030
  8. 1 2 Atkinson, A. C. (June 1988), "Review of Robust Statistics and Robust Regression and Outlier Detection", Biometrics, 44 (2): 626–627, doi:10.2307/2531877, JSTOR   2531877