Saliency map

Last updated
A view of the fort of Marburg (Germany) and the saliency Map of the image using color, intensity and orientation. Saliencymap example.jpg
A view of the fort of Marburg (Germany) and the saliency Map of the image using color, intensity and orientation.

In computer vision, a saliency map is an image that highlights either the region on which people's eyes focus first or the most relevant regions for machine learning models. [1] The goal of a saliency map is to reflect the degree of importance of a pixel to the human visual system or an otherwise opaque ML model.

Contents

For example, in this image, a person first looks at the fort and light clouds, so they should be highlighted on the saliency map. Saliency maps engineered in artificial or computer vision are typically not the same as the actual saliency map constructed by biological or natural vision.

Application

Overview

Saliency maps have applications in a variety of different problems. Some general applications:

Human eye

  • Image and video compression: The human eye focuses only on a small region of interest in the frame. Therefore, it is not necessary to compress the entire frame with uniform quality. According to the authors, using a salience map reduces the final size of the video with the same visual perception. [2]
  • Image and video quality assessment: The main task for an image or video quality metric is a high correlation with user opinions. Differences in salient regions are given more importance and thus contribute more to the quality score. [3]
  • Image retargeting: It aims at resizing an image by expanding or shrinking the noninformative regions. Therefore, retargeting algorithms rely on the availability of saliency maps that accurately estimate all the salient image details. [4]
  • Object detection and recognition: Instead of applying a computationally complex algorithm to the whole image, we can use it to the most salient regions of an image most likely to contain an object. [5]

Explainable Artificial Intelligence

  • Explainable Artificial Intelligence in the context of black box machine learning models: Saliency maps are a prominent tool in XAI, [6] providing visual explanations of the decision-making process of machine learning models, particularly deep neural networks. These maps highlight the regions in input images, text, or other types of data that are most influential in the model's output, effectively indicating where the model is "looking" when making a prediction. By illustrating which parts of the input are deemed important, saliency maps help in understanding the internal workings of otherwise black box models, thereby fostering trust and transparency. In image classification tasks, for example, saliency maps can identify pixels or regions that contribute most to a specific class decision. One of the most prominent techniques to generate saliency maps is Gradient-weighted Class Activation Mapping (Grad-CAM), which is cited more than 20,000 times. [6]

Saliency as a segmentation problem

Saliency estimation may be viewed as an instance of image segmentation. In computer vision, image segmentation is the process of partitioning a digital image into multiple segments (sets of pixels, also known as superpixels). The goal of segmentation is to simplify and/or change the representation of an image into something that is more meaningful and easier to analyze. Image segmentation is typically used to locate objects and boundaries (lines, curves, etc.) in images. More precisely, image segmentation is the process of assigning a label to every pixel in an image such that pixels with the same label share certain characteristics. [7]

Algorithms

Overview

There are three forms of classic saliency estimation algorithms implemented in OpenCV:

In addition to classic approaches, neural-network-based are also popular. There are examples of neural networks for motion saliency estimation:

Example implementation

First, we should calculate the distance of each pixel to the rest of pixels in the same frame:

is the value of pixel , in the range of [0,255]. The following equation is the expanded form of this equation.

SALS(Ik) = |Ik - I1| + |Ik - I2| + ... + |Ik - IN|

Where N is the total number of pixels in the current frame. Then we can further restructure our formula. We put the value that has same I together.

SALS(Ik) = Σ Fn × |Ik - In|

Where Fn is the frequency of In. And the value of n belongs to [0,255]. The frequencies is expressed in the form of histogram, and the computational time of histogram is time complexity.

Time complexity

This saliency map algorithm has time complexity. Since the computational time of histogram is time complexity which N is the number of pixel's number of a frame. Besides, the minus part and multiply part of this equation need 256 times operation. Consequently, the time complexity of this algorithm is which equals to .

Pseudocode

All of the following code is pseudo MATLAB code. First, read data from video sequences.

fork=2:1:13% which means from frame 2 to 13,  and in every loop K's value increase one.I=imread(currentfilename);% read current frameI1=im2single(I);% convert double image into single(requirement of command vlslic)l=imread(previousfilename);% read previous frameI2=im2single(l);regionSize=10;% set the parameter of SLIC this parameter setting are the experimental result. RegionSize means the superpixel size.regularizer=1;% set the parameter of SLICsegments1=vl_slic(I1,regionSize,regularizer);% get the superpixel of current framesegments2=vl_slic(I2,regionSize,regularizer);% get superpixel of the previous framenumsuppix=max(segments1(:));% get the number of superpixel all information about superpixel is in this link [http://www.vlfeat.org/overview/slic.html]regstats1=regionprops(segments1,all);regstats2=regionprops(segments2,all);% get the region characteristic based on segments1

After we read data, we do superpixel process to each frame. Spnum1 and Spnum2 represent the pixel number of current frame and previous pixel.

% First, we calculate the value distance of each pixel.% This is our core codefori=1:1:spnum1%  From the first pixel to the last one. And in every loop i++forj=1:1:spnum2% From the first pixel to the last one. j++. previous framecentredist(i:j)=sum((center(i)-center(j)));% calculate the center distanceendend

Then we calculate the color distance of each pixel, this process we call it contract function.

fori=1:1:spnum1% From first pixel of current frame to the last one pixel. I ++forj=1:1:spnum2% From first pixel of previous frame to the last one pixel. J++posdiff(i,j)=sum((regstats1(j).Centroid-mupwtd(:,i)));% Calculate the color distance.endend

After this two process, we will get a saliency map, and then store all of these maps into a new FileFolder.

Difference in algorithms

The major difference between function one and two is the difference of contract function. If spnum1 and spnum2 both represent the current frame's pixel number, then this contract function is for the first saliency function. If spnum1 is the current frame's pixel number and spnum2 represent the previous frame's pixel number, then this contract function is for second saliency function. If we use the second contract function which using the pixel of the same frame to get center distance to get a saliency map, then we apply this saliency function to each frame and use current frame's saliency map minus previous frame's saliency map to get a new image which is the new saliency result of the third saliency function.

Saliency result Wiki102.png
Saliency result

Datasets

The saliency dataset usually contains human eye movements on some image sequences. It is valuable for new saliency algorithm creation or benchmarking the existing one. The most valuable dataset parameters are spatial resolution, size, and eye-tracking equipment. Here is part of the large datasets table from MIT/Tübingen Saliency Benchmark datasets, for example.

Saliency datasets
DatasetResolutionSizeObserversDurationsEyetracker
CAT2000 1920×1080px4000 images245 secEyeLink 1000 (1000Hz)
EyeTrackUAV2 1280×720px43 videos3033 secEyeLink 1000 Plus (1000 Hz, binocular)
CrowdFix 1280×720px434 videos261-3 secThe Eyetribe Eyetracker (60 Hz)
SAVAM 1920×1080px43 videos5020 secSMI iViewXTM Hi-Speed 1250 (500Hz)

To collect a saliency dataset, image or video sequences and eye-tracking equipment must be prepared, and observers must be invited. Observers must have normal or corrected to normal vision and must be at the same distance from the screen. At the beginning of each recording session, the eye-tracker recalibrates. To do this, the observer fixates his gaze on the screen center. Then the session started, and saliency data are collected by showing sequences and recording eye gazes.

The eye-tracking device is a high-speed camera, capable of recording eye movements at least 250 frames per second. Images from the camera are processed by the software, running on a dedicated computer returning gaze data.

Related Research Articles

<span class="mw-page-title-main">Texture mapping</span> Method of defining surface detail on a computer-generated graphic or 3D model

Texture mapping is a method for mapping a texture on a computer-generated graphic. Texture here can be high frequency detail, surface texture, or color.

<span class="mw-page-title-main">Image segmentation</span> Partitioning a digital image into segments

In digital image processing and computer vision, image segmentation is the process of partitioning a digital image into multiple image segments, also known as image regions or image objects. The goal of segmentation is to simplify and/or change the representation of an image into something that is more meaningful and easier to analyze. Image segmentation is typically used to locate objects and boundaries in images. More precisely, image segmentation is the process of assigning a label to every pixel in an image such that pixels with the same label share certain characteristics.

<span class="mw-page-title-main">Cluster analysis</span> Grouping a set of objects by similarity

Cluster analysis or clustering is the task of grouping a set of objects in such a way that objects in the same group are more similar to each other than to those in other groups (clusters). It is a main task of exploratory data analysis, and a common technique for statistical data analysis, used in many fields, including pattern recognition, image analysis, information retrieval, bioinformatics, data compression, computer graphics and machine learning.

The following are common definitions related to the machine vision field.

In computer vision, blob detection methods are aimed at detecting regions in a digital image that differ in properties, such as brightness or color, compared to surrounding regions. Informally, a blob is a region of an image in which some properties are constant or approximately constant; all the points in a blob can be considered in some sense to be similar to each other. The most common method for blob detection is by using convolution.

As applied in the field of computer vision, graph cut optimization can be employed to efficiently solve a wide variety of low-level computer vision problems, such as image smoothing, the stereo correspondence problem, image segmentation, object co-segmentation, and many other computer vision problems that can be formulated in terms of energy minimization. Many of these energy minimization problems can be approximated by solving a maximum flow problem in a graph. Under most formulations of such problems in computer vision, the minimum energy solution corresponds to the maximum a posteriori estimate of a solution. Although many computer vision algorithms involve cutting a graph, the term "graph cuts" is applied specifically to those models which employ a max-flow/min-cut optimization.

The Kadir–Brady saliency detector extracts features of objects in images that are distinct and representative. It was invented by Timor Kadir and J. Michael Brady in 2001 and an affine invariant version was introduced by Kadir and Brady in 2004 and a robust version was designed by Shao et al. in 2007.

In the fields of computer vision and image analysis, the Harris affine region detector belongs to the category of feature detection. Feature detection is a preprocessing step of several algorithms that rely on identifying characteristic points or interest points so to make correspondences between images, recognize textures, categorize objects or build panoramas.

In computer vision, maximally stable extremal regions (MSER) are used as a method of blob detection in images. This technique was proposed by Matas et al. to find correspondences between image elements from two images with different viewpoints. This method of extracting a comprehensive number of corresponding image elements contributes to the wide-baseline matching, and it has led to better stereo matching and object recognition algorithms.

The Viola–Jones object detection framework is a machine learning object detection framework proposed in 2001 by Paul Viola and Michael Jones. It was motivated primarily by the problem of face detection, although it can be adapted to the detection of other object classes.

The image segmentation problem is concerned with partitioning an image into multiple regions according to some homogeneity criterion. This article is primarily concerned with graph theoretic approaches to image segmentation applying graph partitioning via minimum cut or maximum cut. Segmentation-based object categorization can be viewed as a specific case of spectral clustering applied to image segmentation.

The constellation model is a probabilistic, generative model for category-level object recognition in computer vision. Like other part-based models, the constellation model attempts to represent an object class by a set of N parts under mutual geometric constraints. Because it considers the geometric relationship between different parts, the constellation model differs significantly from appearance-only, or "bag-of-words" representation models, which explicitly disregard the location of image features.

One-shot learning is an object categorization problem, found mostly in computer vision. Whereas most machine learning-based object categorization algorithms require training on hundreds or thousands of examples, one-shot learning aims to classify objects from one, or only a few, examples. The term few-shot learning is also used for these problems, especially when more than one example is needed.

Region growing is a simple region-based image segmentation method. It is also classified as a pixel-based image segmentation method since it involves the selection of initial seed points.

<span class="mw-page-title-main">Histogram matching</span>

In image processing, histogram matching or histogram specification is the transformation of an image so that its histogram matches a specified histogram. The well-known histogram equalization method is a special case in which the specified histogram is uniformly distributed.

ViBe is a background subtraction algorithm which has been presented at the IEEE ICASSP 2009 conference and was refined in later publications. More precisely, it is a software module for extracting background information from moving images. It has been developed by Oliver Barnich and Marc Van Droogenbroeck of the Montefiore Institute, University of Liège, Belgium.

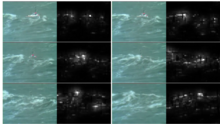
Foreground detection is one of the major tasks in the field of computer vision and image processing whose aim is to detect changes in image sequences. Background subtraction is any technique which allows an image's foreground to be extracted for further processing.

In computer vision, rigid motion segmentation is the process of separating regions, features, or trajectories from a video sequence into coherent subsets of space and time. These subsets correspond to independent rigidly moving objects in the scene. The goal of this segmentation is to differentiate and extract the meaningful rigid motion from the background and analyze it. Image segmentation techniques labels the pixels to be a part of pixels with certain characteristics at a particular time. Here, the pixels are segmented depending on its relative movement over a period of time i.e. the time of the video sequence.

<span class="mw-page-title-main">Teknomo–Fernandez algorithm</span>

The Teknomo–Fernandez algorithm , is an efficient algorithm for generating the background image of a given video sequence.

An event camera, also known as a neuromorphic camera, silicon retina or dynamic vision sensor, is an imaging sensor that responds to local changes in brightness. Event cameras do not capture images using a shutter as conventional (frame) cameras do. Instead, each pixel inside an event camera operates independently and asynchronously, reporting changes in brightness as they occur, and staying silent otherwise.

References

  1. Subhash, Bijil (6 March 2022). "Explainable AI: Saliency Maps". Medium. Retrieved 26 May 2024.
  2. Guo, Chenlei; Zhang, Liming (Jan 2010). "A Novel Multiresolution Spatiotemporal Saliency Detection Model and Its Applications in Image and Video Compression". IEEE Transactions on Image Processing. 19 (1): 185–198. Bibcode:2010ITIP...19..185G. doi:10.1109/TIP.2009.2030969. ISSN   1057-7149. PMID   19709976. S2CID   1154218.
  3. Tong, Yubing; Konik, Hubert; Cheikh, Faouzi; Tremeau, Alain (2010-05-01). "Full Reference Image Quality Assessment Based on Saliency Map Analysis". Journal of Imaging Science and Technology. 54 (3): 30503–1–30503-14. doi: 10.2352/J.ImagingSci.Technol.2010.54.3.030503 . hdl: 11250/142490 .
  4. Goferman, Stas; Zelnik-Manor, Lihi; Tal, Ayellet (Oct 2012). "Context-Aware Saliency Detection". IEEE Transactions on Pattern Analysis and Machine Intelligence. 34 (10): 1915–1926. doi:10.1109/TPAMI.2011.272. ISSN   1939-3539. PMID   22201056.
  5. Jiang, Huaizu; Wang, Jingdong; Yuan, Zejian; Wu, Yang; Zheng, Nanning; Li, Shipeng (June 2013). "Salient Object Detection: A Discriminative Regional Feature Integration Approach". 2013 IEEE Conference on Computer Vision and Pattern Recognition. IEEE. pp. 2083–2090. arXiv: 1410.5926 . doi:10.1109/cvpr.2013.271. ISBN   978-0-7695-4989-7.
  6. 1 2 Müller, Romy (2024). "How explainable AI affects human performance: A systematic review of the behavioural consequences of saliency maps". Arxiv. doi:10.48550/arXiv.2404.16042.
  7. A. Maity (2015). "Improvised Salient Object Detection and Manipulation". arXiv: 1511.02999 [cs.CV].

See also