Tropical cyclone forecast model

Last updated

Significant track errors still occur on occasion, as seen in this Ernesto (2006) early forecast. The NHC official forecast is light blue, while the storm's actual track is the white line over Florida. Ernesto2006modelspread.png
Significant track errors still occur on occasion, as seen in this Ernesto (2006) early forecast. The NHC official forecast is light blue, while the storm's actual track is the white line over Florida.

A tropical cyclone forecast model is a computer program that uses meteorological data to forecast aspects of the future state of tropical cyclones. There are three types of models: statistical, dynamical, or combined statistical-dynamic. [1] Dynamical models utilize powerful supercomputers with sophisticated mathematical modeling software and meteorological data to calculate future weather conditions. Statistical models forecast the evolution of a tropical cyclone in a simpler manner, by extrapolating from historical datasets, and thus can be run quickly on platforms such as personal computers. Statistical-dynamical models use aspects of both types of forecasting. Four primary types of forecasts exist for tropical cyclones: track, intensity, storm surge, and rainfall. Dynamical models were not developed until the 1970s and the 1980s, with earlier efforts focused on the storm surge problem.

Contents

Track models did not show forecast skill when compared to statistical models until the 1980s. Statistical-dynamical models were used from the 1970s into the 1990s. Early models use data from previous model runs while late models produce output after the official hurricane forecast has been sent. The use of consensus, ensemble, and superensemble forecasts lowers errors more than any individual forecast model. Both consensus and superensemble forecasts can use the guidance of global and regional models runs to improve the performance more than any of their respective components. Techniques used at the Joint Typhoon Warning Center indicate that superensemble forecasts are a very powerful tool for track forecasting.

Statistical guidance

r-CLIPER for Hurricane Isabel (2003) Isabel2003rcliper.jpg
r-CLIPER for Hurricane Isabel (2003)

The first statistical guidance used by the National Hurricane Center was the Hurricane Analog Technique (HURRAN), which was available in 1969. It used the newly developed North Atlantic tropical cyclone database to find storms with similar tracks. It then shifted their tracks through the storm's current path, and used location, direction and speed of motion, and the date to find suitable analogs. The method did well with storms south of the 25th parallel which had not yet turned northward, but poorly with systems near or after recurvature. [2] Since 1972, the Climatology and Persistence (CLIPER) statistical model has been used to help generate tropical cyclone track forecasts. In the era of skillful dynamical forecasts, CLIPER is now being used as the baseline to show model and forecaster skill. [3] The Statistical Hurricane Intensity Forecast (SHIFOR) has been used since 1979 for tropical cyclone intensity forecasting. It uses climatology and persistence to predict future intensity, including the current Julian day, current cyclone intensity, the cyclone's intensity 12 hours ago, the storm's initial latitude and longitude, as well as its zonal (east-west) and meridional (north-south) components of motion. [2]

A series of statistical-dynamical models, which used regression equations based upon CLIPER output and the latest output from primitive equation models run at the National Meteorological Center, then National Centers for Environmental Prediction, were developed between the 1970s and 1990s and were named NHC73, NHC83, NHC90, NHC91, and NHC98. [1] [4] Within the field of tropical cyclone track forecasting, despite the ever-improving dynamical model guidance which occurred with increased computational power, it was not until the decade of the 1980s when numerical weather prediction showed skill, and until the 1990s when it consistently outperformed statistical or simple dynamical models. [5] In 1994, a version of SHIFOR was created for the northwest Pacific Ocean for typhoon forecasting, known as the Statistical Typhoon Intensity Forecast (STIFOR), which used the 1971–1990 data for that region to develop intensity forecasts out to 72 hours into the future. [6]

In regards to intensity forecasting, the Statistical Hurricane Intensity Prediction Scheme (SHIPS) utilizes relationships between environmental conditions from the Global Forecast System (GFS) such as vertical wind shear and sea surface temperatures, climatology, and persistence (storm behavior) via multiple regression techniques to come up with an intensity forecast for systems in the northern Atlantic and northeastern Pacific oceans. [1] A similar model was developed for the northwest Pacific Ocean and Southern Hemisphere known as the Statistical Intensity Prediction System (STIPS), which accounts for land interactions through the input environmental conditions from the Navy Operational Global Prediction System (NOGAPS) model. [7] The version of SHIPS with an inland decay component is known as Decay SHIPS (DSHIPS). The Logistic Growth Equation Model (LGEM) uses the same input as SHIPS but within a simplified dynamical prediction system. [1] Within tropical cyclone rainfall forecasting, the Rainfall Climatology and Persistence (r-CLIPER) model was developed using microwave rainfall data from polar orbiting satellites over the ocean and first-order rainfall measurements from the land, to come up with a realistic rainfall distribution for tropical cyclones based on the National Hurricane Center's track forecast. It has been operational since 2004. [8] A statistical-parametric wind radii model has been developed for use at the National Hurricane Center and Joint Typhoon Warning Center which uses climatology and persistence to predict wind structure out to five days into the future. [2]

Dynamical guidance

Example of a SLOSH run Sloshrun.gif
Example of a SLOSH run

The first dynamical hurricane track forecast model, the Sanders Barotropic Tropical Cyclone Track Prediction Model (SANBAR), [9] was introduced in 1970 and was used by the National Hurricane Center as part of its operational track guidance through 1989. It was based on a simplified set of atmospheric dynamical equations (the equivalent barotropic formulation) using a deep layer-mean wind.

During 1972, the first model to forecast storm surge along the continental shelf of the United States was developed, known as the Special Program to List the Amplitude of Surges from Hurricanes (SPLASH). [10] In 1978, the first full-physics hurricane-tracking model based on atmospheric dynamics – the movable fine-mesh (MFM) model – began operating. [11] The Quasi-Lagrangian Limited Area (QLM) model is a multi-level primitive equation model using a Cartesian grid and the Global Forecast System (GFS) for boundary conditions. [2] In the early 1980s, the assimilation of satellite-derived winds from water vapor, infrared, and visible satellite imagery was found to improve tropical cyclones track forecasting. [12] The Geophysical Fluid Dynamics Laboratory (GFDL) hurricane model was used for research purposes between 1973 and the mid-1980s. Once it was determined that it could show skill in hurricane prediction, a multi-year transition transformed the research model into an operational model which could be used by the National Weather Service for both track and intensity forecasting in 1995. [13] By 1985, the Sea Lake and Overland Surges from Hurricanes (SLOSH) Model had been developed for use in areas of the Gulf of Mexico and near the United States' East coast, which was more robust than the SPLASH model. [14]

The Beta Advection Model (BAM) has been used operationally since 1987 using steering winds averaged through the 850 hPa to 200 hPa layer and the Beta effect which causes a storm to drift northwest due to differences in the coriolis effect across the tropical cyclone. [15] The larger the cyclone, the larger the impact of the beta effect is likely to be. [16] Starting in 1990, three versions of the BAM were run operationally: the BAM shallow (BAMS) average winds in an 850 hPa to 700 hPa layer, the BAM Medium (BAMM) which uses average winds in an 850 hPa to 400 hPa layer, and the BAM Deep (BAMD) which is the same as the pre-1990 BAM. [4] For a weak hurricane without well-developed central thunderstorm activity, BAMS works well, because weak storms tend to be steered by low-level winds. [1] As the storm grows stronger and associated thunderstorm activity near its center gets deeper, BAMM and BAMD become more accurate, as these types of storms are steered more by the winds in the upper-level. If the forecast from the three versions is similar, then the forecaster can conclude that there is minimal uncertainty, but if the versions vary by a great deal, then the forecaster has less confidence in the track predicted due to the greater uncertainty. [17] Large differences between model predictions can also indicate wind shear in the atmosphere, which could affect the intensity forecast as well. [1]

Tested in 1989 and 1990, The Vic Ooyama Barotropic (VICBAR) model used a cubic-B spline representation of variables for the objective analysis of observations and solutions to the shallow-water prediction equations on nested domains, with the boundary conditions defined as the global forecast model. [18] It was implemented operationally as the Limited Area Sine Transform Barotropic (LBAR) model in 1992, using the GFS for boundary conditions. [2] By 1990, Australia had developed its own storm surge model which was able to be run in a few minutes on a personal computer. [19] The Japan Meteorological Agency (JMA) developed its own Typhoon Model (TYM) in 1994, [20] and in 1998, the agency began using its own dynamic storm surge model. [21]

A NOAA prediction for Hurricane Irene Irene13.gif
A NOAA prediction for Hurricane Irene

The Hurricane Weather Research and Forecasting (HWRF) model is a specialized version of the Weather Research and Forecasting (WRF) model and is used to forecast the track and intensity of tropical cyclones. The model was developed by the National Oceanic and Atmospheric Administration (NOAA), the U.S. Naval Research Laboratory, the University of Rhode Island, and Florida State University. [22] It became operational in 2007. [23] Despite improvements in track forecasting, predictions of the intensity of a tropical cyclone based on numerical weather prediction continue to be a challenge, since statistical methods continue to show higher skill over dynamical guidance. [24] Other than the specialized guidance, global guidance such as the GFS, Unified Model (UKMET), NOGAPS, Japanese Global Spectral Model (GSM), European Centre for Medium-Range Weather Forecasts model, France's Action de Recherche Petite Echelle Grande Echelle (ARPEGE) and Aire Limit´ee Adaptation Dynamique Initialisation (ALADIN) models, India's National Centre for Medium Range Weather Forecasting (NCMRWF) model, Korea's Global Data Assimilation and Prediction System (GDAPS) and Regional Data Assimilation and Prediction System (RDAPS) models, Hong Kong/China's Operational Regional Spectral Model (ORSM) model, and Canadian Global Environmental Multiscale Model (GEM) model are used for track and intensity purposes. [2]

Timeliness

Some models do not produce output quickly enough to be used for the forecast cycle immediately after the model starts running (including HWRF, GFDL, and FSSE). Most of the above track models (except CLIPER) require data from global weather models, such as the GFS, which produce output about four hours after the synoptic times of 0000, 0600, 1200, and 1800 Universal Coordinated Time (UTC). For half of their forecasts, the NHC issues forecasts only three hours after that time, so some "early" models – NHC90, BAM, and LBAR – are run using a 12-hour-old forecast for the current time. "Late" models, such as the GFS and GFDL, finish after the advisory has already been issued. These models are interpolated to the current storm position for use in the following forecast cycle – for example, GFDI, the interpolated version of the GFDL model. [1] [25]

Consensus methods

Top: WRF model simulation of Hurricane Rita tracks. Bottom: The spread of NHC multi-model ensemble forecast. WRF rita spread2.jpg
Top: WRF model simulation of Hurricane Rita tracks. Bottom: The spread of NHC multi-model ensemble forecast.

Using a consensus of forecast models reduces forecast error. [26] Trackwise, the GUNA model is a consensus of the interpolated versions of the GFDL, UKMET with quality control applied to the cyclone tracker, United States Navy NOGAPS, and GFS models. The version of the GUNA corrected for model biases is known as the CGUN. The TCON consensus is the GUNA consensus plus the Hurricane WRF model. The version of the TCON corrected for model biases is known as the TCCN. A lagged average of the last two runs of the members within the TCON plus the ECMWF model is known as the TVCN consensus. The version of the TVCN corrected for model biases is the TVCC consensus. [1]

In early 2013, The NAVGEM replaced the NOGAPS as the Navy's primary operational global forecast model. For the 2013 season, and until model verification can occur, it is not being utilized in the development of any consensus forecasts.

For intensity, a combination of the LGEM, interpolated GFDL, interpolated HWRF, and DSHIPS models is known as the ICON consensus. The lagged average of the last two runs of models within the ICON consensus is called the IVCN consensus. [1] Across the northwest Pacific and Southern Hemisphere, a ten-member STIPS consensus is formed from the output of the NOGAPS, GFS, the Japanese GSM, the Coupled Ocean/Atmosphere Mesoscale Prediction System (COAMPS), the UKMET, the Japanese TYM, the GFDL with NOGAPS boundary conditions, the Air Force Weather Agency (AFWA) Model, the Australian Tropical Cyclone Local Area Prediction System, and the Weber Barotropic Model. [7]

Ensemble methods

No model is ever perfectly accurate because it is impossible to learn exactly everything about the atmosphere in a timely enough manner, and atmospheric measurements that are taken are not completely accurate. [27] The use of the ensemble method of forecasting, whether it be a multi-model ensemble, or numerous ensemble members based on the global model, helps define the uncertainty and further limit errors. [28] [29]

The JMA has produced an 11-member ensemble forecast system for typhoons known as the Typhoon Ensemble Prediction System (TEPS) since February 2008, which is run out to 132 hours into the future. It uses a lower resolution version (with larger grid spacing) of its GSM, with ten perturbed members and one non-perturbed member. The system reduces errors by an average of 40 kilometres (25 mi) five days into the future when compared to its higher resolution GSM. [30]

The Florida State Super Ensemble (FSSE) is produced from a suite of models which then uses statistical regression equations developed over a training phase to reduce their biases, which produces forecasts better than the member models or their mean solution. It uses 11 global models, including five developed at Florida State University, the Unified Model, the GFS, the NOGAPS, the United States Navy NOGAPS, the Australian Bureau of Meteorology Research Centre (BMRC) model, and Canadian Recherche en Prévision Numérique (RPN) model. It shows significant skill in track, intensity, and rainfall predictions of tropical cyclones. [31]

The Systematic Approach Forecast Aid (SAFA) was developed by the Joint Typhoon Warning Center to create a selective consensus forecast which removed more erroneous forecasts at a 72‑hour time frame from consideration using the United States Navy NOGAPS model, the GFDL, the Japan Meteorological Agency's global and typhoon models, as well as the UKMET. All the models improved during SAFA's five-year history and removing erroneous forecasts proved difficult to do in operations. [32]

Sunspot theory

A 2010 report correlates low sunspot activity with high hurricane activity. Analyzing historical data, there was a 25% chance of at least one hurricane striking the continental United States during a peak sunspot year; a 64% chance during a low sunspot year. In June 2010, the hurricanes predictors in the US were not using this information. [33]

Hurricane forecast model accuracy

The accuracy of hurricane forecast models can vary significantly from storm to storm. For some storms the factors affecting the hurricane track are relatively straightforward, and the models are not only accurate but they produce similar forecasts, while for other storms the factors affecting the hurricane track are more complex and different models produce very different forecasts. [34]

See also

Related Research Articles

<span class="mw-page-title-main">National Hurricane Center</span> Division of the United States National Weather Service

The National Hurricane Center (NHC) is the division of the United States' NOAA/National Weather Service responsible for tracking and predicting tropical weather systems between the Prime Meridian and the 140th meridian west poleward to the 30th parallel north in the northeast Pacific Ocean and the 31st parallel north in the northern Atlantic Ocean. The agency, which is co-located with the Miami branch of the National Weather Service, is situated on the campus of Florida International University in University Park, Miami, Florida.

<span class="mw-page-title-main">Tropical cyclone warnings and watches</span> Levels of alert issued to areas threatened by a tropical cyclone

Tropical cyclone warnings and watches are alerts issued by national weather forecasting bodies to coastal areas threatened by the imminent approach of a tropical cyclone of tropical storm or hurricane intensity. They are notices to the local population and civil authorities to make appropriate preparation for the cyclone, including evacuation of vulnerable areas where necessary. It is important that interests throughout the area of an alert make preparations to protect life and property, and do not disregard it on the strength of the detailed forecast track.

<span class="mw-page-title-main">Joint Typhoon Warning Center</span> Joint United States Navy – United States Air Force command

The Joint Typhoon Warning Center (JTWC) is a joint United States Navy – United States Air Force command in Pearl Harbor, Hawaii. The JTWC is responsible for the issuing of tropical cyclone warnings in the North-West Pacific Ocean, South Pacific Ocean, and Indian Ocean for all branches of the U.S. Department of Defense and other U.S. government agencies. Their warnings are intended primarily for the protection of US military ships and aircraft, as well as military installations jointly operated with other countries around the world.

<span class="mw-page-title-main">Numerical weather prediction</span> Weather prediction using mathematical models of the atmosphere and oceans

Numerical weather prediction (NWP) uses mathematical models of the atmosphere and oceans to predict the weather based on current weather conditions. Though first attempted in the 1920s, it was not until the advent of computer simulation in the 1950s that numerical weather predictions produced realistic results. A number of global and regional forecast models are run in different countries worldwide, using current weather observations relayed from radiosondes, weather satellites and other observing systems as inputs.

<span class="mw-page-title-main">Rapid intensification</span> Sudden, violent increase in a tropical cyclones severity

Rapid intensification (RI) is any process wherein a tropical cyclone strengthens dramatically in a short period of time. Tropical cyclone forecasting agencies utilize differing thresholds for designating rapid intensification events, though the most widely used definition stipulates an increase in the maximum sustained winds of a tropical cyclone of at least 30 knots in a 24-hour period. However, periods of rapid intensification often last longer than a day. About 20–30% of all tropical cyclones undergo rapid intensification, including a majority of tropical cyclones with peak wind speeds exceeding 51 m/s.

<span class="mw-page-title-main">James Franklin (meteorologist)</span> Former weather forecaster with NOAA

James Louis Franklin is a former weather forecaster encompassing a 35-year career with National Oceanic and Atmospheric Administration (NOAA). He served as the first branch chief of the newly formed Hurricane Specialist Unit (HSU) before his retirement in 2017.

<span class="mw-page-title-main">Atmospheric model</span> Mathematical model of atmospheric motions

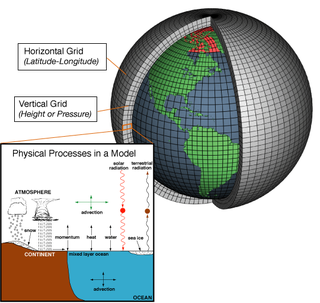
In atmospheric science, an atmospheric model is a mathematical model constructed around the full set of primitive, dynamical equations which govern atmospheric motions. It can supplement these equations with parameterizations for turbulent diffusion, radiation, moist processes, heat exchange, soil, vegetation, surface water, the kinematic effects of terrain, and convection. Most atmospheric models are numerical, i.e. they discretize equations of motion. They can predict microscale phenomena such as tornadoes and boundary layer eddies, sub-microscale turbulent flow over buildings, as well as synoptic and global flows. The horizontal domain of a model is either global, covering the entire Earth, or regional (limited-area), covering only part of the Earth. The different types of models run are thermotropic, barotropic, hydrostatic, and nonhydrostatic. Some of the model types make assumptions about the atmosphere which lengthens the time steps used and increases computational speed.

<span class="mw-page-title-main">Central dense overcast</span> Large central area of thunderstorms surrounding its circulation center

The central dense overcast, or CDO, of a tropical cyclone or strong subtropical cyclone is the large central area of thunderstorms surrounding its circulation center, caused by the formation of its eyewall. It can be round, angular, oval, or irregular in shape. This feature shows up in tropical cyclones of tropical storm or hurricane strength. How far the center is embedded within the CDO, and the temperature difference between the cloud tops within the CDO and the cyclone's eye, can help determine a tropical cyclone's intensity with the Dvorak technique. Locating the center within the CDO can be a problem with strong tropical storms and minimal hurricanes as its location can be obscured by the CDO's high cloud canopy. This center location problem can be resolved through the use of microwave satellite imagery.

<span class="mw-page-title-main">Tropical cyclogenesis</span> Development and strengthening of a tropical cyclone in the atmosphere

Tropical cyclogenesis is the development and strengthening of a tropical cyclone in the atmosphere. The mechanisms through which tropical cyclogenesis occurs are distinctly different from those through which temperate cyclogenesis occurs. Tropical cyclogenesis involves the development of a warm-core cyclone, due to significant convection in a favorable atmospheric environment.

<span class="mw-page-title-main">Extratropical cyclone</span> Type of cyclone

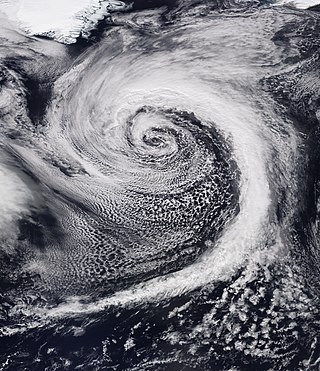
Extratropical cyclones, sometimes called mid-latitude cyclones or wave cyclones, are low-pressure areas which, along with the anticyclones of high-pressure areas, drive the weather over much of the Earth. Extratropical cyclones are capable of producing anything from cloudiness and mild showers to severe gales, thunderstorms, blizzards, and tornadoes. These types of cyclones are defined as large scale (synoptic) low pressure weather systems that occur in the middle latitudes of the Earth. In contrast with tropical cyclones, extratropical cyclones produce rapid changes in temperature and dew point along broad lines, called weather fronts, about the center of the cyclone.

<span class="mw-page-title-main">Tropical cyclone</span> Rapidly rotating storm system

A tropical cyclone is a rapidly rotating storm system characterized by a low-pressure center, a closed low-level atmospheric circulation, strong winds, and a spiral arrangement of thunderstorms that produce heavy rain and squalls. Depending on its location and strength, a tropical cyclone is referred to by different names, including hurricane, typhoon, tropical storm, cyclonic storm, tropical depression, or simply cyclone. A hurricane is a strong tropical cyclone that occurs in the Atlantic Ocean or northeastern Pacific Ocean, and a typhoon occurs in the northwestern Pacific Ocean. In the Indian Ocean and South Pacific, comparable storms are referred to as "tropical cyclones". In modern times, on average around 80 to 90 named tropical cyclones form each year around the world, over half of which develop hurricane-force winds of 65 kn or more. Tropical cyclones carry heat and energy away from the tropics and transport it towards temperate latitudes, which plays an important role in regulating global climate.

<span class="mw-page-title-main">Tropical cyclone forecasting</span> Science of forecasting how a tropical cyclone moves and its effects

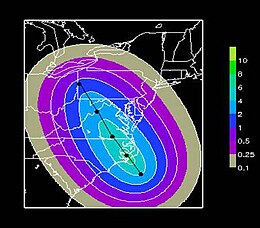
Tropical cyclone forecasting is the science of forecasting where a tropical cyclone's center, and its effects, are expected to be at some point in the future. There are several elements to tropical cyclone forecasting: track forecasting, intensity forecasting, rainfall forecasting, storm surge, tornado, and seasonal forecasting. While skill is increasing in regard to track forecasting, intensity forecasting skill remains unchanged over the past several years. Seasonal forecasting began in the 1980s in the Atlantic basin and has spread into other basins in the years since.

<span class="mw-page-title-main">Tropical cyclone track forecasting</span> Predicting where a tropical cyclone is going to track over the next five days, every 6 to 12 hours

Tropical cyclone track forecasting involves predicting where a tropical cyclone is going to track over the next five days, every 6 to 12 hours. The history of tropical cyclone track forecasting has evolved from a single-station approach to a comprehensive approach which uses a variety of meteorological tools and methods to make predictions. The weather of a particular location can show signs of the approaching tropical cyclone, such as increasing swell, increasing cloudiness, falling barometric pressure, increasing tides, squalls and heavy rainfall.

<span class="mw-page-title-main">Hurricane Weather Research and Forecasting Model</span> Long-range numerical model used to forecast tropical cyclones

The Hurricane Weather Research and Forecasting (HWRF) model is a specialized version of the weather research and forecasting model and is used to forecast the track and intensity of tropical cyclones. The model was developed by the National Oceanic and Atmospheric Administration (NOAA), the U.S. Naval Research Laboratory, the University of Rhode Island, and Florida State University. It became operational in 2007.

The Hurricane Databases (HURDAT), managed by the National Hurricane Center (NHC), are two separate databases that contain details on tropical cyclones, that have occurred within the Atlantic Ocean and Eastern Pacific Ocean since 1851 and 1949 respectively.

<span class="mw-page-title-main">History of numerical weather prediction</span> Aspect of meteorological history

The history of numerical weather prediction considers how current weather conditions as input into mathematical models of the atmosphere and oceans to predict the weather and future sea state has changed over the years. Though first attempted manually in the 1920s, it was not until the advent of the computer and computer simulation that computation time was reduced to less than the forecast period itself. ENIAC was used to create the first forecasts via computer in 1950, and over the years more powerful computers have been used to increase the size of initial datasets and use more complicated versions of the equations of motion. The development of global forecasting models led to the first climate models. The development of limited area (regional) models facilitated advances in forecasting the tracks of tropical cyclone as well as air quality in the 1970s and 1980s.

<span class="mw-page-title-main">Glossary of tropical cyclone terms</span>

The following is a glossary of tropical cyclone terms.

<span class="mw-page-title-main">History of Atlantic hurricane warnings</span> Aspect of meteorological history

The history of Atlantic tropical cyclone warnings details the progress of tropical cyclone warnings in the North Atlantic Ocean. The first service was set up in the 1870s from Cuba with the work of Father Benito Viñes. After his death, hurricane warning services were assumed by the US Army Signal Corps and United States Weather Bureau over the next few decades, first based in Jamaica and Cuba before shifting to Washington, D.C. The central office in Washington, which would evolve into the National Meteorological Center and the Weather Prediction Center, assumed the responsibilities by the early 20th century. This responsibility passed to regional hurricane offices in 1935, and the concept of the Atlantic hurricane season was established to keep a vigilant lookout for tropical cyclones during certain times of the year. Hurricane advisories issued every 12 hours by the regional hurricane offices began at this time.

<span class="mw-page-title-main">Automated Tropical Cyclone Forecasting System</span> Software used to predict and forecast tropical cyclogenesis and to track tropical cyclones

The Automated Tropical Cyclone Forecasting System (ATCF) is a piece of software originally developed to run on a personal computer for the Joint Typhoon Warning Center (JTWC) in 1988, and the National Hurricane Center (NHC) in 1990. ATCF remains the main piece of forecasting software used for the United States Government, including the JTWC, NHC, and Central Pacific Hurricane Center. Other tropical cyclone centers in Australia and Canada developed similar software in the 1990s. The data files with ATCF lie within three decks, known as the a-, b-, and f-decks. The a-decks include forecast information, the b-decks contain a history of center fixes at synoptic hours, and the f-decks include the various fixes made by various analysis center at various times. In the years since its introduction, it has been adapted to Unix and Linux platforms.

Tropical Cyclone Heat Potential (TCHP) is one of such non-conventional oceanographic parameters influencing the tropical cyclone intensity. The relationship between Sea Surface Temperature (SST) and cyclone intensity has been long studied in statistical intensity prediction schemes such as the National Hurricane Center Statistical Hurricane Intensity Prediction Scheme (SHIPS) and Statistical Typhoon Intensity Prediction Scheme (STIPS). STIPS is run at the Naval Research Laboratory in Monterey, California, and is provided to Joint Typhoon Warning Centre (JTWC) to make cyclone intensity forecasts in the western North Pacific, South Pacific, and Indian Oceans. In most of the cyclone models, SST is the only oceanographic parameter representing heat exchange. However, cyclones have long been known to interact with the deeper layers of ocean rather than sea surface alone. Using a coupled ocean atmospheric model, Mao et al., concluded that the rate of intensification and final intensity of cyclone were sensitive to the initial spatial distribution of the mixed layer rather than to SST alone. Similarly, Namias and Canyan observed patterns of lower atmospheric anomalies being more consistent with the upper ocean thermal structure variability than SST. 

References

  1. 1 2 3 4 5 6 7 8 9 National Hurricane Center (July 2009). "Technical Summary of the National Hurricane Center Track and Intensity Models" (PDF). National Oceanic and Atmospheric Administration. pp. 1–7. Retrieved 26 February 2011.
  2. 1 2 3 4 5 6 Chan, Johnny C. L. & Jeffrey D. Kepert (2010). Global Perspectives on Tropical Cyclones: From Science to Mitigation. World Scientific. pp. 288–292. ISBN   978-981-4293-47-1 . Retrieved 24 February 2011.
  3. Knaff, John A.; Demaria, Mark; Sampson, Charles R.; Gross, James M. (February 2003). "Statistical, 5-Day Tropical Cyclone Intensity Forecasts Derived from Climatology and Persistence" (PDF). Weather and Forecasting. 18: 80–81. Bibcode:2003WtFor..18...80K. doi:10.1175/1520-0434(2003)018<0080:SDTCIF>2.0.CO;2. ISSN   1520-0434 . Retrieved 25 February 2011.
  4. 1 2 Simpson, Robert H. (2003). Hurricane!: coping with disaster : progress and challenges since Galveston, 1900. American Geophysical Union. p. 110. ISBN   978-0-87590-297-5 . Retrieved 25 February 2011.
  5. Franklin, James (20 April 2010). "National Hurricane Center Forecast Verification". National Hurricane Center . Retrieved 2 January 2011.
  6. Chu, Jan-Hwa (November 1994). "A Regression Model For the Western North Pacific Tropical Cyclone Intensity Forecast". United States Naval Research Laboratory. Archived from the original on 8 April 2013. Retrieved 15 March 2011.
  7. 1 2 Sampson, Charles R., John A. Knaff, and Mark DeMaria (1 March 2006). "A Statistical Intensity Model Consensus For the Joint Typhoon Warning Center" (PDF). Retrieved 15 March 2011.{{cite web}}: CS1 maint: multiple names: authors list (link)
  8. National Research Council (U.S.). Committee on the Future of Rainfall Measuring Missions, National Research Council (U.S.). Board on Atmospheric Sciences and Climate (2007). NOAA's role in space-based global precipitation estimation and application. National Academies Press. ISBN   978-0-309-10298-8.
  9. R.W. Burpee (2008). "The Sanders Barotropic Tropical Cyclone Track Prediction Model (SANBAR)". Meteorological Monographs. 33 (55): 233–240. doi: 10.1175/0065-9401-33.55.233 .
  10. Jelesnianski, C. P., J. Chen, and W. A. Shaffer (April 1992). "SLOSH: Sea, lake, and Overland Surges from Hurricanes. NOAA Technical Report NWS 48" (PDF). National Oceanic and Atmospheric Administration. p. 2. Retrieved 15 March 2011.{{cite web}}: CS1 maint: multiple names: authors list (link)
  11. Shuman, Frederick G. (September 1989). "History of Numerical Weather Prediction at the National Meteorological Center". Weather and Forecasting . 4 (3): 286–296. Bibcode:1989WtFor...4..286S. doi: 10.1175/1520-0434(1989)004<0286:HONWPA>2.0.CO;2 . ISSN   1520-0434.
  12. Le Marshall; J. F.; L. M. Leslie & A. F. Bennett (1996). "Tropical Cyclone Beti – an Example of the Benefits of Assimilating Hourly Satellite Wind Data" (PDF). Australian Meteorological Magazine. 45: 275.
  13. Geophysical Fluid Dynamics Laboratory (28 January 2011). "Operational Hurricane Track and Intensity Forecasting". National Oceanic and Atmospheric Administration . Retrieved 25 February 2011.
  14. Jarvinen B. J. & C. J. Neumann (1985). "An evaluation of the SLOSH storm surge model". Bulletin of the American Meteorological Society. 66 (11): 1408–1411. Bibcode:1985BAMS...66.1408.. doi: 10.1175/1520-0477-66.11.1408 .
  15. Glossary of Meteorology (June 2000). "Beta Effect". American Meteorological Society. Archived from the original on 6 June 2011. Retrieved 5 May 2008.
  16. "Section 1. Influences on Tropical Cyclone Motion". United States Navy. 2011. Retrieved 25 February 2011.
  17. Warner, Thomas Tomkins (2010). Numerical Weather and Climate Prediction. Cambridge University Press. pp. 266–275. ISBN   978-0-521-51389-0 . Retrieved 11 February 2011.
  18. Demaria, Mark; Aberson, Sim D.; Ooyama, Katsuyuki V.; Lord, Stephen J. (1992). "A Nested Spectral Model for Hurricane Track Forecasting". Monthly Weather Review. 120 (8): 1628–1643. Bibcode:1992MWRv..120.1628D. doi: 10.1175/1520-0493(1992)120<1628:ANSMFH>2.0.CO;2 . ISSN   1520-0493.
  19. Hubbert, Graeme D., Greg J. Holland, Lance M. Leslie, Michael J. Manton (March 1991). "Computer Techniques: A Real-Time System For Forecasting Tropical Cyclone Storm Surges". Weather and Forecasting. 6 (1): 86–87. Bibcode:1991WtFor...6...86H. doi: 10.1175/1520-0434(1991)006<0086:ARTSFF>2.0.CO;2 . ISSN   1520-0434.{{cite journal}}: CS1 maint: multiple names: authors list (link)
  20. Zschau, Jochen & Andreas N. Küppers (2003). Early warning systems for natural disaster reduction. Springer. p. 172. ISBN   978-3-540-67962-2 . Retrieved 16 March 2011.
  21. Higaki, Masakazu, Hironori Hayashibara, and Futoshi Nozaki (20 April 2009). "Outline of the Storm Surge Prediction Model at the Japan Meteorological Agency" (PDF). Japan Meteorological Agency. p. 25. Retrieved 15 March 2011.{{cite web}}: CS1 maint: multiple names: authors list (link)
  22. "Weather Forecast Accuracy Gets Boost with New Computer Model". UCAR press release. Archived from the original on 19 May 2007. Retrieved 9 July 2007.
  23. "New Advanced Hurricane Model Aids NOAA Forecasters". NOAA Magazine . Retrieved 9 July 2007.
  24. Rappaport, Edward N.; Franklin, James L.; Avila, Lixion A.; Baig, Stephen R.; Beven, John L.; Blake, Eric S.; Burr, Christopher A.; Jiing, Jiann-Gwo; Juckins, Christopher A.; Knabb, Richard D.; Landsea, Christopher W.; Mainelli, Michelle; Mayfield, Max; McAdie, Colin J.; Pasch, Richard J.; Sisko, Christopher; Stewart, Stacy R.; Tribble, Ahsha N. (April 2009). "Advances and Challenges at the National Hurricane Center". Weather and Forecasting. 24 (2): 395–419. Bibcode:2009WtFor..24..395R. CiteSeerX   10.1.1.207.4667 . doi:10.1175/2008WAF2222128.1. S2CID   14845745.
  25. Franklin, James L. (21 May 2006). "2005 National Hurricane Center Forecast Verification Report" (PDF). National Hurricane Center. p. 6. Retrieved 26 February 2011.
  26. Kimberlain, Todd (June 2007). "Tropical cyclone motion and intensity talk". Hydrometeorological Prediction Center . Retrieved 21 July 2007.
  27. Epstein, E.S. (December 1969). "Stochastic dynamic prediction". Tellus . 21 (6): 739–759. Bibcode:1969Tell...21..739E. doi:10.1111/j.2153-3490.1969.tb00483.x.
  28. Grimit, Eric P.; Mass, Clifford F. (October 2004). "Redefining the Ensemble Spread-Skill Relationship from a Probabilistic Perspective" (PDF). University of Washington. Archived from the original (PDF) on 12 October 2008. Retrieved 2 January 2010.
  29. Zhou, Binbin; Du, Jun (February 2010). "Fog Prediction From a Multimodel Mesoscale Ensemble Prediction System" (PDF). Weather and Forecasting . 25 (1): 303–322. Bibcode:2010WtFor..25..303Z. doi:10.1175/2009WAF2222289.1. S2CID   4947206 . Retrieved 2 January 2011.
  30. Yamaguchi, Munehiko & Takuya Komori (20 April 2009). "Outline of the Typhoon Ensemble Prediction System at the Japan Meteorological Agency" (PDF). Japan Meteorological Agency. pp. 14–15. Retrieved 15 March 2011.
  31. Palmer, Tim & Renate Hagedorn (2006). Predictability of weather and climate. Cambridge University Press. pp. 532–545. ISBN   978-0-521-84882-4 . Retrieved 26 February 2011.
  32. Sampson, Charles R., John A. Knaff, and Edward M. Fukada (June 2007). "Notes and Correspondence: Operational Evaluation of a Selective Consensus in the Western North Pacific Basin". Weather and Forecasting. 22 (3): 671–675. Bibcode:2007WtFor..22..671S. doi: 10.1175/WAF991.1 .{{cite journal}}: CS1 maint: multiple names: authors list (link)
  33. Waymer, Jim (1 June 2010). "Researchers:Fewer sunspots, more storms". Melbourne, Florida: Florida Today. pp. 1A.
  34. [NULL]. "Hurricanes: Science and Society: Hurricane Forecast Model Accuracy".