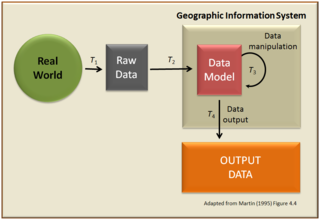
A geographic information system (GIS) consists of integrated computer hardware and software that store, manage, analyze, edit, output, and visualize geographic data. Much of this often happens within a spatial database, however, this is not essential to meet the definition of a GIS. In a broader sense, one may consider such a system also to include human users and support staff, procedures and workflows, the body of knowledge of relevant concepts and methods, and institutional organizations.
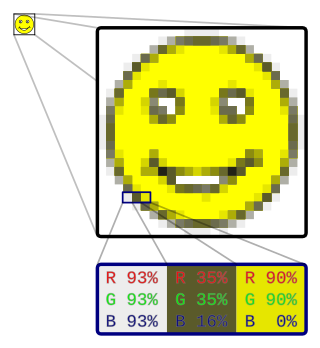
In computer graphics and digital photography, a raster graphic represents a two-dimensional picture as a rectangular matrix or grid of pixels, viewable via a computer display, paper, or other display medium. A raster is technically characterized by the width and height of the image in pixels and by the number of bits per pixel. Raster images are stored in image files with varying dissemination, production, generation, and acquisition formats.

A digital elevation model (DEM) or digital surface model (DSM) is a 3D computer graphics representation of elevation data to represent terrain or overlaying objects, commonly of a planet, moon, or asteroid. A "global DEM" refers to a discrete global grid. DEMs are used often in geographic information systems (GIS), and are the most common basis for digitally produced relief maps. A digital terrain model (DTM) represents specifically the ground surface while DEM and DSM may represent tree top canopy or building roofs.

Topography is the study of the forms and features of land surfaces. The topography of an area may refer to the land forms and features themselves, or a description or depiction in maps.

In 3D computer graphics, hidden-surface determination is the process of identifying what surfaces and parts of surfaces can be seen from a particular viewing angle. A hidden-surface determination algorithm is a solution to the visibility problem, which was one of the first major problems in the field of 3D computer graphics. The process of hidden-surface determination is sometimes called hiding, and such an algorithm is sometimes called a hider. When referring to line rendering it is known as hidden-line removal. Hidden-surface determination is necessary to render a scene correctly, so that one may not view features hidden behind the model itself, allowing only the naturally viewable portion of the graphic to be visible.

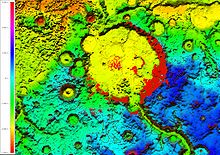
Synthetic-aperture radar (SAR) is a form of radar that is used to create two-dimensional images or three-dimensional reconstructions of objects, such as landscapes. SAR uses the motion of the radar antenna over a target region to provide finer spatial resolution than conventional stationary beam-scanning radars. SAR is typically mounted on a moving platform, such as an aircraft or spacecraft, and has its origins in an advanced form of side looking airborne radar (SLAR). The distance the SAR device travels over a target during the period when the target scene is illuminated creates the large synthetic antenna aperture. Typically, the larger the aperture, the higher the image resolution will be, regardless of whether the aperture is physical or synthetic – this allows SAR to create high-resolution images with comparatively small physical antennas. For a fixed antenna size and orientation, objects which are further away remain illuminated longer – therefore SAR has the property of creating larger synthetic apertures for more distant objects, which results in a consistent spatial resolution over a range of viewing distances.
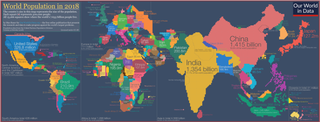
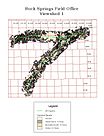
A cartogram is a thematic map of a set of features, in which their geographic size is altered to be directly proportional to a selected variable, such as travel time, population, or Gross National Product. Geographic space itself is thus warped, sometimes extremely, in order to visualize the distribution of the variable. It is one of the most abstract types of map; in fact, some forms may more properly be called diagrams. They are primarily used to display emphasis and for analysis as nomographs.
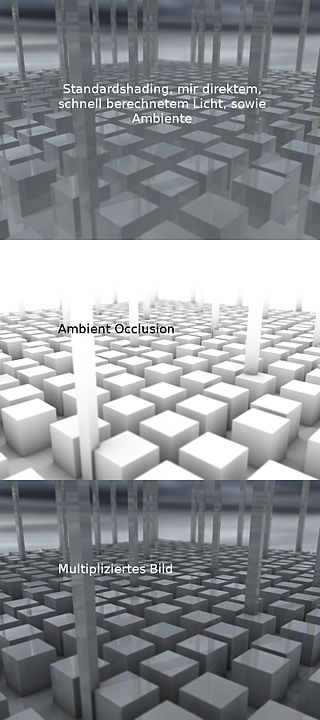
In 3D computer graphics, modeling, and animation, ambient occlusion is a shading and rendering technique used to calculate how exposed each point in a scene is to ambient lighting. For example, the interior of a tube is typically more occluded than the exposed outer surfaces, and becomes darker the deeper inside the tube one goes.

A viewshed is the geographical area that is visible from a location. It includes all surrounding points that are in line-of-sight with that location and excludes points that are beyond the horizon or obstructed by terrain and other features. Conversely, it can also refer to area from which an object can be seen. A viewshed is not necessarily "visible" to humans; the same concept is used in radio communications to indicate where a specific combination of transmitter, antenna, and terrain allow reception of signal.

In geometry, an isovist is the volume of space visible from a given point in space, together with a specification of the location of that point. It is a geometric concept coined by Clifford Tandy in 1967 and further refined by the architect Michael Benedikt.

In computer graphics, a triangulated irregular network (TIN) is a representation of a continuous surface consisting entirely of triangular facets, used mainly as Discrete Global Grid in primary elevation modeling.
Geomorphometry, or geomorphometrics, is the science and practice of measuring the characteristics of terrain, the shape of the surface of the Earth, and the effects of this surface form on human and natural geography. It gathers various mathematical, statistical and image processing techniques that can be used to quantify morphological, hydrological, ecological and other aspects of a land surface. Common synonyms for geomorphometry are geomorphological analysis, terrain morphometry, terrain analysis, and land surface analysis. Geomorphometrics is the discipline based on the computational measures of the geometry, topography and shape of the Earth's horizons, and their temporal change. This is a major component of geographic information systems (GIS) and other software tools for spatial analysis.
Map algebra is an algebra for manipulating geographic data, primarily fields. Developed by Dr. Dana Tomlin and others in the late 1970s, it is a set of primitive operations in a geographic information system (GIS) which allows one or more raster layers ("maps") of similar dimensions to produce a new raster layer (map) using mathematical or other operations such as addition, subtraction etc.
Binocular disparity refers to the difference in image location of an object seen by the left and right eyes, resulting from the eyes’ horizontal separation (parallax). The brain uses binocular disparity to extract depth information from the two-dimensional retinal images in stereopsis. In computer vision, binocular disparity refers to the difference in coordinates of similar features within two stereo images.
In geometry, visibility is a mathematical abstraction of the real-life notion of visibility.

Hemispherical photography, also known as canopy photography, is a technique to estimate solar radiation and characterize plant canopy geometry using photographs taken looking upward through an extreme wide-angle lens or a fisheye lens. Typically, the viewing angle approaches or equals 180-degrees, such that all sky directions are simultaneously visible. The resulting photographs record the geometry of visible sky, or conversely the geometry of sky obstruction by plant canopies or other near-ground features. This geometry can be measured precisely and used to calculate solar radiation transmitted through plant canopies, as well as to estimate aspects of canopy structure such as leaf area index. Detailed treatments of field and analytical methodology have been provided by Paul Rich and Robert Pearcy (1989).
In statistics, multivariate adaptive regression splines (MARS) is a form of regression analysis introduced by Jerome H. Friedman in 1991. It is a non-parametric regression technique and can be seen as an extension of linear models that automatically models nonlinearities and interactions between variables.
In forestry, a tree crown measurement is one of the tree measurements taken at the crown of a tree, which consists of the mass of foliage and branches growing outward from the trunk of the tree. The average crown spread is the average horizontal width of the crown, taken from dripline to dripline as one moves around the crown. The dripline is the outer boundary to the area located directly under the outer circumference of the tree branches. When the tree canopy gets wet, any excess water is shed to the ground along this dripline. Some listings will also list the maximum crown spread which represents the greatest width from dripline to dripline across the crown. Other crown measurements that are commonly taken include limb length, crown volume, and foliage density. Canopy mapping surveys the position and size of all of the limbs down to a certain size in the crown of the tree and is commonly used when measuring the overall wood volume of a tree.

Long-distance observation is any visual observation, for sightseeing or photography, that targets all the objects, visible from the extremal distance with the possibility to see them closely. The long-distance observations can't cover:
In spatial analysis and geographic information systems, cost distance analysis or cost path analysis is a method for determining one or more optimal routes of travel through unconstrained (two-dimensional) space. The optimal solution is that which minimizes the total cost of the route, based on a field of cost density that varies over space due to local factors. It is thus based on the fundamental geographic principle of Friction of distance. It is an optimization problem with multiple deterministic algorithm solutions, implemented in most GIS software.