A geographic information system (GIS) consists of integrated computer hardware and software that store, manage, analyze, edit, output, and visualize geographic data. Much of this often happens within a spatial database, however, this is not essential to meet the definition of a GIS. In a broader sense, one may consider such a system also to include human users and support staff, procedures and workflows, the body of knowledge of relevant concepts and methods, and institutional organizations.

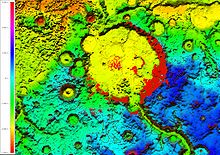
A digital elevation model (DEM) or digital surface model (DSM) is a 3D computer graphics representation of elevation data to represent terrain or overlaying objects, commonly of a planet, moon, or asteroid. A "global DEM" refers to a discrete global grid. DEMs are used often in geographic information systems (GIS), and are the most common basis for digitally produced relief maps. A digital terrain model (DTM) represents specifically the ground surface while DEM and DSM may represent tree top canopy or building roofs.

Topography is the study of the forms and features of land surfaces. The topography of an area may refer to the land forms and features themselves, or a description or depiction in maps.

A chart is a graphical representation for data visualization, in which "the data is represented by symbols, such as bars in a bar chart, lines in a line chart, or slices in a pie chart". A chart can represent tabular numeric data, functions or some kinds of quality structure and provides different info.

Space syntax is a set of theories and techniques for the analysis of spatial configurations. It was conceived by Bill Hillier, Julienne Hanson, and colleagues at The Bartlett, University College London in the late 1970s to early 1980s to develop insights into the mutually constructive relation between society and space. As space syntax has evolved, certain measures have been found to correlate with human spatial behavior, and space syntax has thus come to be used to forecast likely effects of architectural and urban space on users.
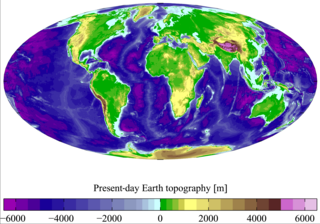
Terrain or relief involves the vertical and horizontal dimensions of land surface. The term bathymetry is used to describe underwater relief, while hypsometry studies terrain relative to sea level. The Latin word terra means "earth."

Whiteout, white-out, or milky weather is a weather condition in which the contours and landmarks in a snow-covered zone become almost indistinguishable. It could be also applied when visibility and contours are greatly reduced by sand. The horizon disappears from view while the sky and landscape appear featureless, leaving no points of visual reference by which to navigate; there is absence of shadows because the light arrives in equal measure from all possible directions. Whiteout has been defined as: "A condition of diffuse light when no shadows are cast, due to a continuous white cloud layer appearing to merge with the white snow surface. No surface irregularities of the snow are visible, but a dark object may be clearly seen. There is no visible horizon."

A contour line of a function of two variables is a curve along which the function has a constant value, so that the curve joins points of equal value. It is a plane section of the three-dimensional graph of the function parallel to the -plane. More generally, a contour line for a function of two variables is a curve connecting points where the function has the same particular value.

NASA WorldWind is an open-source virtual globe. According to the website, "WorldWind is an open source virtual globe API. WorldWind allows developers to quickly and easily create interactive visualizations of 3D globe, map and geographical information. Organizations around the world use WorldWind to monitor weather patterns, visualize cities and terrain, track vehicle movement, analyze geospatial data and educate humanity about the Earth." It was first developed by NASA in 2003 for use on personal computers and then further developed in concert with the open source community since 2004. As of 2017, a web-based version of WorldWind is available online. An Android version is also available.

In geometry, a simple polygon is a polygon that does not intersect itself and has no holes. That is, it is a piecewise-linear Jordan curve consisting of finitely many line segments. These polygons include as special cases the convex polygons, star-shaped polygons, and monotone polygons.
In computational geometry and robot motion planning, a visibility graph is a graph of intervisible locations, typically for a set of points and obstacles in the Euclidean plane. Each node in the graph represents a point location, and each edge represents a visible connection between them. That is, if the line segment connecting two locations does not pass through any obstacle, an edge is drawn between them in the graph. When the set of locations lies in a line, this can be understood as an ordered series. Visibility graphs have therefore been extended to the realm of time series analysis.

In geometry, an isovist is the volume of space visible from a given point in space, together with a specification of the location of that point. It is a geometric concept coined by Clifford Tandy in 1967 and further refined by the architect Michael Benedikt.
Spatial network analysis software packages are analytic software used to prepare graph-based analysis of spatial networks. They stem from research fields in transportation, architecture, and urban planning. The earliest examples of such software include the work of Garrison (1962), Kansky (1963), Levin (1964), Harary (1969), Rittel (1967), Tabor (1970) and others in the 1960s and 70s. Specific packages address their domain-specific needs, including TransCAD for transportation, GIS for planning and geography, and Axman for Space syntax researchers.

Spatial analysis is any of the formal techniques which studies entities using their topological, geometric, or geographic properties. Spatial analysis includes a variety of techniques using different analytic approaches, especially spatial statistics. It may be applied in fields as diverse as astronomy, with its studies of the placement of galaxies in the cosmos, or to chip fabrication engineering, with its use of "place and route" algorithms to build complex wiring structures. In a more restricted sense, spatial analysis is geospatial analysis, the technique applied to structures at the human scale, most notably in the analysis of geographic data. It may also be applied to genomics, as in transcriptomics data.
Geomorphometry, or geomorphometrics, is the science and practice of measuring the characteristics of terrain, the shape of the surface of the Earth, and the effects of this surface form on human and natural geography. It gathers various mathematical, statistical and image processing techniques that can be used to quantify morphological, hydrological, ecological and other aspects of a land surface. Common synonyms for geomorphometry are geomorphological analysis, terrain morphometry, terrain analysis, and land surface analysis. Geomorphometrics is the discipline based on the computational measures of the geometry, topography and shape of the Earth's horizons, and their temporal change. This is a major component of geographic information systems (GIS) and other software tools for spatial analysis.
An evolutionary landscape is a metaphor or a construct used to think about and visualize the processes of evolution acting on a biological entity. This entity can be viewed as searching or moving through a search space. For example, the search space of a gene would be all possible nucleotide sequences. The search space is only part of an evolutionary landscape. The final component is the "y-axis", which is usually fitness. Each value along the search space can result in a high or low fitness for the entity. If small movements through search space cause changes in fitness that are relatively small, then the landscape is considered smooth. Smooth landscapes happen when most fixed mutations have little to no effect on fitness, which is what one would expect with the neutral theory of molecular evolution. In contrast, if small movements result in large changes in fitness, then the landscape is said to be rugged. In either case, movement tends to be toward areas of higher fitness, though usually not the global optima.
Terrain cartography or relief mapping is the depiction of the shape of the surface of the Earth on a map, using one or more of several techniques that have been developed. Terrain or relief is an essential aspect of physical geography, and as such its portrayal presents a central problem in cartographic design, and more recently geographic information systems and geovisualization.
In geometry, visibility is a mathematical abstraction of the real-life notion of visibility.
Viewshed analysis is a computational algorithm that delineates a viewshed, the area that is visible from a given location. It is a common part of the terrain analysis toolset found in most geographic information system (GIS) software. The analysis uses the elevation value of each cell of the digital elevation model (DEM) to determine visibility to or from a particular cell. The location of this particular cell varies depending on the needs of the analysis. For example, a viewshed analysis is commonly used to locate communication towers or determining the view from a road. Viewsheds can be calculated using an individual point such as a tower or multiple points such as a line representing a road. When analyzing a line segment, each of the vertices along the line is calculated to determine its visible area. The process can also be reversed. For example, when locating a landfill, the analysis can determine from where the landfill is visible to keep it hidden from view.
This is a glossary of terms relating to computer graphics.