Rendering or image synthesis is the process of generating a photorealistic or non-photorealistic image from a 2D or 3D model by means of a computer program. The resulting image is referred to as the render. Multiple models can be defined in a scene file containing objects in a strictly defined language or data structure. The scene file contains geometry, viewpoint, texture, lighting, and shading information describing the virtual scene. The data contained in the scene file is then passed to a rendering program to be processed and output to a digital image or raster graphics image file. The term "rendering" is analogous to the concept of an artist's impression of a scene. The term "rendering" is also used to describe the process of calculating effects in a video editing program to produce the final video output.

In 3D computer graphics, radiosity is an application of the finite element method to solving the rendering equation for scenes with surfaces that reflect light diffusely. Unlike rendering methods that use Monte Carlo algorithms, which handle all types of light paths, typical radiosity only account for paths which leave a light source and are reflected diffusely some number of times before hitting the eye. Radiosity is a global illumination algorithm in the sense that the illumination arriving on a surface comes not just directly from the light sources, but also from other surfaces reflecting light. Radiosity is viewpoint independent, which increases the calculations involved, but makes them useful for all viewpoints.

In 3D computer graphics, ray tracing is a technique for modeling light transport for use in a wide variety of rendering algorithms for generating digital images.

In 3D computer graphics, a voxel represents a value on a regular grid in three-dimensional space. As with pixels in a 2D bitmap, voxels themselves do not typically have their position explicitly encoded with their values. Instead, rendering systems infer the position of a voxel based upon its position relative to other voxels.

Tomography is imaging by sections or sectioning that uses any kind of penetrating wave. The method is used in radiology, archaeology, biology, atmospheric science, geophysics, oceanography, plasma physics, materials science, astrophysics, quantum information, and other areas of science. The word tomography is derived from Ancient Greek τόμος tomos, "slice, section" and γράφω graphō, "to write" or, in this context as well, "to describe." A device used in tomography is called a tomograph, while the image produced is a tomogram.

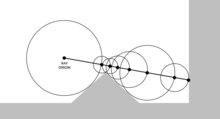
Ray casting is the methodological basis for 3D CAD/CAM solid modeling and image rendering. It is essentially the same as ray tracing for computer graphics where virtual light rays are "cast" or "traced" on their path from the focal point of a camera through each pixel in the camera sensor to determine what is visible along the ray in the 3D scene. The term "Ray Casting" was introduced by Scott Roth while at the General Motors Research Labs from 1978–1980. His paper, "Ray Casting for Modeling Solids", describes modeled solid objects by combining primitive solids, such as blocks and cylinders, using the set operators union (+), intersection (&), and difference (-). The general idea of using these binary operators for solid modeling is largely due to Voelcker and Requicha's geometric modelling group at the University of Rochester. See Solid modeling for a broad overview of solid modeling methods. This figure on the right shows a U-Joint modeled from cylinders and blocks in a binary tree using Roth's ray casting system, circa 1979.

Scientific visualization is an interdisciplinary branch of science concerned with the visualization of scientific phenomena. It is also considered a subset of computer graphics, a branch of computer science. The purpose of scientific visualization is to graphically illustrate scientific data to enable scientists to understand, illustrate, and glean insight from their data. Research into how people read and misread various types of visualizations is helping to determine what types and features of visualizations are most understandable and effective in conveying information.

In scientific visualization and computer graphics, volume rendering is a set of techniques used to display a 2D projection of a 3D discretely sampled data set, typically a 3D scalar field.
In computer graphics, texture filtering or texture smoothing is the method used to determine the texture color for a texture mapped pixel, using the colors of nearby texels. There are two main categories of texture filtering, magnification filtering and minification filtering. Depending on the situation texture filtering is either a type of reconstruction filter where sparse data is interpolated to fill gaps (magnification), or a type of anti-aliasing (AA), where texture samples exist at a higher frequency than required for the sample frequency needed for texture fill (minification). Put simply, filtering describes how a texture is applied at many different shapes, size, angles and scales. Depending on the chosen filter algorithm the result will show varying degrees of blurriness, detail, spatial aliasing, temporal aliasing and blocking. Depending on the circumstances filtering can be performed in software or in hardware for real time or GPU accelerated rendering or in a mixture of both. For most common interactive graphical applications modern texture filtering is performed by dedicated hardware which optimizes memory access through memory cacheing and pre-fetch and implements a selection of algorithms available to the user and developer.
A volumetric display device is a display device that forms a visual representation of an object in three physical dimensions, as opposed to the planar image of traditional screens that simulate depth through a number of different visual effects. One definition offered by pioneers in the field is that volumetric displays create 3D imagery via the emission, scattering, or relaying of illumination from well-defined regions in (x,y,z) space.
Beam tracing is an algorithm to simulate wave propagation. It was developed in the context of computer graphics to render 3D scenes, but it has been also used in other similar areas such as acoustics and electromagnetism simulations.

Path tracing is a computer graphics Monte Carlo method of rendering images of three-dimensional scenes such that the global illumination is faithful to reality. Fundamentally, the algorithm is integrating over all the illuminance arriving to a single point on the surface of an object. This illuminance is then reduced by a surface reflectance function (BRDF) to determine how much of it will go towards the viewpoint camera. This integration procedure is repeated for every pixel in the output image. When combined with physically accurate models of surfaces, accurate models of real light sources, and optically correct cameras, path tracing can produce still images that are indistinguishable from photographs.

In mathematics and its applications, the signed distance function is the orthogonal distance of a given point x to the boundary of a set Ω in a metric space, with the sign determined by whether or not x is in the interior of Ω. The function has positive values at points x inside Ω, it decreases in value as x approaches the boundary of Ω where the signed distance function is zero, and it takes negative values outside of Ω. However, the alternative convention is also sometimes taken instead.

Computer graphics deals with generating images with the aid of computers. Today, computer graphics is a core technology in digital photography, film, video games, cell phone and computer displays, and many specialized applications. A great deal of specialized hardware and software has been developed, with the displays of most devices being driven by computer graphics hardware. It is a vast and recently developed area of computer science. The phrase was coined in 1960 by computer graphics researchers Verne Hudson and William Fetter of Boeing. It is often abbreviated as CG, or typically in the context of film as computer generated imagery (CGI). The non-artistic aspects of computer graphics are the subject of computer science research.

Voreen is an open-source volume visualization library and development platform. Through the use of GPU-based volume rendering techniques it allows high frame rates on standard graphics hardware to support interactive volume exploration.
Voxel Space was a voxel raster graphics rendering engine invented by Novalogic developer and vice-president of technology, Kyle Freeman. The company was issued a patent for the technology in early 2000.
Vaa3D is an Open Source visualization and analysis software suite created mainly by Hanchuan Peng and his team at Janelia Research Campus, HHMI and Allen Institute for Brain Science. The software performs 3D, 4D and 5D rendering and analysis of very large image data sets, especially those generated using various modern microscopy methods, and associated 3D surface objects. This software has been used in several large neuroscience initiatives and a number of applications in other domains. In a recent Nature Methods review article, it has been viewed as one of the leading open-source software suites in the related research fields. In addition, research using this software was awarded the 2012 Cozzarelli Prize from the National Academy of Sciences.
Ray marching is a class of rendering methods for 3D computer graphics where rays are traversed iteratively, effectively dividing each ray into smaller ray segments, sampling some function at each step. This function can encode volumetric data for volume ray casting, distance fields for accelerated intersection finding of surfaces, among other information.
This is a glossary of terms relating to computer graphics.
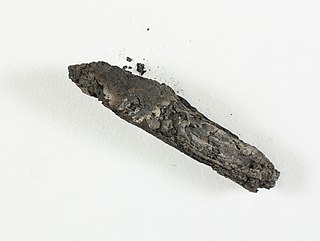
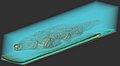
The En-Gedi Scroll is an ancient Hebrew parchment found in 1970 at Ein Gedi, Israel. Radiocarbon testing dates the scroll to the third or fourth century CE, although paleographical considerations suggest that the scrolls may date back to the first or second century CE. This scroll was discovered to contain a portion of the biblical Book of Leviticus, making it the earliest copy of a Pentateuchal book ever found in a Holy Ark. The deciphered text fragment is identical to what was to become, during the Middle Ages, the standard text of the Hebrew Bible, known as the Masoretic Text, which it precedes by several centuries, and constitutes the earliest evidence of this authoritative text version. Damaged by a fire in approximately 600 CE, the scroll is badly charred and fragmented and required noninvasive scientific and computational techniques to virtually unwrap and read, which was completed in 2015 by a team led by Prof. Seales of the University of Kentucky.