| |||||||||||||||||||||||||
All 30 Texas seats to the United States House of Representatives | |||||||||||||||||||||||||
---|---|---|---|---|---|---|---|---|---|---|---|---|---|---|---|---|---|---|---|---|---|---|---|---|---|
| |||||||||||||||||||||||||
|
Elections in Texas |
---|
Government |
The 1998 United States House of Representatives elections in Texas occurred on November 3, 1998, to elect the members of the state of Texas's delegation to the United States House of Representatives. Texas had thirty seats in the House, apportioned according to the 1990 United States census. [1]
These elections occurred simultaneously with the United States Senate elections of 1998, the United States House elections in other states, and various state and local elections.
1998 United States House of Representatives elections in Texas [2] | ||||||
---|---|---|---|---|---|---|
Party | Votes | Percentage | Seats before | Seats after | +/– | |
Republican | 1,786,731 | 51.61% | 13 | 13 | - | |
Democratic | 1,531,234 | 44.23% | 17 | 17 | - | |
Libertarian | 136,688 | 3.95% | 0 | 0 | - | |
Independent | 7,232 | 0.21% | 0 | 0 | - | |
Totals | 3,461,885 | 100.00% | 30 | 30 | — |
Incumbent Democrat Max Sandlin ran for re-election.
Party | Candidate | Votes | % | |
---|---|---|---|---|
Democratic | Max Sandlin (incumbent) | 80,788 | 59.41 | |
Republican | Dennis Boerner | 55,191 | 40.59 | |
Total votes | 135,979 | 100 | ||
Democratic hold | ||||
Incumbent Democrat Jim Turner ran for re-election.
Party | Candidate | Votes | % | |
---|---|---|---|---|
Democratic | Jim Turner (incumbent) | 81,556 | 58.43 | |
Republican | Brian Babin | 56,891 | 40.76 | |
Libertarian | Wendell Drye | 1,142 | 0.82 | |
Total votes | 139,589 | 100 | ||
Democratic hold | ||||
Incumbent Republican Sam Johnson ran for re-election.
Party | Candidate | Votes | % | |
---|---|---|---|---|
Republican | Sam Johnson (incumbent) | 106,690 | 91.21 | |
Libertarian | Ken Ashby | 10,288 | 8.79 | |
Total votes | 116,978 | 100 | ||
Republican hold | ||||
Incumbent Democrat Ralph Hall ran for re-election.
Party | Candidate | Votes | % | |
---|---|---|---|---|
Democratic | Ralph M. Hall (incumbent) | 82,989 | 57.60 | |
Republican | Jim Lohmeyer | 58,954 | 40.92 | |
Libertarian | Jim Simon | 2,137 | 1.48 | |
Total votes | 144,080 | 100 | ||
Democratic hold | ||||
Incumbent Republican Pete Sessions ran for re-election.
Party | Candidate | Votes | % | |
---|---|---|---|---|
Republican | Pete Sessions (incumbent) | 61,714 | 55.77 | |
Democratic | Victor Morales | 48,073 | 43.44 | |
Libertarian | Michael Needleman | 880 | 0.80 | |
Total votes | 110,667 | 100 | ||
Republican hold | ||||
Incumbent Republican Joe Barton ran for re-election.
Party | Candidate | Votes | % | |
---|---|---|---|---|
Republican | Joe Barton (incumbent) | 112,957 | 72.93 | |
Democratic | Ben Boothe | 40,112 | 25.90 | |
Libertarian | Richard Bandlow | 1,817 | 1.17 | |
Total votes | 154,886 | 100 | ||
Republican hold | ||||
Incumbent Republican Bill Archer ran for re-election.
Party | Candidate | Votes | % | |
---|---|---|---|---|
Republican | Bill Archer (incumbent) | 111,010 | 93.33 | |
Libertarian | Drew Parks | 7,889 | 6.63 | |
Write-in | John Skone-Palmer | 47 | 0.04 | |
Total votes | 118,946 | 100 | ||
Republican hold | ||||
Incumbent Republican Kevin Brady ran for re-election.
Party | Candidate | Votes | % | |
---|---|---|---|---|
Republican | Kevin Brady (incumbent) | 123,372 | 92.80 | |
Libertarian | Don Richards | 9,576 | 7.20 | |
Total votes | 132,948 | 100 | ||
Republican hold | ||||
Incumbent Democrat Nick Lampson ran for re-election.
Party | Candidate | Votes | % | |
---|---|---|---|---|
Democratic | Nick Lampson (incumbent) | 86,055 | 63.67 | |
Republican | Tom Cottar | 49,107 | 36.33 | |
Total votes | 135,162 | 100 | ||
Democratic hold | ||||
Incumbent Democrat Lloyd Doggett ran for re-election.
Party | Candidate | Votes | % | |
---|---|---|---|---|
Democratic | Lloyd Doggett (incumbent) | 116,127 | 85.21 | |
Libertarian | Vincent May | 20,155 | 14.79 | |
Total votes | 136,282 | 100 | ||
Democratic hold | ||||
Incumbent Democrat Chet Edwards ran for re-election.
Party | Candidate | Votes | % | |
---|---|---|---|---|
Democratic | Chet Edwards (incumbent) | 71,142 | 82.43 | |
Libertarian | Vince Hanke | 15,161 | 17.57 | |
Total votes | 86,303 | 100 | ||
Democratic hold | ||||
Incumbent Republican Kay Granger ran for re-election.
Party | Candidate | Votes | % | |
---|---|---|---|---|
Republican | Kay Granger (incumbent) | 66,740 | 61.94 | |
Democratic | Tom Hall | 39,084 | 36.28 | |
Libertarian | Paul Barthel | 1,917 | 1.78 | |
Total votes | 107,741 | 100 | ||
Republican hold | ||||
Incumbent Republican Mac Thornberry ran for re-election.
Party | Candidate | Votes | % | |
---|---|---|---|---|
Republican | Mac Thornberry (incumbent) | 81,141 | 67.92 | |
Democratic | Mark Harmon | 37,027 | 30.99 | |
Libertarian | Georganne Baker Payne | 1,298 | 1.09 | |
Total votes | 119,466 | 100 | ||
Republican hold | ||||
Incumbent Republican Ron Paul ran for re-election.
Party | Candidate | Votes | % | |
---|---|---|---|---|
Republican | Ron Paul (incumbent) | 84,459 | 55.25 | |
Democratic | Loy Sneary | 68,014 | 44.49 | |
Write-in | Cynthia Newman | 390 | 0.26 | |
Total votes | 152,863 | 100 | ||
Republican hold | ||||
Incumbent Democrat Ruben Hinojosa ran for re-election.
Party | Candidate | Votes | % | |
---|---|---|---|---|
Democratic | Ruben Hinojosa (incumbent) | 47,957 | 58.36 | |
Republican | Tom Haughey | 34,221 | 41.64 | |
Total votes | 82,178 | 100 | ||
Democratic hold | ||||
Incumbent Democrat Silvestre Reyes ran for re-election.
Party | Candidate | Votes | % | |
---|---|---|---|---|
Democratic | Silvestre Reyes (incumbent) | 67,486 | 87.91 | |
Libertarian | Stu Nance | 5,329 | 6.94 | |
Independent | Lorenzo Morales | 3,952 | 5.15 | |
Total votes | 76,767 | 100 | ||
Democratic hold | ||||
Incumbent Democrat Charles Stenholm ran for re-election.
Party | Candidate | Votes | % | |
---|---|---|---|---|
Democratic | Charles Stenholm (incumbent) | 75,367 | 53.57 | |
Republican | Rudy Izzard | 63,700 | 45.28 | |
Libertarian | Gordon Mobley | 1,618 | 1.15 | |
Total votes | 140,685 | 100 | ||
Democratic hold | ||||
Incumbent Democrat Sheila Jackson Lee ran for re-election.
Party | Candidate | Votes | % | |
---|---|---|---|---|
Democratic | Sheila Jackson Lee (incumbent) | 82,091 | 89.95 | |
Libertarian | James Galvan | 9,176 | 10.05 | |
Total votes | 91,267 | 100 | ||
Democratic hold | ||||
Incumbent Republican Larry Combest ran for re-election.
Party | Candidate | Votes | % | |
---|---|---|---|---|
Republican | Larry Combest (incumbent) | 108,266 | 83.65 | |
Democratic | Sidney Blankenship | 21,162 | 16.35 | |
Total votes | 129,428 | 100 | ||
Republican hold | ||||
Incumbent Democrat Henry B. González opted to retire rather than run for re-election. He initially planned to retire prior to the end of his term, which would have led to the calling of a special election, [3] [4] but he ended up serving the entire remainder of his term. [5] His son Charlie ran for the open seat. [6]
Party | Candidate | Votes | % | |
---|---|---|---|---|
Democratic | Charlie Gonzalez | 50,356 | 63.17 | |
Republican | James Walker | 28,347 | 35.56 | |
Libertarian | Alex DePena | 1,010 | 1.27 | |
Total votes | 79,713 | 100 | ||
Democratic hold | ||||
Incumbent Republican Lamar Smith ran for re-election.
Party | Candidate | Votes | % | |
---|---|---|---|---|
Republican | Lamar Smith (incumbent) | 165,047 | 91.38 | |
Libertarian | Jeffrey Charles Blunt | 15,561 | 8.62 | |
Total votes | 180,608 | 100 | ||
Republican hold | ||||
Incumbent Republican Tom DeLay ran for re-election.
Party | Candidate | Votes | % | |
---|---|---|---|---|
Republican | Tom DeLay (incumbent) | 87,840 | 65.20 | |
Democratic | Hill Kemp | 45,386 | 33.69 | |
Libertarian | Steve Grupe | 1,494 | 1.11 | |
Total votes | 134,720 | 100 | ||
Republican hold | ||||
Incumbent Republican Henry Bonilla ran for re-election.
Party | Candidate | Votes | % | |
---|---|---|---|---|
Republican | Henry Bonilla (incumbent) | 73,177 | 63.79 | |
Democratic | Charlie Urbina Jones | 40,281 | 35.11 | |
Libertarian | Bill Stallknecht | 1,262 | 1.10 | |
Total votes | 114,720 | 100 | ||
Republican hold | ||||
Incumbent Democrat Martin Frost ran for re-election.
Party | Candidate | Votes | % | |
---|---|---|---|---|
Democratic | Martin Frost (incumbent) | 56,321 | 57.48 | |
Republican | Shawn Terry | 40,105 | 40.93 | |
Independent | George Arias | 830 | 0.85 | |
Libertarian | David Stover | 736 | 0.75 | |
Total votes | 97,992 | 100 | ||
Democratic hold | ||||
Incumbent Democrat Ken Bentsen ran for re-election.
Party | Candidate | Votes | % | |
---|---|---|---|---|
Democratic | Ken Bentsen (incumbent) | 58,591 | 57.86 | |
Republican | John Sanchez | 41,848 | 41.32 | |
Libertarian | Eric Atkisson | 830 | 0.82 | |
Total votes | 101,269 | 100 | ||
Democratic hold | ||||
Incumbent Republican Dick Armey ran for re-election.
Party | Candidate | Votes | % | |
---|---|---|---|---|
Republican | Dick Armey (incumbent) | 120,332 | 88.15 | |
Libertarian | Joe Turner | 16,182 | 11.85 | |
Total votes | 136,514 | 100 | ||
Republican hold | ||||
Incumbent Democrat Solomon Ortiz ran for re-election.
Party | Candidate | Votes | % | |
---|---|---|---|---|
Democratic | Solomon Ortiz (incumbent) | 61,638 | 63.28 | |
Republican | Erol Stone | 34,284 | 35.20 | |
Libertarian | Mark Pretz | 1,476 | 1.52 | |
Total votes | 97,398 | 100 | ||
Democratic hold | ||||
Incumbent Democrat Frank Tejeda died on January 30, 1997, from pneumonia while being treated for a brain tumor. [7] This prompted a special election to be held, which fellow Democrat Ciro Rodriguez won in a runoff. [8] He ran for re-election.
Party | Candidate | Votes | % | |
---|---|---|---|---|
Democratic | Ciro Rodriguez (incumbent) | 71,849 | 90.54 | |
Libertarian | Edward Elmer | 7,504 | 9.46 | |
Total votes | 79,353 | 100 | ||
Democratic hold | ||||
Incumbent Democrat Gene Green ran for re-election.
Party | Candidate | Votes | % | |
---|---|---|---|---|
Democratic | Gene Green (incumbent) | 44,179 | 92.75 | |
Independent | Lea Sherman | 2,013 | 4.23 | |
Libertarian | James Chudleigh | 1,439 | 3.02 | |
Total votes | 47,631 | 100 | ||
Democratic hold | ||||
Incumbent Democrat Eddie Bernice Johnson ran for re-election.
Party | Candidate | Votes | % | |
---|---|---|---|---|
Democratic | Eddie Bernice Johnson (incumbent) | 57,603 | 72.23 | |
Republican | Carrie Kelleher | 21,338 | 26.76 | |
Libertarian | Barbara Robinson | 811 | 1.02 | |
Total votes | 79,752 | 100 | ||
Democratic hold | ||||
Charles Augustine González is an American Democratic politician from Texas. He represented Texas's 20th congressional district in the U.S. House of Representatives from 1999 to 2013. He served as Chairman of Latinos for Obama and National Co-Chair of President Obama's 2012 re-election campaign.
Texas's 14th congressional district for the United States House of Representatives stretches from Freeport to Orange, Texas. It formerly covered the area south and southwest of the Greater Houston region, including Galveston, in the state of Texas.
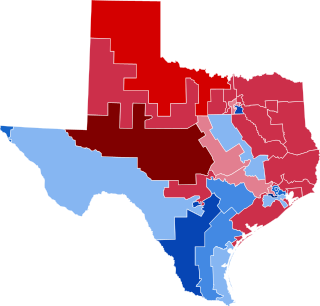
The 2006 United States House of Representatives elections in Texas were held on November 7, 2006, to determine the 32 U.S. representatives from the state of Texas, one from each of the state's 32 congressional districts. These elections coincided with the 2006 midterm elections, which included a gubernatorial election and an election to the U.S. Senate.
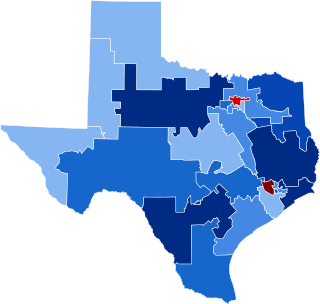
The 2010 U.S. congressional elections in Texas were held on November 2, 2010, to determine who will represent the state of Texas in the United States House of Representatives. Representatives are elected for two-year terms; those elected served in the 112th Congress from January 2011 until January 2013.
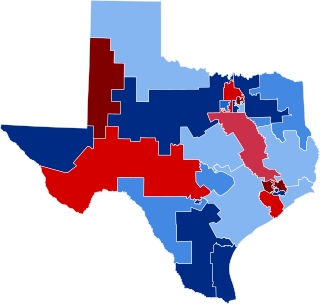
The 2004 United States House of Representatives elections in Texas occurred on November 2, 2004, to elect the members of the state of Texas's delegation to the United States House of Representatives. Texas had thirty-two seats in the House, apportioned according to the 2000 United States census.
The 1992 United States House of Representatives elections in Texas occurred on November 3, 1992, to elect the members of the state of Texas's delegation to the United States House of Representatives. Texas had thirty seats in the House, apportioned according to the 1990 United States census.
The 1984 United States House of Representatives elections in Texas occurred on November 6, 1984, to elect the members of the state of Texas's delegation to the United States House of Representatives. Texas had twenty-seven seats in the House, apportioned according to the 1980 United States census.
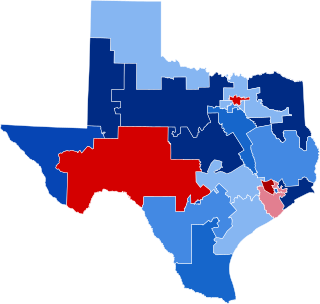
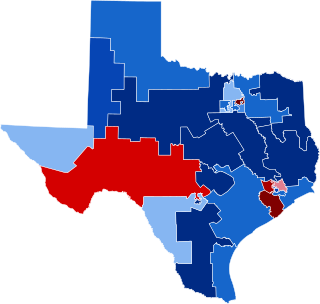
The 2002 United States House of Representatives elections in Texas occurred on November 5, 2002, to elect the members of the state of Texas's delegation to the United States House of Representatives. Texas had thirty-two seats in the House, apportioned according to the 2000 United States census. The state gained two seats in reapportionment. Democrats narrowly maintained control of the Texas House of Representatives after the 2000 election after heavily emphasizing it as necessary to protect the party from a potential Republican gerrymander. During the 2001 regular session, the divided legislature failed to pass any redistricting plans. Congressional redistricting fell to the courts in Balderas v. State of Texas after no special session was called to address redistricting. While the court's initial map appeared to benefit Republicans, the final maps ordered for the 2002 elections were seen as beneficial to Democrats.
The 1980 United States House of Representatives elections in Texas occurred on November 4, 1980, to elect the members of the state of Texas's delegation to the United States House of Representatives. Texas had twenty-four seats in the House apportioned according to the 1970 United States census.
The 1996 United States House of Representatives elections in Texas occurred on November 5, 1996, to elect the members of the state of Texas's delegation to the United States House of Representatives. Texas had thirty seats in the House, apportioned according to the 1990 United States census.
The 1986 United States House of Representatives elections in Texas occurred on November 4, 1986, to elect the members of the state of Texas's delegation to the United States House of Representatives. Texas had twenty-seven seats in the House, apportioned according to the 1980 United States census.
The 1978 United States House of Representatives elections in Texas occurred on November 7, 1978, to elect the members of the state of Texas's delegation to the United States House of Representatives. Texas had twenty-four seats in the House apportioned according to the 1970 United States census.
The 1990 United States House of Representatives elections in Texas occurred on November 6, 1990, to elect the members of the state of Texas's delegation to the United States House of Representatives. Texas had twenty-seven seats in the House, apportioned according to the 1980 United States census.
The 1994 United States House of Representatives elections in Texas occurred on November 8, 1994, to elect the members of the state of Texas's delegation to the United States House of Representatives. Texas had thirty seats in the House, apportioned according to the 1990 United States census.
The 2000 United States House of Representatives elections in Texas occurred on November 7, 2000, to elect the members of the state of Texas's delegation to the United States House of Representatives. Texas had thirty seats in the House, apportioned according to the 1990 United States census.
The 1988 United States House of Representatives elections in Texas occurred on November 8, 1988, to elect the members of the state of Texas's delegation to the United States House of Representatives. Texas had twenty-seven seats in the House, apportioned according to the 1980 United States census.
The 1974 United States House of Representatives elections in Texas occurred on November 5, 1974, to elect the members of the state of Texas's delegation to the United States House of Representatives. Texas had twenty-four seats in the House apportioned according to the 1970 United States census.
The 1976 United States House of Representatives elections in Texas occurred on November 2, 1976, to elect the members of the state of Texas's delegation to the United States House of Representatives. Texas had twenty-four seats in the House apportioned according to the 1970 United States census.
The 2016 United States House of Representatives elections in Texas were held on November 8, 2016, to elect the 36 U.S. representatives from the state of Texas, one from each of the state's 36 congressional districts. The elections coincided with the 2016 presidential election, as well as other elections to the House of Representatives, elections to the United States Senate and various state and local elections. The primaries were held on March 1.
The 1982 United States House of Representatives elections in Texas occurred on November 2, 1982, to elect the members of the state of Texas's delegation to the United States House of Representatives. Texas had twenty-seven seats in the House, up three from the 1970s, apportioned according to the 1980 United States census.
{{cite web}}
: CS1 maint: numeric names: authors list (link)