| |||||||||||||||||||||||||||||||||||||||||||||||||
All 150 seats in the Texas House of Representatives 76 seats needed for a majority | |||||||||||||||||||||||||||||||||||||||||||||||||
---|---|---|---|---|---|---|---|---|---|---|---|---|---|---|---|---|---|---|---|---|---|---|---|---|---|---|---|---|---|---|---|---|---|---|---|---|---|---|---|---|---|---|---|---|---|---|---|---|---|
| |||||||||||||||||||||||||||||||||||||||||||||||||
Republican hold Democratic hold Democratic gain Republican: 40–50% 50–60% 60–70% 70–80% 80–90% ≥90% Democratic: 40–50% 50–60% 60–70% 70–80% 80–90% ≥90% | |||||||||||||||||||||||||||||||||||||||||||||||||
|
Elections in Texas |
---|
Government |
The 2006 Texas House of Representatives elections took place as part of the biennial United States elections. Texas voters elected state representatives in all 150 State House of Representatives districts. The winners of this election served in the 80th Texas Legislature. State representatives serve for two-year terms. Republicans maintained control of the House, losing five seats to the Democrats.
Following the 2002 elections, the Republicans gained control of the House, giving them a governmental trifecta for the first time since Reconstruction. [1] [2] Democrats gained a net of one seat back from the Republicans in the 2004 elections, holding onto many rural districts that Republicans had targeted. [3]
District 48: A special election was held on January 7, 2006, to fill the unexpired term of Rep. Todd Baxter, who resigned on November 1, 2005. [4] Democrat Donna Howard received 49.46% in the special election, narrowly missing the 50% mark needed to win outright, so she faced Republican Ben Bentzin in the runoff on February 14, 2006. [5] Howard won the runoff with 57.62%, flipping the district. [6]
Party | Candidate | Votes | % | |
---|---|---|---|---|
Democratic | Donna Howard | 6,705 | 49.46% | |
Republican | Ben Bentzin | 5,125 | 37.81% | |
Democratic | Kathy Rider | 1,416 | 10.45% | |
Libertarian | Ben Easton | 310 | 2.29% | |
Total votes | 13,556 | 100.00% |
Party | Candidate | Votes | % | |
---|---|---|---|---|
Democratic | Donna Howard | 12,620 | 57.62% | |
Republican | Ben Bentzin | 9,284 | 42.38% | |
Total votes | 21,904 | 100.00% | ||
Democratic gain from Republican | ||||
Democrats gained a net of five seats from the Republicans. [7]
Party | Candi-dates | Votes | % | Seats | +/– | |||||||||
---|---|---|---|---|---|---|---|---|---|---|---|---|---|---|
Republican Party | 107 | 2,094,200 | 53.51% | 81 | 5 | |||||||||
Democratic Party | 113 | 1,585,408 | 40.51% | 69 | 5 | |||||||||
Libertarian Party | 88 | 231,098 | 5.91% | 0 | – | |||||||||
Write-in | 1 | 2,690 | 0.06% | 0 | – | |||||||||
Total | 3,913,396 | 100.00% | 150 | – |
District | Democratic | Republican | Others | Total | Result | ||||
---|---|---|---|---|---|---|---|---|---|
Votes | % | Votes | % | Votes | % | Votes | % | ||
District 1 | 21,841 | 86.79% | - | - | 3,324 | 13.21% | 25,165 | 100.00% | Democratic hold |
District 2 | 11,926 | 37.14% | 18,783 | 58.49% | 1,404 | 4.37% | 32,113 | 100.00% | Republican hold |
District 3 | 19,632 | 58.32% | 14,032 | 41.68% | - | - | 33,664 | 100.00% | Democratic hold |
District 4 | 13,128 | 36.22% | 21,547 | 59.45% | 1,567 | 4.32% | 36,242 | 100.00% | Republican hold |
District 5 | - | - | 26,286 | 81.94% | 5,795 | 18.06% | 32,081 | 100.00% | Republican hold |
District 6 | - | - | 25,496 | 100.00% | - | - | 25,496 | 100.00% | Republican hold |
District 7 | 8,701 | 28.61% | 20,810 | 68.44% | 897 | 2.95% | 30,408 | 100.00% | Republican hold |
District 8 | 12,938 | 42.14% | 17,767 | 57.86% | - | - | 30,705 | 100.00% | Republican hold |
District 9 | - | - | 20,838 | 100.00% | - | - | 20,838 | 100.00% | Republican hold |
District 10 | 12,516 | 33.19% | 25,196 | 66.81% | - | - | 37,712 | 100.00% | Republican hold |
District 11 | 17,603 | 51.00% | 15,918 | 46.11% | 998 | 2.89% | 34,519 | 100.00% | Democratic hold |
District 12 | 20,747 | 55.58% | 15,707 | 42.08% | 873 | 2.34% | 37,327 | 100.00% | Democratic hold |
District 13 | - | - | 24,170 | 82.84% | 5,006 | 17.16% | 29,176 | 100.00% | Republican hold |
District 14 | - | - | 22,056 | 100.00% | - | - | 22,056 | 100.00% | Republican hold |
District 15 | 9,597 | 22.79% | 30,880 | 73.33% | 1,633 | 3.88% | 42,110 | 100.00% | Republican hold |
District 16 | 7,963 | 24.96% | 23,945 | 75.04% | - | - | 31,908 | 100.00% | Republican hold |
District 17 | 19,640 | 48.92% | 19,225 | 47.89% | 1,283 | 3.20% | 40,148 | 100.00% | Democratic hold |
District 18 | - | - | 19,153 | 76.00% | 6,048 | 24.00% | 25,201 | 100.00% | Republican hold |
District 19 | 11,957 | 42.64% | 16,082 | 57.36% | - | - | 28,039 | 100.00% | Republican hold |
District 20 | 18,006 | 36.62% | 31,158 | 63.38% | - | - | 49,164 | 100.00% | Republican hold |
District 21 | 20,811 | 100.00% | - | - | - | - | 20,811 | 100.00% | Democratic hold |
District 22 | 14,516 | 90.75% | - | - | 1,479 | 9.25% | 15,995 | 100.00% | Democratic hold |
District 23 | 22,618 | 83.80% | - | - | 4,374 | 16.20% | 26,992 | 100.00% | Democratic hold |
District 24 | - | - | 24,992 | 77.69% | 7,176 | 22.31% | 32,168 | 100.00% | Republican hold |
District 25 | - | - | 21,867 | 100.00% | - | - | 21,867 | 100.00% | Republican hold |
District 26 | - | - | 26,374 | 100.00% | - | - | 26,374 | 100.00% | Republican hold |
District 27 | 20,898 | 60.80% | 13,475 | 39.20% | - | - | 34,373 | 100.00% | Democratic hold |
District 28 | 14,760 | 37.04% | 25,094 | 62.96% | - | - | 39,854 | 100.00% | Republican hold |
District 29 | 13,908 | 39.59% | 21,221 | 60.41% | - | - | 35,129 | 100.00% | Republican hold |
District 30 | - | - | 24,725 | 100.00% | - | - | 24,725 | 100.00% | Republican hold |
District 31 | 12,711 | 100.00% | - | - | - | - | 12,711 | 100.00% | Democratic hold |
District 32 | 17,607 | 48.26% | 16,840 | 46.16% | 2,038 | 5.59% | 36,485 | 100.00% | Democratic gain |
District 33 | 14,154 | 52.08% | 13,023 | 47.92% | - | - | 27,177 | 100.00% | Democratic hold |
District 34 | 17,561 | 78.41% | - | - | 4,835 | 21.59% | 22,396 | 100.00% | Democratic hold |
District 35 | 16,042 | 52.69% | 12,780 | 41.98% | 1,623 | 5.33% | 30,445 | 100.00% | Democratic hold |
District 36 | 8,776 | 100.00% | - | - | - | - | 8,776 | 100.00% | Democratic hold |
District 37 | 10,113 | 100.00% | - | - | - | - | 10,113 | 100.00% | Democratic hold |
District 38 | 11,335 | 63.94% | 5,054 | 28.51% | 1,339 | 7.55% | 17,728 | 100.00% | Democratic hold |
District 39 | 8,122 | 100.00% | - | - | - | - | 8,122 | 100.00% | Democratic hold |
District 40 | 7,073 | 100.00% | - | - | - | - | 7,073 | 100.00% | Democratic hold |
District 41 | 9,794 | 100.00% | - | - | - | - | 9,794 | 100.00% | Democratic hold |
District 42 | 12,787 | 100.00% | - | - | - | - | 12,787 | 100.00% | Democratic hold |
District 43 | 12,164 | 100.00% | - | - | - | - | 12,164 | 100.00% | Democratic hold |
District 44 | - | - | 28,931 | 100.00% | - | - | 28,931 | 100.00% | Republican hold |
District 45 | 25,080 | 60.12% | 14,949 | 35.84% | 1,686 | 4.04% | 41,715 | 100.00% | Democratic hold |
District 46 | 17,343 | 85.34% | - | - | 2,980 | 14.66% | 20,323 | 100.00% | Democratic hold |
District 47 | 26,975 | 50.24% | 24,447 | 45.54% | 2,265 | 4.22% | 53,687 | 100.00% | Democratic gain |
District 48 | 31,255 | 77.76% | - | - | 8,939 | 22.24% | 40,194 | 100.00% | Democratic hold |
District 49 | 32,381 | 84.12% | - | - | 6,111 | 15.88% | 38,492 | 100.00% | Democratic hold |
District 50 | 25,098 | 61.71% | 13,681 | 33.64% | 1,892 | 4.65% | 40,671 | 100.00% | Democratic hold |
District 51 | 13,521 | 85.72% | - | - | 2,252 | 14.28% | 15,773 | 100.00% | Democratic hold |
District 52 | 16,520 | 44.21% | 18,853 | 50.45% | 1,998 | 5.35% | 37,371 | 100.00% | Republican hold |
District 53 | - | - | 30,966 | 85.32% | 5,328 | 14.68% | 36,294 | 100.00% | Republican hold |
District 54 | 9,802 | 36.32% | 16,314 | 60.45% | 873 | 3.23% | 26,989 | 100.00% | Republican hold |
District 55 | 8,837 | 33.65% | 17,428 | 66.35% | - | - | 26,265 | 100.00% | Republican hold |
District 56 | - | - | 27,961 | 78.73% | 7,556 | 21.27% | 35,517 | 100.00% | Republican hold |
District 57 | 19,274 | 86.16% | - | - | 3,097 | 13.84% | 22,371 | 100.00% | Democratic hold |
District 58 | 11,419 | 32.92% | 21,766 | 62.76% | 1,497 | 4.32% | 34,682 | 100.00% | Republican hold |
District 59 | 12,198 | 44.46% | 15,235 | 55.54% | - | - | 27,433 | 100.00% | Republican hold |
District 60 | 10,645 | 29.53% | 24,223 | 67.19% | 1,185 | 3.29% | 36,053 | 100.00% | Republican hold |
District 61 | - | - | 27,470 | 80.40% | 6,696 | 19.60% | 34,166 | 100.00% | Republican hold |
District 62 | 12,725 | 38.85% | 20,031 | 61.15% | - | - | 32,756 | 100.00% | Republican hold |
District 63 | - | - | 31,958 | 100.00% | - | - | 31,958 | 100.00% | Republican hold |
District 64 | 12,888 | 40.08% | 19,266 | 59.92% | - | - | 32,154 | 100.00% | Republican hold |
District 65 | - | - | 20,687 | 78.39% | 5,704 | 21.61% | 26,391 | 100.00% | Republican hold |
District 66 | - | - | 24,399 | 80.34% | 5,972 | 19.66% | 30,371 | 100.00% | Republican hold |
District 67 | - | - | 18,211 | 100.00% | - | - | 18,211 | 100.00% | Republican hold |
District 68 | - | - | 26,949 | 100.00% | - | - | 26,949 | 100.00% | Republican hold |
District 69 | 17,571 | 58.19% | 11,966 | 39.63% | 659 | 2.18% | 30,196 | 100.00% | Democratic hold |
District 70 | 12,265 | 28.16% | 30,062 | 69.03% | 1,222 | 2.81% | 43,549 | 100.00% | Republican hold |
District 71 | 12,547 | 40.14% | 18,026 | 57.66% | 687 | 2.20% | 31,260 | 100.00% | Republican hold |
District 72 | - | - | 19,334 | 81.46% | 4,401 | 18.54% | 23,735 | 100.00% | Republican hold |
District 73 | - | - | 35,785 | 75.15% | 2,690 | 5.65% | 47,617 | 100.00% | Republican hold |
District 74 | 19,324 | 100.00% | - | - | - | - | 19,324 | 100.00% | Democratic hold |
District 75 | 10,413 | 65.71% | 5,435 | 34.29% | - | - | 15,848 | 100.00% | Democratic hold |
District 76 | 12,886 | 100.00% | - | - | - | - | 12,886 | 100.00% | Democratic hold |
District 77 | 11,375 | 100.00% | - | - | - | - | 11,375 | 100.00% | Democratic hold |
District 78 | - | - | 18,837 | 100.00% | - | - | 18,837 | 100.00% | Republican hold |
District 79 | 12,623 | 100.00% | - | - | - | - | 12,623 | 100.00% | Democratic hold |
District 80 | 15,466 | 100.00% | - | - | - | - | 15,466 | 100.00% | Democratic hold |
District 81 | - | - | 16,187 | 84.78% | 2,907 | 15.22% | 19,094 | 100.00% | Republican hold |
District 82 | - | - | 24,187 | 100.00% | - | - | 24,187 | 100.00% | Republican hold |
District 83 | 10,161 | 26.71% | 27,887 | 73.29% | - | - | 38,048 | 100.00% | Republican hold |
District 84 | 8,068 | 33.87% | 15,751 | 66.13% | - | - | 23,819 | 100.00% | Republican hold |
District 85 | 14,323 | 49.01% | 14,106 | 48.27% | 793 | 2.71% | 29,222 | 100.00% | Democratic hold |
District 86 | - | - | 28,951 | 86.46% | 4,532 | 13.54% | 33,483 | 100.00% | Republican hold |
District 87 | - | - | 16,993 | 100.00% | - | - | 16,993 | 100.00% | Republican hold |
District 88 | - | - | 24,044 | 85.00% | 4,244 | 15.00% | 28,288 | 100.00% | Republican hold |
District 89 | 11,522 | 26.11% | 30,841 | 69.88% | 1,773 | 4.02% | 44,136 | 100.00% | Republican hold |
District 90 | 9,650 | 86.43% | - | - | 1,515 | 13.57% | 11,165 | 100.00% | Democratic hold |
District 91 | 11,361 | 37.77% | 17,770 | 59.07% | 950 | 3.16% | 30,081 | 100.00% | Republican hold |
District 92 | - | - | 22,491 | 100.00% | - | - | 22,491 | 100.00% | Republican hold |
District 93 | 10,936 | 49.61% | 10,349 | 46.95% | 759 | 3.44% | 22,044 | 100.00% | Democratic gain |
District 94 | 11,147 | 32.49% | 21,800 | 63.54% | 1,363 | 3.97% | 34,310 | 100.00% | Republican hold |
District 95 | 18,259 | 90.53% | - | - | 1,909 | 9.47% | 20,168 | 100.00% | Democratic hold |
District 96 | 16,483 | 44.30% | 19,520 | 52.46% | 1,206 | 3.24% | 37,209 | 100.00% | Republican hold |
District 97 | 16,908 | 40.82% | 23,164 | 55.93% | 1,344 | 3.25% | 41,416 | 100.00% | Republican hold |
District 98 | - | - | 36,509 | 83.59% | 7,165 | 16.41% | 43,674 | 100.00% | Republican hold |
District 99 | 12,285 | 33.83% | 22,906 | 63.07% | 1,125 | 3.10% | 36,316 | 100.00% | Republican hold |
District 100 | 12,523 | 88.81% | - | - | 1,578 | 11.19% | 14,101 | 100.00% | Democratic hold |
District 101 | - | - | 13,248 | 76.23% | 4,132 | 23.77% | 17,380 | 100.00% | Republican hold |
District 102 | 11,613 | 45.81% | 13,166 | 51.94% | 571 | 2.25% | 25,350 | 100.00% | Republican hold |
District 103 | 7,702 | 83.40% | - | - | 1,533 | 16.60% | 9,235 | 100.00% | Democratic hold |
District 104 | 7,906 | 85.47% | - | - | 1,344 | 14.53% | 9,250 | 100.00% | Democratic hold |
District 105 | 8,865 | 41.10% | 11,881 | 55.09% | 822 | 3.81% | 21,568 | 100.00% | Republican hold |
District 106 | 10,224 | 48.06% | 10,459 | 49.16% | 591 | 2.78% | 21,274 | 100.00% | Republican hold |
District 107 | 16,254 | 50.11% | 15,145 | 46.69% | 1,038 | 3.20% | 32,437 | 100.00% | Democratic gain |
District 108 | 12,447 | 40.42% | 17,244 | 55.99% | 1,106 | 3.59% | 30,797 | 100.00% | Republican hold |
District 109 | 26,511 | 90.41% | - | - | 2,811 | 9.59% | 29,322 | 100.00% | Democratic hold |
District 110 | 14,896 | 100.00% | - | - | - | - | 14,896 | 100.00% | Democratic hold |
District 111 | 21,462 | 73.74% | 7,641 | 26.26% | - | - | 29,103 | 100.00% | Democratic hold |
District 112 | - | - | 21,068 | 77.95% | 5,961 | 22.05% | 27,029 | 100.00% | Republican hold |
District 113 | 9,793 | 37.91% | 15,242 | 59.00% | 799 | 3.09% | 25,834 | 100.00% | Republican hold |
District 114 | 12,791 | 42.30% | 16,808 | 55.59% | 639 | 2.11% | 30,238 | 100.00% | Republican hold |
District 115 | - | - | 22,050 | 100.00% | - | - | 22,050 | 100.00% | Republican hold |
District 116 | 14,276 | 85.30% | - | - | 2,461 | 14.70% | 16,737 | 100.00% | Democratic hold |
District 117 | 13,024 | 59.62% | 8,820 | 40.38% | - | - | 21,844 | 100.00% | Democratic hold |
District 118 | 10,982 | 48.24% | 10,082 | 44.29% | 1,701 | 7.47% | 22,765 | 100.00% | Democratic hold |
District 119 | 14,818 | 100.00% | - | - | - | - | 14,818 | 100.00% | Democratic hold |
District 120 | 14,563 | 85.83% | - | - | 2,404 | 14.17% | 16,967 | 100.00% | Democratic hold |
District 121 | - | - | 26,836 | 77.44% | 7,816 | 22.56% | 34,652 | 100.00% | Republican hold |
District 122 | 16,651 | 29.42% | 37,625 | 66.47% | 2,325 | 4.11% | 56,601 | 100.00% | Republican hold |
District 123 | 14,659 | 84.60% | - | - | 2,668 | 15.40% | 17,327 | 100.00% | Democratic hold |
District 124 | 13,687 | 64.46% | 7,546 | 35.54% | - | - | 21,233 | 100.00% | Democratic hold |
District 125 | 14,466 | 57.72% | 9,516 | 37.97% | 1,082 | 4.32% | 25,064 | 100.00% | Democratic hold |
District 126 | 9,114 | 32.59% | 18,112 | 64.77% | 736 | 2.63% | 27,962 | 100.00% | Republican hold |
District 127 | 14,305 | 39.86% | 20,773 | 57.88% | 814 | 2.27% | 35,892 | 100.00% | Republican hold |
District 128 | - | - | 15,327 | 100.00% | - | - | 15,327 | 100.00% | Republican hold |
District 129 | 14,397 | 42.33% | 19,616 | 57.67% | - | - | 34,013 | 100.00% | Republican hold |
District 130 | - | - | 29,860 | 83.41% | 5,941 | 16.59% | 35,801 | 100.00% | Republican hold |
District 131 | 14,379 | 94.59% | - | - | 823 | 5.41% | 15,202 | 100.00% | Democratic hold |
District 132 | - | - | 21,221 | 82.42% | 4,527 | 17.58% | 25,748 | 100.00% | Republican hold |
District 133 | 8,750 | 41.74% | 11,693 | 55.77% | 522 | 2.49% | 20,965 | 100.00% | Republican hold |
District 134 | 25,219 | 54.54% | 20,005 | 43.26% | 1,018 | 2.20% | 46,242 | 100.00% | Democratic gain |
District 135 | - | - | 16,083 | 100.00% | - | - | 16,083 | 100.00% | Republican hold |
District 136 | 9,976 | 29.10% | 23,392 | 68.24% | 910 | 2.65% | 34,278 | 100.00% | Republican hold |
District 137 | 5,201 | 57.83% | 3,792 | 42.17% | - | - | 8,993 | 100.00% | Democratic hold |
District 138 | 8,286 | 38.72% | 12,504 | 58.43% | 610 | 2.85% | 21,400 | 100.00% | Republican hold |
District 139 | 13,969 | 100.00% | - | - | - | - | 13,969 | 100.00% | Democratic hold |
District 140 | 6,168 | 100.00% | - | - | - | - | 6,168 | 100.00% | Democratic hold |
District 141 | 12,926 | 100.00% | - | - | - | - | 12,926 | 100.00% | Democratic hold |
District 142 | 15,025 | 93.56% | - | - | 1,035 | 6.44% | 16,060 | 100.00% | Democratic hold |
District 143 | 6,026 | 70.64% | 2,218 | 26.00% | 286 | 3.35% | 8,530 | 100.00% | Democratic hold |
District 144 | 8,017 | 40.57% | 11,125 | 56.29% | 620 | 3.14% | 19,762 | 100.00% | Republican hold |
District 145 | 7,773 | 100.00% | - | - | - | - | 7,773 | 100.00% | Democratic hold |
District 146 | 19,812 | 90.55% | - | - | 2,068 | 9.45% | 21,880 | 100.00% | Democratic hold |
District 147 | 17,273 | 100.00% | - | - | - | - | 17,273 | 100.00% | Democratic hold |
District 148 | 12,790 | 84.27% | - | - | 2,387 | 15.73% | 15,177 | 100.00% | Democratic hold |
District 149 | 12,621 | 54.28% | 10,632 | 45.72% | - | - | 23,253 | 100.00% | Democratic hold |
9,554 | 29.73% | 22,585 | 70.27% | - | - | 32,139 | 100.00% | Republican hold | |
Total | 1,585,408 | 40.51% | 2,094,200 | 53.51% | 233,788 | 5.98% | 3,913,396 | 100.00% |
Ralph Moody Hall was an American politician who served as the United States representative for Texas's 4th congressional district from 1981 to 2015. He was first elected in 1980, and was the chairman of the House Committee on Science, Space and Technology from 2011 to 2013. He was also a member of the Committee on Energy and Commerce. In 2004, he switched to the Republican Party after having been a member of the Democratic Party for more than 50 years.
Texas's 14th congressional district for the United States House of Representatives stretches from Freeport to Orange, Texas. It formerly covered the area south and southwest of the Greater Houston region, including Galveston, in the state of Texas.
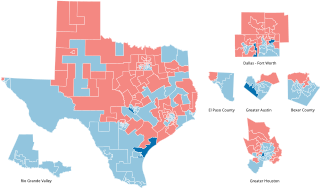
The 2006 United States House of Representatives elections in Texas were held on November 7, 2006, to determine the 32 U.S. representatives from the state of Texas, one from each of the state's 32 congressional districts. These elections coincided with the 2006 midterm elections, which included a gubernatorial election and an election to the U.S. Senate.
Nathaniel Willis "Tan" Parker IV is a businessman and Republican politician who has served in the Texas Senate, representing the 12th district since 2023. He served in the Texas House of Representatives from 2007 to 2023. He was elected in 2006 to represent District 63. Parker sought the position of Texas House Speaker with the retirement of Joe Straus but then withdrew his candidacy in 2018 to support the consensus choice, Representative Dennis Bonnen of Angleton in Brazoria County. As of 2022, Parker was elected to represent Senate District 12, and will continue his public service as a State Senator.
The 2008 elections for the Texas delegation of the United States House of Representatives was held on November 4, 2008. 31 of 32 congressional seats that make up the state's delegation were contested. In Texas's 14th congressional district no one challenged incumbent Ron Paul. Since Representatives are elected for two-year terms, those elected will serve in the 111th United States Congress from January 4, 2009, until January 3, 2011.
The 2010 U.S. congressional elections in Texas were held on November 2, 2010, to determine who will represent the state of Texas in the United States House of Representatives. Representatives are elected for two-year terms; those elected served in the 112th Congress from January 2011 until January 2013.
The 2004 United States House of Representatives elections in Texas occurred on November 2, 2004, to elect the members of the state of Texas's delegation to the United States House of Representatives. Texas had thirty-two seats in the House, apportioned according to the 2000 United States census.
The 1992 United States House of Representatives elections in Texas occurred on November 3, 1992, to elect the members of the state of Texas's delegation to the United States House of Representatives. Texas had thirty seats in the House, apportioned according to the 1990 United States census.
The 1984 United States House of Representatives elections in Texas occurred on November 6, 1984, to elect the members of the state of Texas's delegation to the United States House of Representatives. Texas had twenty-seven seats in the House, apportioned according to the 1980 United States census.
The 1996 United States House of Representatives elections in Texas occurred on November 5, 1996, to elect the members of the state of Texas's delegation to the United States House of Representatives. Texas had thirty seats in the House, apportioned according to the 1990 United States census.
The 1986 United States House of Representatives elections in Texas occurred on November 4, 1986, to elect the members of the state of Texas's delegation to the United States House of Representatives. Texas had twenty-seven seats in the House, apportioned according to the 1980 United States census.
Paul Lindsey Sadler is an American attorney from Henderson, Texas, now residing in Bandera, Texas who served from 1991 to 2003 in the Texas House of Representatives. He was the Democratic nominee for the United States Senate in 2012. In the November 6 general election, he lost against the Republican Ted Cruz, a former state Solicitor General.
The 1976 United States House of Representatives elections in Texas occurred on November 2, 1976, to elect the members of the state of Texas's delegation to the United States House of Representatives. Texas had twenty-four seats in the House apportioned according to the 1970 United States census.
William Ralph Keffer is an attorney in Dallas, Texas, who was from 2003 to 2007 a Republican member of the Texas House of Representatives from District 107. His older brother, Jim Keffer, is a still-serving Republican House member from District 60 in Eastland, near Abilene, Texas.
The 2021 Texas's 6th congressional district special election was held on May 1, 2021. The seat became vacant after incumbent Republican Ron Wright died on February 7 of COVID-19.
The 2010 Texas Senate elections took place as part of the biennial United States elections. Texas voters elected state senators in 16 State Senate districts. The winners of this election served in the 82nd Texas Legislature. State senators typically serve four-year terms in the Texas State Senate, but all Senators come up for election in the cycles following each decennial redistricting. As such, all of the seats up for this election were for two-year terms, with senators up for re-election in the following 2012 Texas State Senate elections.
The 2014 Texas House of Representatives elections took place as part of the biennial United States elections. Texas voters elected state representatives in all 150 State House of Representatives districts. The winners of this election served in the 84th Texas Legislature. State representatives serve for two-year terms.
The 1996 Texas House of Representatives elections took place as part of the biennial United States elections. Texas voters elected state representatives in all 150 State House of Representatives districts. The winners of this election served in the 75th Texas Legislature. State representatives serve for two-year terms. Republicans gained five seats from the Democrats, reducing the Democratic majority to 82 out of 150 seats.
The 2008 Texas Senate elections took place as part of the biennial United States elections. Texas voters elected state senators in 16 State Senate districts. The winners of this election served in the 81st Texas Legislature. The elected senators served four-year terms in the Texas Senate.
The 2008 Texas House of Representatives elections took place as part of the biennial United States elections. Texas voters elected state representatives in all 150 State House of Representatives districts. The winners of this election served in the 81st Texas Legislature. State representatives serve for two-year terms. Republicans maintained control of the House, losing three seats to the Democrats.