| |||||||||||||||||||||||||||||||||||||||||||||
All 533 English seats to the House of Commons 267 seats needed for English majority | |||||||||||||||||||||||||||||||||||||||||||||
---|---|---|---|---|---|---|---|---|---|---|---|---|---|---|---|---|---|---|---|---|---|---|---|---|---|---|---|---|---|---|---|---|---|---|---|---|---|---|---|---|---|---|---|---|---|
Turnout | 65.9% (0.4%) | ||||||||||||||||||||||||||||||||||||||||||||
| |||||||||||||||||||||||||||||||||||||||||||||
A map of English parliamentary constituencies *Seat figure does not include the Speaker of the House of Commons, John Bercow, who was included in the Conservative seat total by some media outlets. |
The 2015 United Kingdom general election in England was held on Thursday, 7 May 2015 for 533 English seats to the House of Commons. The Conservatives won a majority of seats in England for the second time since 1992.
Both major parties made gains at the expense of the Liberal Democrats, whose support collapsed to its lowest level since 1970. Their vote share declined by 16 percentage points, and the party lost 37 of its 43 seats. The party won 6 seats and 8% of the vote overall. This was the worst result for the Lib Dems or the Liberals in 45 years, while the 16-point drop in vote share was the biggest decline in Lib Dem or Liberal support since 1931.
Although Labour increased their share of the vote by 4% and gained 15 seats, the Conservatives made 21 gains for a total of 318, including winning 6 seats directly from Labour. Together with seats from Scotland and Wales, this allowed the Conservatives to form a majority government with 330 seats, leading to the first majority Conservative government since 1992.
The general election was fought with the Conservatives and the Liberal Democrats having been in coalition since 2010, with Labour being the main opposition, though with the Conservatives holding the majority of English seats. It was also fought following the victory of the UK Independence Party at the European Parliament Elections and in two by-elections the year before, along with George Galloway of the Respect Party having won the 2012 Bradford West by-election from Labour.
Party [1] | Seats | Votes | |||||||
---|---|---|---|---|---|---|---|---|---|
Total | Gains | Losses | Net +/- | % seats | Total votes | % votes | Change | ||
Conservative | 318 | 32 | 11 | 21 | 59.7 | 10,483,261 | 40.9 | 1.4 | |
Labour | 206 | 21 | 6 | 15 | 38.6 | 8,087,684 | 31.6 | 3.6 | |
UKIP | 1 | 1 | 0 | 1 | 0.2 | 3,611,367 | 14.1 | 10.7 | |
Liberal Democrats | 6 | 0 | 37 | 37 | 1.1 | 2,098,404 | 8.2 | 16.0 | |
Green | 1 | 0 | 0 | 0.2 | 1,073,242 | 4.2 | 3.2 | ||
Speaker | 1 | 0 | 0 | 0.2 | 34,617 | 0.1 | |||
TUSC | 0 | 0 | 0 | — | 32,868 | 0.1 | 0.1 | ||
NHA | 0 | 0 | 0 | — | 20,210 | 0.1 | New | ||
Respect | 0 | 0 | 0 | — | 9,989 | 0.0 | 0.1 | ||
Yorkshire First | 0 | 0 | 0 | — | 6,811 | 0.0 | New | ||
English Democrat | 0 | 0 | 0 | — | 6,431 | 0.0 | 0.2 | ||
CISTA | 0 | 0 | 0 | — | 4,569 | 0.0 | New | ||
Monster Raving Loony | 0 | 0 | 0 | — | 3,432 | 0.0 | |||
CPA | 0 | 0 | 0 | — | 3,260 | 0.0 | |||
BNP | 0 | 0 | 0 | — | 1,667 | 0.0 | 2.1 | ||
Class War | 0 | 0 | 0 | — | 526 | 0.0 | New | ||
Other parties | 0 | 0 | 0 | — | 127,133 | 0.5 | 0.2 | ||
25,571,204 | 65.9 | 0.4 |
The Conservatives emerged as the largest party, increasing both their seats and votes. They took seats both from the Liberal Democrats and from the Labour Party, as well as holding on to many of their key marginal seats.
Labour increased its numbers both in number of votes and seats after making gains against the Liberal Democrats, along with limited gains against the Conservatives, but failed to become the largest party. Shadow Chancellor Ed Balls lost his seat in Morley and Outwood to the Conservative candidate Andrea Jenkyns, [2] whilst Ed Miliband resigned as Labour leader. [3]
The Liberal Democrats lost the vast majority of their seats, going from 43 seats down to just 6. [4] Leader Nick Clegg, who saw his nearly 30-point majority in Sheffield Hallam massively reduced to 4.2%, resigned on the morning of the election results. [5]
UKIP made large gains in the percentage of votes, but failed to retain Rochester and Strood or take any other seats, leading to the resignation of party leader Nigel Farage. His resignation was rejected, however, and he subsequently stayed on. [6]
The Green Party increased their share of the vote and held Brighton Pavilion, but failed to gain any new seats. [7]
Regional vote shares and changes are sourced from the House of Commons Library. [8]
Party | Seats | Votes | ||||||
---|---|---|---|---|---|---|---|---|
Total | Gained | Lost | Net | Total | % | Change (%) | ||
Conservative | 32 | 1 | - | +1 | 969,379 | 43.5 | +2.3 | |
Labour | 14 | - | 1 | -1 | 705,767 | 31.6 | +1.9 | |
UKIP | - | - | - | - | 351,777 | 15.8 | +12.5 | |
Liberal Democrats | - | - | - | - | 124,039 | 5.6 | -15.3 | |
Others | - | - | - | - | 79,440 | 3.6 | — | |
Total | 46 | Turnout | 2,230,402 | 66.5 |
Party | Seats | Votes | ||||||
---|---|---|---|---|---|---|---|---|
Total | Gained | Lost | Net | Total | % | Change (%) | ||
Conservative | 52 | 1 | 1 | - | 1,445,946 | 49.0 | +1.9 | |
Labour | 4 | 2 | - | +2 | 649,321 | 22.0 | +2.4 | |
UKIP | 1 | 1 | - | +1 | 478,517 | 16.2 | +12.0 | |
Liberal Democrats | 1 | - | 3 | -3 | 243,191 | 8.2 | -15.8 | |
Others | - | - | - | - | 131,648 | 4.6 | — | |
Total | 58 | Turnout | 2,948,623 | 67.5 |
Party | Seats | Votes | ||||||
---|---|---|---|---|---|---|---|---|
Total | Gained | Lost | Net | Total | % | Change (%) | ||
Labour | 45 | 7 | - | +7 | 1,545,048 | 43.7 | +7.3 | |
Conservative | 27 | 3 | 4 | -1 | 1,233,386 | 34.9 | +0.3 | |
UKIP | - | - | - | - | 286,981 | 8.1 | +6.4 | |
Liberal Democrats | 1 | - | 6 | -6 | 272,544 | 7.7 | -14.4 | |
Green | - | - | - | - | 171,670 | 4.9 | +3.3 | |
Others | - | - | - | - | 26,622 | 0.8 | — | |
Total | 73 | Turnout | 3,536,251 | 65.4 |
Party | Seats | Votes | ||||||
---|---|---|---|---|---|---|---|---|
Total | Gained | Lost | Net | Total | % | Change (%) | ||
Labour | 26 | 1 | - | +1 | 557,100 | 46.9 | +3.3 | |
Conservative | 3 | 1 | - | +1 | 300,883 | 25.3 | +1.6 | |
UKIP | - | - | - | - | 198,823 | 16.7 | +14.0 | |
Liberal Democrats | - | - | 2 | -2 | 77,095 | 6.5 | -17.1 | |
Others | - | - | - | - | 54,252 | 4.6 | — | |
Total | 29 | Turnout | 1,188,153 | 61.8 |
Party | Seats | Votes | ||||||
---|---|---|---|---|---|---|---|---|
Total | Gained | Lost | Net | Total | % | Change (%) | ||
Labour | 51 | 5 | 1 | +4 | 1,502,047 | 44.6 | +5.2 | |
Conservative | 22 | 3 | 3 | - | 1,050,124 | 31.2 | -0.5 | |
UKIP | - | - | - | - | 459,071 | 13.6 | +10.5 | |
Liberal Democrats | 2 | - | 4 | -4 | 219,998 | 6.5 | -15.1 | |
Others | - | - | - | - | 132,815 | 4.1 | — | |
Total | 75 | Turnout | 3,364,055 | 64.3 |
Party | Seats | Votes | ||||||
---|---|---|---|---|---|---|---|---|
Total | Gained | Lost | Net | Total | % | Change (%) | ||
Conservative | 78 | 5 | 1 | +4 | 2,234,360 | 50.8 | +1.5 | |
Labour | 4 | 1 | 1 | - | 804,774 | 18.3 | -0.5 | |
UKIP | - | - | - | - | 646,959 | 14.7 | +10.6 | |
Liberal Democrats | - | - | 4 | -4 | 413,586 | 9.4 | -16.8 | |
Green | 1 | - | - | - | 227,882 | 5.2 | +3.7 | |
Speaker | 1 | - | - | - | 34,617 | 0.8 | - | |
Others | - | - | - | - | 32,315 | 0.7 | — | |
Total | 84 | Turnout | 4,394,493 | 68.6 |
Party | Seats | Votes | ||||||
---|---|---|---|---|---|---|---|---|
Total | Gained | Lost | Net | Total | % | Change (%) | ||
Conservative | 51 | 15 | - | +15 | 1,319,994 | 46.5 | +3.7 | |
Labour | 4 | 1 | 1 | - | 501,684 | 17.7 | +2.3 | |
Liberal Democrats | - | - | 15 | -15 | 428,927 | 15.1 | -19.6 | |
UKIP | - | - | - | - | 384,546 | 13.6 | +9.1 | |
Green | - | - | - | - | 168,130 | 5.9 | +4.8 | |
Others | - | - | - | - | 33,013 | 1.2 | — | |
Total | 55 | Turnout | 2,836,294 | 69.5 |
Party | Seats | Votes | ||||||
---|---|---|---|---|---|---|---|---|
Total | Gained | Lost | Net | Total | % | Change (%) | ||
Conservative | 34 | 2 | 1 | +1 | 1,097,750 | 41.8 | +2.2 | |
Labour | 25 | 2 | 1 | +1 | 865,075 | 32.9 | +2.3 | |
UKIP | - | - | - | - | 412,770 | 15.7 | +11.7 | |
Liberal Democrats | - | - | 2 | -2 | 145,009 | 5.5 | -14.9 | |
Others | - | - | - | - | 107,975 | 4.1 | — | |
Total | 59 | Turnout | 2,628,579 | 64.1 |
Party | Seats | Votes | ||||||
---|---|---|---|---|---|---|---|---|
Total | Gained | Lost | Net | Total | % | Change (%) | ||
Labour | 33 | 2 | 1 | +1 | 956,837 | 39.1 | +4.8 | |
Conservative | 19 | 1 | 1 | - | 796,822 | 32.6 | -0.2 | |
UKIP | - | - | - | - | 391,923 | 16.0 | +13.2 | |
Liberal Democrats | 2 | - | 1 | -1 | 174,069 | 7.1 | -15.8 | |
Others | - | - | - | - | 124,526 | 5.1 | — | |
Total | 54 | Turnout | 2,444,177 | 63.3 |
The recorded swing in each case is calculated as two-way swing from the party that won in 2010 to the party targeting the seat. Negative swing implies that the targeting party lost votes to the incumbent party.
Rank | Constituency | Region | Winning party 2010 | Swing required (%) | Result | Swing to CON (±%) | ||
---|---|---|---|---|---|---|---|---|
1 | Hampstead and Kilburn | London | Labour | 0.10 | Labour hold | -1.0 | ||
2 | Bolton West | North West England | Labour | 0.10 | Conservative gain | +0.9 | ||
3 | Solihull | West Midlands | Liberal Democrats | 0.16 | Conservative gain | +11.9 | ||
4 | Southampton Itchen | South East England | Labour | 0.22 | Conservative gain | +2.8 | ||
5 | Mid Dorset and North Poole | South West England | Liberal Democrats | 0.29 | Conservative gain | +11.6 | ||
6 | Wirral South | North West England | Labour | 0.66 | Labour hold | -4.8 | ||
7 | Derby North | East Midlands | Labour | 0.68 | Conservative gain | +0.8 | ||
8 | Wells | South West England | Liberal Democrats | 0.72 | Conservative gain | +7.4 | ||
9 | Dudley North | West Midlands | Labour | 0.84 | Labour hold | -4.7 | ||
10 | Great Grimsby | Yorkshire and the Humber | Labour | 1.08 | Labour hold | -5.7 | ||
Rank | Constituency | Region | Winning party 2010 | Swing required (%) | Result | Swing to LAB (±%) | ||
---|---|---|---|---|---|---|---|---|
1 | North Warwickshire | West Midlands | Conservative | 0.06 | Conservative hold | −3.1 | ||
2 | Thurrock | South East England | Conservative | 0.10 | Conservative hold | −0.5 | ||
3 | Hendon | London | Conservative | 0.11 | Conservative hold | −3.7 | ||
4 | Sherwood | East Midlands | Conservative | 0.22 | Conservative hold | −4.4 | ||
5 | Norwich South | East of England | Liberal Democrats | 0.33 | Labour gain | +13.2 | ||
6 | Stockton South | North East England | Conservative | 0.33 | Conservative hold | −4.6 | ||
7 | Broxtowe | East Midlands | Conservative | 0.37 | Conservative hold | −3.7 | ||
8 | Lancaster and Fleetwood | North West England | Conservative | 0.39 | Labour gain | +1.9 | ||
9 | Bradford East | Yorkshire and the Humber | Liberal Democrats | 0.45 | Labour gain | +9.0 | ||
10 | Amber Valley | East Midlands | Conservative | 0.58 | Conservative hold | −4.1 |
Rank | Constituency | Region | Winning party 2010 | Swing required (%) | Result | Swing to LD (±%) | ||
---|---|---|---|---|---|---|---|---|
1 | Camborne and Redruth | South West England | Conservative | 0.08 | Conservative hold | −13.8 | ||
2 | Oxford West and Abingdon | South East England | Conservative | 0.16 | Conservative hold | −8.3 | ||
3 | Sheffield Central | Yorkshire and the Humber | Labour | 0.20 | Labour hold | −22.5 | ||
4 | Ashfield | East Midlands | Labour | 0.20 | Labour hold | −12.9 | ||
5 | Truro and Falmouth | South West England | Conservative | 0.45 | Conservative hold | −13.2 |
Rank [10] | Constituency | Region | Winning party 2010 | Swing required (%) | Result | Swing to UKIP (±%) | ||
---|---|---|---|---|---|---|---|---|
1 | Thanet South | South East England | Conservative | 21.2 | Conservative hold | +18.4 | ||
2 | Thurrock | East of England | Conservative | 14.7 | Conservative hold | +13.7 | ||
3 | Castle Point | East of England | Conservative | (No candidate in 2010) | Conservative hold | (Vote share: 31.2%) | ||
4 | Boston and Skegness | East of England | Conservative | 20.0 | Conservative hold | +15.0 | ||
5 | Great Grimsby | Yorkshire and the Humber | Labour | 13.3 | Labour hold | +5.9 |
Swing for the Greens is measured as one-party swing, i.e. the change in the party's share of the vote.
Rank [11] | Constituency | Region | Winning party 2010 | Result | Swing to GRN (±%) | ||
---|---|---|---|---|---|---|---|
1 | Norwich South | East of England | Liberal Democrats | Labour gain | −1.0 | ||
2 | Bristol West | South East England | Liberal Democrats | Labour gain | +23.0 | ||
3 | St Ives | South West England | Liberal Democrats | Conservative gain | +3.5 | ||
4 | Sheffield Central | Yorkshire and the Humber | Labour | Labour hold | +12.1 | ||
5 | Liverpool Riverside | North West England | Labour | Labour hold | +8.6 |
Date(s) conducted | Polling organisation/client | Sample size | Con | Lab | LD | UKIP | Green | Others | Lead |
---|---|---|---|---|---|---|---|---|---|
7 May 2015 | General Election 2015 Results | 25,571,204 | 41.0% | 31.6% | 8.2% | 14.1% | 4.2% | 0.9% | 9.4% |
30 Apr–1 May 2015 | Survation/Daily Mirror | 978 | 36% | 34% | 10% | 17% | 4% | <0.5% | 2% |
30 Apr 2015 | Question Time featuring David Cameron, Nick Clegg and Ed Miliband broadcast on BBC One; Ask Nicola Sturgeon, Ask Leanne Wood and Ask Nigel Farage programmes also shown | ||||||||
27–28 Apr 2015 | ComRes/ITV News, Daily Mail Archived 18 May 2015 at the Wayback Machine | 872 | 36% | 36% | 8% | 12% | 6% | 2% | Tied |
25–27 Apr 2015 | BMG/May2015.com | 877 | 39% | 31% | 11% | 15% | 4% | <0.5% | 8% |
24–26 Apr 2015 | Lord Ashcroft [12] | 870 | 37% | 32% | 9% | 12% | 8% | 1% | 5% |
24–26 Apr 2015 | ICM/The Guardian [13] | 863 | 39% | 32% | 7% | 15% | 6% | <0.5% | 7% |
24–25 Apr 2015 | Survation/Mail on Sunday | 879 | 36% | 31% | 9% | 20% | 4% | <0.5% | 5% |
21–24 Apr 2015 | Opinium/The Observer | 1,668 | 36% | 33% | 9% | 15% | 7% | 1% | 3% |
22–23 Apr 2015 | Survation/Daily Mirror | 1,072 | 36% | 29% | 10% | 20% | 5% | <0.5% | 7% |
21–22 Apr 2015 | ComRes/ITV News, Daily Mail Archived 30 April 2015 at the Wayback Machine | 890 | 39% | 34% | 8% | 11% | 5% | 3% | 5% |
17–19 Apr 2015 | Lord Ashcroft [12] | 863 | 36% | 33% | 9% | 14% | 5% | 2% | 3% |
17–19 Apr 2015 | ICM/The Guardian [13] | 863 | 38% | 35% | 9% | 12% | 5% | 1% | 3% |
16–17 Apr 2015 | Opinium/The Observer | 1,655 | 38% | 32% | 9% | 14% | 6% | 1% | 6% |
16–17 Apr 2015 | Survation/Daily Mirror | 986 | 35% | 34% | 8% | 18% | 3% | 1% | 1% |
16 Apr 2015 | Five-way Opposition Leaders' Debate held on BBC One | ||||||||
12–15 Apr 2015 | Ipsos MORI/Evening Standard | 600 | 35% | 37% | 8% | 11% | 8% | 1% | 2% |
10–12 Apr 2015 | Lord Ashcroft [12] | 870 | 34% | 36% | 9% | 14% | 6% | 1% | 2% |
10–12 Apr 2015 | ICM/The Guardian [13] | 900 | 41% | 35% | 7% | 8% | 8% | 1% | 6% |
8–9 Apr 2015 | Opinium/The Observer | 1,626 | 39% | 35% | 8% | 12% | 6% | 1% | 4% |
8–9 Apr 2015 | Survation/Daily Mirror | 838 | 33% | 36% | 9% | 16% | 5% | 1% | 3% |
7–8 Apr 2015 | ComRes/ITV News, Daily Mail Archived 16 April 2015 at the Wayback Machine | 718 | 36% | 35% | 11% | 13% | 4% | 1% | 1% |
2–3 Apr 2015 | Survation/Daily Mirror | 856 | 34% | 33% | 9% | 21% | 3% | <0.5% | 1% |
2–3 Apr 2015 | Opinium/The Observer | 1,710 | 35% | 34% | 7% | 15% | 7% | 1% | 1% |
2 Apr 2015 | Seven-way Leaders' Debate on ITV | ||||||||
30 Mar 2015 | Dissolution of Parliament and the official start of the election campaign | ||||||||
28–29 Mar 2015 | ComRes/ITV News, Daily Mail Archived 19 September 2015 at the Wayback Machine | 864 | 38% | 32% | 9% | 13% | 6% | 2% | 6% |
27–29 Mar 2015 | Lord Ashcroft [12] | 865 | 40% | 34% | 7% | 11% | 7% | 1% | 6% |
26 Mar 2015 | First TV election interview by Jeremy Paxman with David Cameron and Ed Miliband on Sky and Channel 4 | ||||||||
24–25 Mar 2015 | Opinium/The Observer | 1,690 | 35% | 34% | 9% | 13% | 7% | <0.5% | 1% |
24–25 Mar 2015 | Survation/Daily Mirror | 851 | 34% | 34% | 8% | 20% | 4% | <0.5% | Tied |
20–22 Mar 2015 | ComRes/ITV News, Daily Mail Archived 2 April 2015 at the Wayback Machine | 864 | 38% | 35% | 8% | 11% | 7% | 1% | 3% |
20–22 Mar 2015 | Lord Ashcroft [12] | 860 | 36% | 33% | 8% | 14% | 6% | 2% | 3% |
20–21 Mar 2015 | Survation/Mail on Sunday | 861 | 31% | 35% | 10% | 19% | 3% | 1% | 4% |
18–19 Mar 2015 | Opinium/The Observer | 1,702 | 37% | 33% | 7% | 14% | 7% | 1% | 4% |
13–15 Mar 2015 | Lord Ashcroft [12] | 863 | 34% | 29% | 8% | 18% | 9% | 3% | 5% |
13–15 Mar 2015 | ICM/The Guardian [13] | 910 | 38% | 37% | 6% | 11% | 5% | 3% | 1% |
10–12 Mar 2015 | Opinium/The Observer | 1,654 | 35% | 35% | 7% | 15% | 7% | <0.5% | Tied |
8–11 Mar 2015 | Ipsos MORI/Evening Standard | 863 | 34% | 37% | 8% | 14% | 6% | 1% | 3% |
6–8 Mar 2015 | Lord Ashcroft [12] | 859 | 36% | 31% | 5% | 18% | 9% | 1% | 5% |
3–6 Mar 2015 | Opinium/The Observer | 1,626 | 36% | 33% | 7% | 15% | 7% | 3% | 3% |
27 Feb–1 Mar 2015 | Lord Ashcroft [12] | 860 | 36% | 32% | 8% | 14% | 7% | 2% | 4% |
24–26 Feb 2015 | Opinium/The Observer | 1,679 | 35% | 36% | 7% | 14% | 6% | 1% | 1% |
23 Feb 2015 | Survation/Daily Mirror | 921 | 30% | 34% | 10% | 21% | 3% | 2% | 4% |
20–23 Feb 2015 | ComRes/Daily Mail Archived 24 February 2015 at the Wayback Machine | 865 | 36% | 32% | 7% | 14% | 9% | 2% | 4% |
20–22 Feb 2015 | Lord Ashcroft [12] | 867 | 32% | 38% | 6% | 13% | 8% | 2% | 6% |
17–20 Feb 2015 | Opinium/The Observer | 1,704 | 36% | 33% | 7% | 16% | 7% | 1% | 3% |
13–15 Feb 2015 | Lord Ashcroft [12] | 863 | 31% | 31% | 9% | 18% | 9% | 3% | Tied |
13–15 Feb 2015 | ICM/The Guardian [13] | 860 | 38% | 34% | 7% | 10% | 8% | 2% | 4% |
10–12 Feb 2015 | Opinium/The Observer | 1,713 | 35% | 35% | 8% | 15% | 5% | 1% | Tied |
8–10 Feb 2015 | Ipsos MORI/Evening Standard | 844 | 38% | 37% | 7% | 10% | 8% | 0% | 1% |
6–8 Feb 2015 | Lord Ashcroft [12] | 860 | 36% | 31% | 9% | 16% | 7% | 1% | 5% |
3–6 Feb 2015 | Opinium/The Observer | 1,947 | 33% | 35% | 7% | 15% | 8% | 2% | 2% |
30 Jan–1 Feb 2015 | Lord Ashcroft [12] | 857 | 34% | 30% | 8% | 17% | 10% | 1% | 4% |
25 Jan 2015 | Survation/Daily Mirror | 890 | 34% | 30% | 7% | 25% | 4% | <0.5% | 4% |
23–25 Jan 2015 | ComRes/The Independent [ permanent dead link ] | 852 | 33% | 29% | 9% | 20% | 8% | 1% | 4% |
22–25 Jan 2015 | Lord Ashcroft [12] | 859 | 33% | 34% | 5% | 17% | 9% | 2% | 1% |
16–19 Jan 2015 | ICM/The Guardian [13] | 863 | 32% | 35% | 8% | 14% | 10% | 1% | 3% |
16–18 Jan 2015 | Lord Ashcroft [12] | 871 | 31% | 27% | 9% | 17% | 12% | 4% | 4% |
11–13 Jan 2015 | Ipsos MORI/Evening Standard | 854 | 35% | 35% | 8% | 12% | 8% | 2% | Tied |
9–11 Jan 2015 | Lord Ashcroft [12] | 858 | 37% | 29% | 7% | 17% | 8% | 2% | 8% |
12–16 Dec 2014 | ICM/The Guardian [13] | 861 | 31% | 33% | 11% | 17% | 5% | 3% | 2% |
13–15 Dec 2014 | Ipsos MORI/Evening Standard | 840 | 36% | 31% | 9% | 14% | 10% | 0% | 5% |
12–14 Dec 2014 | ComRes/The Independent [ permanent dead link ] | 897 | 29% | 34% | 12% | 17% | 6% | 2% | 5% |
5–7 Dec 2014 | Lord Ashcroft [12] | 860 | 31% | 31% | 7% | 23% | 6% | 2% | Tied |
6 May 2010 | General Election Results | 25,085,097 | 39.6% | 28.1% | 24.2% | 3.5% | 1.0% | 3.6% | 11.5% |
Electoral commission data [14] shows that in 2015 Q2, total donations for each major political party, over £7,500, are as follows:
Party | Donations | |
---|---|---|
Conservative | £9,159,884 | |
Labour | £8,783,492 | |
Liberal Democrats | £2,434,159 | |
UKIP | £2,203,921 | |
Green | £55,152 |
The UK Independence Party is a Eurosceptic, right-wing populist political party in the United Kingdom. The party reached its greatest level of success in the mid-2010s, when it gained two members of parliament and was the largest party representing the UK in the European Parliament. The party is currently led by Neil Hamilton.
The 2004 European Parliament election was the United Kingdom's part of the wider 2004 European Parliament election which was held between 10 and 13 June 2004 in the 25 member states of the European Union. The United Kingdom's part of this election was held on Thursday 10 June 2004. The election also coincided with the 2004 local elections and the London Assembly and mayoral elections. In total, 78 Members of the European Parliament were elected from the United Kingdom using proportional representation.
Boston and Skegness is a county constituency, represented in the House of Commons of the UK Parliament. It is located in Lincolnshire, England. Like all British constituencies, Boston and Skegness elects one Member of Parliament (MP) by the first-past-the-post system of election. The seat has been represented by the Conservative MP Matt Warman since the 2015 general election, and is usually considered a safe seat for the party.
The 2005 United Kingdom general election was held on Thursday 5 May 2005, to elect 646 members to the House of Commons. The governing Labour Party, led by Tony Blair, won its third consecutive victory, with Blair becoming the second Labour leader after Harold Wilson to form three majority governments. However, its majority fell to 66 seats; the majority it won four years earlier had been of 167 seats. This would be the last election not won by the Conservaative Party as of 2024.This was the first time the Labour Party had won a third consecutive election, and as of 2024 remains the party's most recent general election victory.
The 2010 United Kingdom general election was held on Thursday 6 May 2010, with 45,597,461 registered voters entitled to vote to elect members to the House of Commons. The election took place in 650 constituencies across the United Kingdom under the first-past-the-post system.
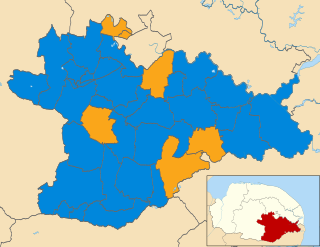
The elections to South Norfolk District Council were held on Thursday 5 May 2011 along with various other local elections around England, elections to the Scottish Parliament, National Assembly of Wales and Northern Ireland Assembly, and a referendum on whether to adopt the Alternative Vote electoral system for elections to the House of Commons. All 46 council seats were up for election. The previous council was controlled by the Conservatives, with the Liberal Democrats being the only opposition.
The 2013 United Kingdom local elections took place on Thursday 2 May 2013. Elections were held in 35 English councils: all 27 non-metropolitan county councils and eight unitary authorities, and in one Welsh unitary authority. Direct mayoral elections took place in Doncaster and North Tyneside. These elections last took place on the 4 June 2009 at the same time as the 2009 European Parliament Elections, except for County Durham, Northumberland and the Anglesey where elections last took place in 2008.
The 2014 European Parliament election was the United Kingdom's component of the 2014 European Parliament election, held on Thursday 22 May 2014, coinciding with the 2014 local elections in England and Northern Ireland. In total, 73 Members of the European Parliament were elected from the United Kingdom using proportional representation. England, Scotland and Wales use a closed-list party list system of PR, while Northern Ireland used the single transferable vote (STV).
On 29 November 2012, a by-election was held for the UK House of Commons constituency of Rotherham. The by-election was caused by the resignation of its Member of Parliament Denis MacShane after the House of Commons Standards and Privileges Committee found that he had submitted 19 false invoices "plainly intended to deceive" the parliamentary expenses authority, an issue dating back to 2009 and a wider parliamentary expenses scandal in the UK. MacShane accepted the office of Chiltern Hundreds on 5 November 2012, formally vacating his seat. The election took place on 29 November 2012, at the same time as by-elections in Croydon North and Middlesbrough which were caused by the deaths of the sitting MPs.
A by-election for the House of Commons constituency of Eastleigh in Hampshire was held on 28 February 2013.
On 9 October 2014, a by-election was held for the UK parliamentary constituency of Clacton in Essex, England. The by-election was triggered by the Conservative MP for Clacton, Douglas Carswell, defecting to the UK Independence Party (UKIP) and subsequently resigning his seat to seek re-election as its candidate.
The 2015 United Kingdom general election was held on Thursday 7 May 2015 to elect 650 Members of Parliament to the House of Commons. It was the only general election held under the rules of the Fixed-term Parliaments Act 2011 and was the last general election to be held before the United Kingdom would vote to end its membership of the European Union (EU). Local elections took place in most areas of England on the same day.
A by-election was held on 20 November 2014 for the UK parliamentary constituency of Rochester and Strood in Kent, England. The sitting Member of Parliament (MP) Mark Reckless called it on joining the UK Independence Party (UKIP), from the Conservatives. He resigned his seat.
The 2015 United Kingdom general election debates were a series of four live television programmes featuring the leaders of seven main British parties that took place during the run-up to the general election. They each featured different formats and participants.
A general election was held in the United Kingdom on 7 May 2015 and all 59 seats in Scotland were contested under the first-past-the-post, single-member district electoral system. Unlike the 2010 general election, where no seats changed party, the Scottish National Party (SNP) won all but three seats in Scotland in an unprecedented landslide victory, gaining a total of 56 seats and taking the largest share of the Scottish vote in sixty years, at approximately 50 per cent. The Labour Party suffered its worst ever election defeat in Scotland, losing 40 of the 41 seats it was defending, including the seats of Scottish Labour leader Jim Murphy and the then Shadow Foreign Secretary Douglas Alexander. The Liberal Democrats lost ten of the eleven seats they were defending, with the then Chief Secretary to the Treasury Danny Alexander and former leader Charles Kennedy losing their seats. The election also saw the worst performance by the Scottish Conservative Party, which received its lowest share of the vote since its creation in 1965, although it retained the one seat that it previously held. In all, 50 of the 59 seats changed party, 49 of them being won by first-time MPs.
The 2017 United Kingdom general election was held on Thursday 8 June 2017, two years after the previous general election in 2015; it was the first since 1992 to be held on a day that did not coincide with any local elections. The governing Conservative Party remained the largest single party in the House of Commons but lost its small overall majority, resulting in the formation of a Conservative minority government with a confidence and supply agreement with the Democratic Unionist Party (DUP) of Northern Ireland.
The 2019 United Kingdom general election was held on Thursday 12 December 2019 with 47,074,800 registered voters entitled to vote to elect members of the House of Commons. The Conservative Party won a landslide victory with a majority of 80 seats, a net gain of 48, on 43.6% of the popular vote, the highest percentage for any party since the 1979 general election.
This is the results breakdown of the 2015 United Kingdom general election.
The 2019 European Parliament election was the United Kingdom's component of the 2019 European Parliament election. It was held on Thursday 23 May 2019 and the results announced on Sunday 26 and Monday 27 May 2019, after all the other EU countries had voted. This was the United Kingdom's final participation in a European Parliament election before leaving the European Union on 31 January 2020, and was also the last election to be held under the provisions of the European Parliamentary Elections Act 2002 before its repeal under the European Union (Withdrawal) Act 2018.
The 2017 United Kingdom general election in England was held on Thursday 8 June 2017 across 533 constituencies within England.
{{cite journal}}
: Cite journal requires |journal=
(help)