This article may be confusing or unclear to readers.(December 2021) |
Colors of noise |
---|
In audio engineering, electronics, physics, and many other fields, the color of noise or noise spectrum refers to the power spectrum of a noise signal (a signal produced by a stochastic process). Different colors of noise have significantly different properties. For example, as audio signals they will sound different to human ears, and as images they will have a visibly different texture. Therefore, each application typically requires noise of a specific color. This sense of 'color' for noise signals is similar to the concept of timbre in music (which is also called "tone color"; however, the latter is almost always used for sound, and may consider detailed features of the spectrum).
The practice of naming kinds of noise after colors started with white noise, a signal whose spectrum has equal power within any equal interval of frequencies. That name was given by analogy with white light, which was (incorrectly) assumed to have such a flat power spectrum over the visible range.[ citation needed ] Other color names, such as pink, red, and blue were then given to noise with other spectral profiles, often (but not always) in reference to the color of light with similar spectra. Some of those names have standard definitions in certain disciplines, while others are informal and poorly defined. Many of these definitions assume a signal with components at all frequencies, with a power spectral density per unit of bandwidth proportional to 1/f β and hence they are examples of power-law noise. For instance, the spectral density of white noise is flat (β = 0), while flicker or pink noise has β = 1, and Brownian noise has β = 2. Blue noise has β = -1.
Various noise models are employed in analysis, many of which fall under the above categories. AR noise or "autoregressive noise" is such a model, and generates simple examples of the above noise types, and more. The Federal Standard 1037C Telecommunications Glossary [1] [2] defines white, pink, blue, and black noise.
The color names for these different types of sounds are derived from a loose analogy between the spectrum of frequencies of sound wave present in the sound (as shown in the blue diagrams) and the equivalent spectrum of light wave frequencies. That is, if the sound wave pattern of "blue noise" were translated into light waves, the resulting light would be blue, and so on.[ citation needed ]
White noise is a signal (or process), named by analogy to white light, with a flat frequency spectrum when plotted as a linear function of frequency (e.g., in Hz). In other words, the signal has equal power in any band of a given bandwidth (power spectral density) when the bandwidth is measured in Hz. For example, with a white noise audio signal, the range of frequencies between 40 Hz and 60 Hz contains the same amount of sound power as the range between 400 Hz and 420 Hz, since both intervals are 20 Hz wide. Note that spectra are often plotted with a logarithmic frequency axis rather than a linear one, in which case equal physical widths on the printed or displayed plot do not all have the same bandwidth, with the same physical width covering more Hz at higher frequencies than at lower frequencies. In this case a white noise spectrum that is equally sampled in the logarithm of frequency (i.e., equally sampled on the X axis) will slope upwards at higher frequencies rather than being flat. However it is not unusual in practice for spectra to be calculated using linearly-spaced frequency samples but plotted on a logarithmic frequency axis, potentially leading to misunderstandings and confusion if the distinction between equally spaced linear frequency samples and equally spaced logarithmic frequency samples is not kept in mind. [3]
The frequency spectrum of pink noise is linear in logarithmic scale; it has equal power in bands that are proportionally wide. [4] This means that pink noise would have equal power in the frequency range from 40 to 60 Hz as in the band from 4000 to 6000 Hz. Since humans hear in such a proportional space, where a doubling of frequency (an octave) is perceived the same regardless of actual frequency (40–60 Hz is heard as the same interval and distance as 4000–6000 Hz), every octave contains the same amount of energy and thus pink noise is often used as a reference signal in audio engineering. The spectral power density, compared with white noise, decreases by 3.01 dB per octave (density proportional to 1/f ). For this reason, pink noise is often called "1/f noise".
Since there are an infinite number of logarithmic bands at both the low frequency (DC) and high frequency ends of the spectrum, any finite energy spectrum must have less energy than pink noise at both ends. Pink noise is the only power-law spectral density that has this property: all steeper power-law spectra are finite if integrated to the high-frequency end, and all flatter power-law spectra are finite if integrated to the DC, low-frequency limit.[ citation needed ]
Brownian noise, also called Brown noise, is noise with a power density which decreases 6.02 dB per octave with increasing frequency (frequency density proportional to 1/f2) over a frequency range excluding zero (DC). It is also called "red noise", with pink being between red and white.
Brownian noise can be generated with temporal integration of white noise. "Brown" noise is not named for a power spectrum that suggests the color brown; rather, the name derives from Brownian motion, also known as "random walk" or "drunkard's walk".
Blue noise is also called azure noise. Blue noise's power density increases 3.01 dB per octave with increasing frequency (density proportional to f ) over a finite frequency range. [5] In computer graphics, the term "blue noise" is sometimes used more loosely as any noise with minimal low frequency components and no concentrated spikes in energy. This can be good noise for dithering. [6] Retinal cells are arranged in a blue-noise-like pattern which yields good visual resolution. [7]
Cherenkov radiation is a naturally occurring example of almost perfect blue noise, with the power density growing linearly with frequency over spectrum regions where the permeability of index of refraction of the medium are approximately constant. The exact density spectrum is given by the Frank–Tamm formula. In this case, the finiteness of the frequency range comes from the finiteness of the range over which a material can have a refractive index greater than unity. Cherenkov radiation also appears as a bright blue color, for these reasons.
Violet noise is also called purple noise. Violet noise's power density increases 6.02 dB per octave with increasing frequency [8] [9] "The spectral analysis shows that GPS acceleration errors seem to be violet noise processes. They are dominated by high-frequency noise." (density proportional to f 2) over a finite frequency range. It is also known as differentiated white noise, due to its being the result of the differentiation of a white noise signal.
Due to the diminished sensitivity of the human ear to high-frequency hiss and the ease with which white noise can be electronically differentiated (high-pass filtered at first order), many early adaptations of dither to digital audio used violet noise as the dither signal.[ citation needed ]
Acoustic thermal noise of water has a violet spectrum, causing it to dominate hydrophone measurements at high frequencies. [10] "Predictions of the thermal noise spectrum, derived from classical statistical mechanics, suggest increasing noise with frequency with a positive slope of 6.02 dB octave−1." "Note that thermal noise increases at the rate of 20 dB decade−1" [11]
Grey noise is random white noise subjected to a psychoacoustic equal loudness curve (such as an inverted A-weighting curve) over a given range of frequencies, giving the listener the perception that it is equally loud at all frequencies.[ citation needed ] This is in contrast to standard white noise which has equal strength over a linear scale of frequencies but is not perceived as being equally loud due to biases in the human equal-loudness contour.
Velvet noise is a sparse sequence of random positive and negative impulses. Velvet noise is typically characterised by its density in taps/second. At high densities it sounds similar to white noise, however it is perceptually "smoother". [12] The sparse nature of velvet noise allows for efficient time-domain convolution, making velvet noise particularly useful for applications where computational resources are limited, like real-time reverberation algorithms. [13] [14] Velvet noise is also frequently used in decorrelation filters. [15]
There are also many colors used without precise definitions (or as synonyms for formally defined colors), sometimes with multiple definitions.
In telecommunication, the term noisy white has the following meanings: [24]
In telecommunication, the term noisy black has the following meanings: [25]
Colored noise can be computer-generated by first generating a white noise signal, Fourier-transforming it, then multiplying the amplitudes of the different frequency components with a frequency-dependent function. [26] Matlab programs are available to generate power-law colored noise in one or any number of dimensions.
Bandwidth is the difference between the upper and lower frequencies in a continuous band of frequencies. It is typically measured in unit of hertz.
Frequency, most often measured in hertz, is the number of occurrences of a repeating event per unit of time. It is also occasionally referred to as temporal frequency for clarity and to distinguish it from spatial frequency. Ordinary frequency is related to angular frequency by a factor of 2π. The period is the interval of time between events, so the period is the reciprocal of the frequency: T = 1/f.
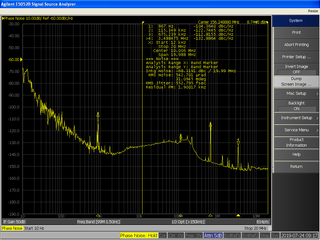
In signal processing, phase noise is the frequency-domain representation of random fluctuations in the phase of a waveform, corresponding to time-domain deviations from perfect periodicity (jitter). Generally speaking, radio-frequency engineers speak of the phase noise of an oscillator, whereas digital-system engineers work with the jitter of a clock.
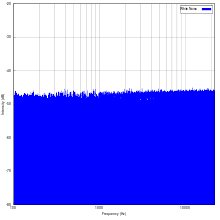
In signal processing, white noise is a random signal having equal intensity at different frequencies, giving it a constant power spectral density. The term is used with this or similar meanings in many scientific and technical disciplines, including physics, acoustical engineering, telecommunications, and statistical forecasting. White noise refers to a statistical model for signals and signal sources, rather than to any specific signal. White noise draws its name from white light, although light that appears white generally does not have a flat power spectral density over the visible band.
Pink noise, 1⁄f noise, fractional noise or fractal noise is a signal or process with a frequency spectrum such that the power spectral density is inversely proportional to the frequency of the signal. In pink noise, each octave interval carries an equal amount of noise energy.
In information theory, the Shannon–Hartley theorem tells the maximum rate at which information can be transmitted over a communications channel of a specified bandwidth in the presence of noise. It is an application of the noisy-channel coding theorem to the archetypal case of a continuous-time analog communications channel subject to Gaussian noise. The theorem establishes Shannon's channel capacity for such a communication link, a bound on the maximum amount of error-free information per time unit that can be transmitted with a specified bandwidth in the presence of the noise interference, assuming that the signal power is bounded, and that the Gaussian noise process is characterized by a known power or power spectral density. The law is named after Claude Shannon and Ralph Hartley.
In signal processing, the power spectrum of a continuous time signal describes the distribution of power into frequency components composing that signal. According to Fourier analysis, any physical signal can be decomposed into a number of discrete frequencies, or a spectrum of frequencies over a continuous range. The statistical average of any sort of signal as analyzed in terms of its frequency content, is called its spectrum.
In signal processing and electronics, the frequency response of a system is the quantitative measure of the magnitude and phase of the output as a function of input frequency. The frequency response is widely used in the design and analysis of systems, such as audio and control systems, where they simplify mathematical analysis by converting governing differential equations into algebraic equations. In an audio system, it may be used to minimize audible distortion by designing components so that the overall response is as flat (uniform) as possible across the system's bandwidth. In control systems, such as a vehicle's cruise control, it may be used to assess system stability, often through the use of Bode plots. Systems with a specific frequency response can be designed using analog and digital filters.
A spectrum analyzer measures the magnitude of an input signal versus frequency within the full frequency range of the instrument. The primary use is to measure the power of the spectrum of known and unknown signals. The input signal that most common spectrum analyzers measure is electrical; however, spectral compositions of other signals, such as acoustic pressure waves and optical light waves, can be considered through the use of an appropriate transducer. Spectrum analyzers for other types of signals also exist, such as optical spectrum analyzers which use direct optical techniques such as a monochromator to make measurements.
The Fourier transform of a function of time, s(t), is a complex-valued function of frequency, S(f), often referred to as a frequency spectrum. Any linear time-invariant operation on s(t) produces a new spectrum of the form H(f)•S(f), which changes the relative magnitudes and/or angles (phase) of the non-zero values of S(f). Any other type of operation creates new frequency components that may be referred to as spectral leakage in the broadest sense. Sampling, for instance, produces leakage, which we call aliases of the original spectral component. For Fourier transform purposes, sampling is modeled as a product between s(t) and a Dirac comb function. The spectrum of a product is the convolution between S(f) and another function, which inevitably creates the new frequency components. But the term 'leakage' usually refers to the effect of windowing, which is the product of s(t) with a different kind of function, the window function. Window functions happen to have finite duration, but that is not necessary to create leakage. Multiplication by a time-variant function is sufficient.
Welch's method, named after Peter D. Welch, is an approach for spectral density estimation. It is used in physics, engineering, and applied mathematics for estimating the power of a signal at different frequencies. The method is based on the concept of using periodogram spectrum estimates, which are the result of converting a signal from the time domain to the frequency domain. Welch's method is an improvement on the standard periodogram spectrum estimating method and on Bartlett's method, in that it reduces noise in the estimated power spectra in exchange for reducing the frequency resolution. Due to the noise caused by imperfect and finite data, the noise reduction from Welch's method is often desired.
An equal-loudness contour is a measure of sound pressure level, over the frequency spectrum, for which a listener perceives a constant loudness when presented with pure steady tones. The unit of measurement for loudness levels is the phon and is arrived at by reference to equal-loudness contours. By definition, two sine waves of differing frequencies are said to have equal-loudness level measured in phons if they are perceived as equally loud by the average young person without significant hearing impairment.
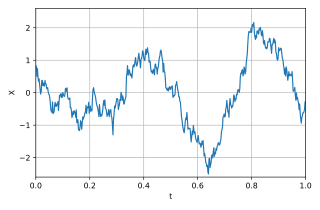
In science, Brownian noise, also known as Brown noise or red noise, is the type of signal noise produced by Brownian motion, hence its alternative name of random walk noise. The term "Brown noise" does not come from the color, but after Robert Brown, who documented the erratic motion for multiple types of inanimate particles in water. The term "red noise" comes from the "white noise"/"white light" analogy; red noise is strong in longer wavelengths, similar to the red end of the visible spectrum.
The process of weighting involves emphasizing the contribution of particular aspects of a phenomenon over others to an outcome or result; thereby highlighting those aspects in comparison to others in the analysis. That is, rather than each variable in the data set contributing equally to the final result, some of the data is adjusted to make a greater contribution than others. This is analogous to the practice of adding (extra) weight to one side of a pair of scales in order to favour either the buyer or seller.
Spectral bands are regions of a given spectrum, having a specific range of wavelengths or frequencies. Most often, it refers to electromagnetic bands, regions of the electromagnetic spectrum.
In electronics, noise is an unwanted disturbance in an electrical signal.
Flicker noise is a type of electronic noise with a 1/f power spectral density. It is therefore often referred to as 1/f noise or pink noise, though these terms have wider definitions. It occurs in almost all electronic devices and can show up with a variety of other effects, such as impurities in a conductive channel, generation and recombination noise in a transistor due to base current, and so on.
In communications, noise spectral density (NSD), noise power density, noise power spectral density, or simply noise density (N0) is the power spectral density of noise or the noise power per unit of bandwidth. It has dimension of power over frequency, whose SI unit is watt per hertz (equivalent to watt-second or joule). It is commonly used in link budgets as the denominator of the important figure-of-merit ratios, such as carrier-to-noise-density ratio as well as Eb/N0 and Es/N0.
Noise refers to many types of random, troublesome, problematic, or unwanted signals.
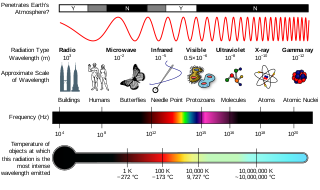
In the physical sciences, the term spectrum was introduced first into optics by Isaac Newton in the 17th century, referring to the range of colors observed when white light was dispersed through a prism. Soon the term referred to a plot of light intensity or power as a function of frequency or wavelength, also known as a spectral density plot.
{{cite book}}
: |journal=
ignored (help)This article incorporates public domain material from Federal Standard 1037C. General Services Administration. Archived from the original on 22 January 2022.