Tropical Cyclone Steve was a tropical cyclone that affected northern Australia from 27 February 2000 until 11 March 2000. Cyclone Steve was noted for its longevity and traversal of northern and western Australia. It impacted on regions of northern Queensland, the Northern Territory and Western Australia before clearing to the south of the continent. Steve is the first known Australian cyclone to make four distinct landfalls in the country.
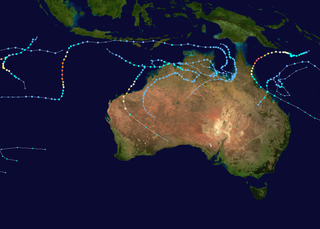
The 1999–2000 Australian region cyclone season was a slightly above average tropical cyclone season. It ran from 1 November 1999 to 30 April 2000. The regional tropical cyclone operational plan also defines a "tropical cyclone year" separately from a "tropical cyclone season", with the "tropical cyclone year" for this season lasting from 1 July 1999 to 30 June 2000.

The 2005–06 Australian region cyclone season was an above average tropical cyclone season. It began on 1 November 2005 and ended on 30 April 2006. The regional tropical cyclone operational plan also defines a tropical cyclone year separately from a tropical cyclone season, which runs from 1 July 2005 to 30 June 2006.

The 2002–03 Australian region cyclone season included Cyclone Inigo, which tied with Cyclone Gwenda in 1999 as the most intense tropical cyclone on record in the Australian basin. It began on 1 November 2002 and ended on 30 April 2003. The regional tropical cyclone operational plan also defines a tropical cyclone year separately from a tropical cyclone season, which runs from 1 July 2002 to 30 June 2003. These dates conventionally delimit the period of each year when most tropical cyclones form in the Australian region, which is defined as in the southern hemisphere between 90°E and 180°E. The season's ten tropical depressions existed within these dates, with the first, designated as Tropical Cyclone 07S, entering the basin on 27 December 2002. The last system, Cyclone Epi, dissipated on 6 June 2003. Tropical cyclones in this area were monitored by four Tropical Cyclone Warning Centres (TCWCs): the Australian Bureau of Meteorology (BOM) in Perth, Darwin, and Brisbane and one in Port Moresby, Papua New Guinea.

Severe Tropical Cyclone Glenda was among the strongest tropical cyclones to threaten Western Australia, though it weakened considerably before landfall and moved ashore in a lightly populated region. It began as a tropical low on 15 March in the Gulf of Carpentaria. The precursor disturbance drifted over Top End and later across the northeastern portion of Western Australia, and after emerging into the Indian Ocean it strengthened into a tropical storm. Aided by favourable environmental conditions, Glenda rapidly intensified to reach Category 5 status on the Australian cyclone scale, and with a peak intensity of 910 mbar it was among the strongest cyclones on record within the Australia region. On 30 March it moved ashore near Onslow as a Category 3 cyclone, and the next day it degenerated into a remnant tropical low over land.

The 2010–11 Australian region cyclone season was a near average tropical cyclone season, with eleven tropical cyclones forming compared to an average of 12. The season was also the costliest recorded in the Australian region basin, with a total of $3.62 billion in damages, mostly from the destructive Cyclone Yasi. The season began on 1 November 2010 and ended on 30 April 2011, although the first tropical cyclone formed on 28 October. The Australian region is defined as being to the south of the equator, between the 90th meridian east and 160th meridian east. Tropical cyclones in this area are monitored by five Tropical Cyclone Warning Centres (TCWC's): Jakarta, Port Moresby, Perth, Darwin, and Brisbane, each of which have the power to name a tropical cyclone. The TCWC's in Perth, Darwin, and Brisbane are run by the Bureau of Meteorology, who designate significant tropical lows with a number and the U suffix. The Joint Typhoon Warning Center also issues unofficial warnings for the region, designating significant tropical cyclones with the "S" suffix when they form west of 135°E, and the "P" suffix when they form east of 135°E.
The 1984–85 Australian region cyclone season was one of the most active seasons on record. It officially started on 1 November 1984, and officially ended on 30 April 1985.

Tropical Cyclone Emma was a weak but unusually large tropical cyclone that affected a substantial portion of Western Australia during the 2005–06 Australian region cyclone season. Forming out of an area of low pressure on 25 February, the precursor to Emma slowly tracked southward. Although classified tropical, the structure of the system represented that of a monsoonal storm. However, low wind shear and well-developed outflow gradually allowed convection to develop near the centre of circulation. As the system approached the Pilbara coastline of Western Australia on 27 February, it intensified into a Category 1 cyclone and attained peak 10-minute sustained winds of 75 km/h (47 mph). After moving inland near Mardie, Emma weakened to a tropical low but became exceedingly large; its cloud cover obscured most of Western Australia. The remnants of the weak storm persisted until 1 March, at which time they dissipated over the Great Australian Bight.

Severe Tropical Cyclone Clare was a moderately strong cyclone that struck Western Australia in January 2006. The storm formed as an area of low pressure in the Arafura Sea, and moved westward. After receiving the name Clare on 7 January, the system ultimately peaked at Category 3 intensity on the Australian tropical cyclone scale. It moved ashore on the coast of the Pilbara and proceeded inland, dissipating on 10 January. Clare produced winds of 142 km/h (88 mph) at Karratha and triggered widespread torrential rainfall that led to flooding. Following its usage, the name Clare was retired by the Bureau of Meteorology, and will never be used again for a tropical cyclone in the area.
The 2013–14 Australian region cyclone season was a slightly below-average tropical cyclone season, with 10 tropical cyclones occurring within the Australian region. It officially started on 1 November 2013, and ended on 30 April 2014. The regional tropical cyclone operational plan defines a "tropical cyclone year" separately from a "tropical cyclone season"; the "tropical cyclone year" began on 1 July 2013 and ended on 30 June 2014.

The 2016–17 Australian region cyclone season, despite a very high number of tropical lows, was a slightly below-average season in terms of activity, with nine tropical cyclones, three of which intensified further into severe tropical cyclones; though it was much more active than the previous season. The season was the first to have a severe tropical cyclone since the 2014–15 season. It was the period of the year when most tropical cyclones form in the Southern Indian Ocean and Pacific Oceans between 90°E and 160°E. The season officially ran from 1 November 2016 to 30 April 2017, however, a tropical cyclone could form at any time between 1 July 2016 and 30 June 2017 and would count towards the season total. The first named storm, Yvette, developed during 21 December, and the final named storm, Greg, left the region on 3 May as a remnant low. This season was also the second-costliest tropical cyclone season on record in the Australian region basin, behind only the 2010–11 season, with a total of AUD$3.7 billion in damages incurred by the various storms, mostly from Cyclone Debbie.

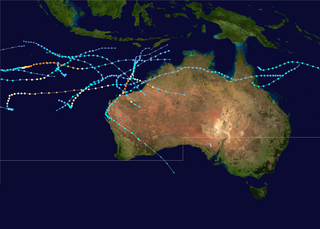
The 2017–18 Australian region cyclone season was an average period of tropical cyclone formation in the Southern Indian Ocean and South Pacific Ocean, between 90°E and 160°E, with 11 named storms, which 3 intensified into severe tropical cyclones. Another two tropical cyclones, Cempaka and Flamboyan occurred outside the Australian region but are included in the descriptions below. The season officially began 1 November 2017 and ended on 30 April 2018; however, tropical cyclones can form at any time of the year, as demonstrated by the first tropical low of the season in early August. Any tropical system that forms between 1 July 2017 and 30 June 2018 will count towards the season total. During the season, tropical cyclones will be officially monitored by one of the five tropical cyclone warning centres (TCWCs) that operate in this region. Three of the five centres are operated by the Australian Bureau of Meteorology (BOM) in Perth, Darwin and Brisbane, while the other two are operated by the National Weather Service of Papua New Guinea in Port Moresby and the Indonesian Agency for Meteorology, Climatology and Geophysics in Jakarta. The Joint Typhoon Warning Center (JTWC) of the United States and other national meteorological services, including Météo-France at Réunion, also monitored the basin during the season.

The 2018–19 Australian region cyclone season was an average season that saw the formation of 11 tropical cyclones, six of which intensified further to become severe tropical cyclones. The season officially began on 1 November 2018 and concluded on 30 April 2019; however, as evidenced by Tropical Low Liua in September 2018 and Tropical Cyclones Lili and Ann in May 2019, tropical cyclones can form at any time of the year. As such, any system existing between 1 July 2018 and 30 June 2019 would count towards the season total. During the season, tropical cyclones were officially monitored by the Bureau of Meteorology (BOM), the Indonesian Agency for Meteorology, Climatology and Geophysics (BMKG) in Jakarta, Indonesia, and the National Weather Service of Papua New Guinea in Port Moresby. The United States' Joint Typhoon Warning Center (JTWC) in Hawaii, and other national meteorological services such as MetService in New Zealand, Météo-France at La Réunion, and the Fiji Meteorological Service (FMS), also monitored parts of the basin during the season in an unofficial capacity.

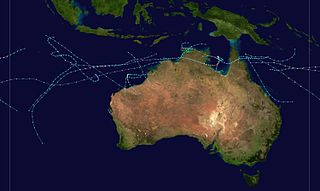
The 2019–20 Australian region cyclone season was a below average tropical cyclone season for the waters surrounding Australia between longitudes 90°E and 160°E. The season officially began on 1 November 2019 and ended on 30 April 2020; however, tropical cyclones can form at any time of year, as evidenced by Tropical Cyclone Mangga during May 2020. As such, any system existing between 1 July 2019 and 30 June 2020 would count towards the season total. The season featured the region's second-latest start on record, with the formation of the first tropical low only occurring on 4 January 2020. A total of eight tropical cyclones formed during the season, which represents the region's least active season since the 2016–17 season. Three systems intensified further into severe tropical cyclones, and three systems made landfall within the region at tropical cyclone intensity. A total of 28 fatalities were caused, either directly or indirectly, as a result of impacts from the season's systems. Cyclone Ferdinand was the strongest of the season reaching Category 4 in late February 2020. However, it was the second-strongest storm, Cyclone Damien, that was the most damaging. Damien was the strongest tropical cyclone to strike Western Australia's Pilbara Region since Cyclone Christine in 2013, making landfall directly over the town of Dampier.

The 2020–21 Australian region cyclone season was a below average but very deadly season when most tropical cyclones formed in the Southern Indian Ocean and Pacific Oceans between 90°E and 160°E. It produced 8 tropical cyclones with 3 strengthening into severe tropical cyclones. However, it featured the region's third-deadliest cyclone on record—Cyclone Seroja, which brought severe floods and landslides to southern Indonesia and East Timor. The season officially began on 1 November 2020 and started with the formation of Tropical Low 01U on 24 November within the basin, which would later become Tropical Storm Bongoyo in the South-West Indian Ocean, and ended with the dissipation of a tropical low on 24 April, 6 days before the season ended on 30 April. However, a tropical cyclone could form at any time between 1 July 2020 and 30 June 2021 and would count towards the season total. During the season, tropical cyclones were officially monitored by one of the three tropical cyclone warning centres (TCWCs) for the region which are operated by the Australian Bureau of Meteorology, National Weather Service of Papua New Guinea and the Indonesian Agency for Meteorology, Climatology and Geophysics. The United States Joint Typhoon Warning Center (JTWC) and other national meteorological services including Météo-France also monitored the basin during the season.

Severe Tropical Cyclone Lam was the strongest storm to strike Australia's Northern Territory since Cyclone Monica in 2006. It formed from the monsoon trough on February 12 in the Coral Sea. For much of its duration, the system moved westward due to a ridge to the south. The system crossed over the Cape York Peninsula and moved into the Gulf of Carpentaria, whereupon it gradually organized due to warm waters and favorable outflow. On February 16, the Bureau of Meteorology (BoM) classified it as a Category 1 on the Australian tropical cyclone intensity scale and gave it the name Lam. The storm intensified further while drifting toward the Wessel Islands, developing an eye and strengthening to the equivalence of a minimal hurricane on February 18. It strengthened to reach maximum sustained winds of 185 km/h (115 mph) early on February 19 before turning to the southwest, making it a Category 4 cyclone. That day, it made landfall on Northern Territory between Milingimbi and Elcho Island at peak intensity, and it rapidly weakened over land. About six hours after Lam moved ashore, Cyclone Marcia struck Queensland as a Category 5 cyclone, marking the first time on record that two storms of Category 4 intensity struck Australia on the same day.

Severe Tropical Cyclone Heidi was a small and strong tropical cyclone that struck Western Australia in January 2012. The seventh tropical low, third tropical cyclone, and second severe tropical cyclone of the 2011–12 Australian region cyclone season, Heidi developed from a tropical low that formed to the south of Indonesia on 9 January, before strengthening into a Category 1 tropical cyclone on the following day. Tracking southward towards the Pilbara coast in a favourable environment, Heidi rapidly intensified and attained Category 3 severe tropical cyclone status on 11 January. After making landfall at peak intensity later that day with estimated winds of 150 km/h (95 mph), Heidi rapidly weakened, dissipating over Western Australia by 13 January.

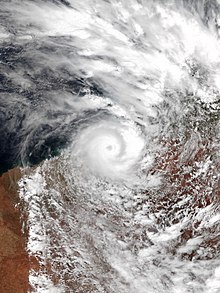
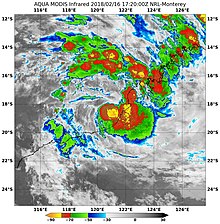
Severe Tropical Cyclone Owen was an erratic and long-lived tropical cyclone that affected numerous regions within its long trek, especially Queensland, during December 2018. It was the fourth tropical low, the first tropical cyclone, and first severe tropical cyclone of the 2018–19 Australian region cyclone season. Owen developed on 29 November 2018 from an area of low pressure that was situated over the Solomon Islands; the system struggled to strengthen in a conflicting environment and degenerated to a tropical low on 3 December. The low drifted westward, and on 9 December, it made its first landfall in Queensland, before moving over the Gulf of Carpentaria, where more favourable conditions allowed it to re-organise. The system regenerated into a tropical cyclone on 12 December and rapidly intensified into a Category 3 severe tropical cyclone that night. At midnight on 13 December, Owen made landfall in the Northern Territory, before turning eastward and reaching peak intensity, with sustained winds of 150 km/h (95 mph) and a minimum barometric pressure of 958 hPa (28.3 inHg). On 13 December, Owen made landfall on Queensland again, just north of the mouth of the Gilbert River near Kowanyama. The cyclone weakened rapidly after its third landfall, and the final advisory on Owen was issued on 15 December, after it had degenerated into a tropical low. However, the system persisted over the Coral Sea for another several days, before dissipating on 20 December.

The 2021–22 Australian region cyclone season, despite a high number of tropical lows forming, was slightly below-average in terms of activity, with ten tropical cyclones forming, two of which intensified further into severe tropical cyclones. The season began from 1 November 2021 and ended on 30 April 2022, but a tropical cyclone could form at any time between 1 July 2021 and 30 June 2022 and would count towards the season total. During the season, tropical cyclones will be officially monitored by one of the three tropical cyclone warning centres (TCWCs) for the region which are operated by the Australian Bureau of Meteorology, National Weather Service of Papua New Guinea and the Indonesian Agency for Meteorology, Climatology and Geophysics. The United States Joint Typhoon Warning Center (JTWC) and other national meteorological services including Météo-France and the Fiji Meteorological Service also monitored the basin during the season.
Severe Tropical Cyclone Damien was the strongest cyclone to make landfall on the Western Australian coast since Cyclone Christine in 2013 and the second-strongest cyclone in the 2019–20 Australian region cyclone season after Cyclone Ferdinand. The fifth tropical low, and the third named storm of the 2019–20 Australian region cyclone season, Damien originated from a monsoon trough over Kimberley.