Tropical cyclones are ranked on one of five tropical cyclone intensity scales, according to their maximum sustained winds and which tropical cyclone basins they are located in. Only a few scales of classifications are used officially by the meteorological agencies monitoring the tropical cyclones, but other scales also exist, such as accumulated cyclone energy, the Power Dissipation Index, the Integrated Kinetic Energy Index, and the Hurricane Severity Index.
Tropical cyclones that develop in the Northern Hemisphere are unofficially classified by the warning centres on one of three intensity scales. Tropical cyclones or subtropical cyclones that exist within the North Atlantic Ocean or the North-eastern Pacific Ocean are classified as either tropical depressions or tropical storms. Should a system intensify further and become a hurricane, then it will be classified on the Saffir–Simpson hurricane wind scale, and is based on the estimated maximum sustained winds over a 1-minute period. In the Western Pacific, the ESCAP/WMO Typhoon Committee uses four separate classifications for tropical cyclones that exist within the basin, which are based on the estimated maximum sustained winds over a 10-minute period.
The India Meteorological Department's scale uses 7 different classifications for systems within the North Indian Ocean, and are based on the systems estimated 3-minute maximum sustained winds. Tropical cyclones that develop in the Southern Hemisphere are only officially classified by the warning centres on one of two scales, which are both based on 10-minute sustained wind speeds: The Australian tropical cyclone intensity scale is used to classify systems within the Australian or South Pacific tropical cyclone basin. The scale used to classify systems in the South-West Indian Ocean is defined by Météo-France for use in various French territories, including New Caledonia and French Polynesia.
The definition of sustained winds recommended by the World Meteorological Organization (WMO) and used by most weather agencies is that of a 10-minute average at a height of 10m (33ft) above the sea surface. However, the Saffir–Simpson hurricane scale is based on wind speed measurements averaged over a 1-minute period, at 10m (33ft). The scale used by Regional Specialized Meteorological Centre (RSMC) New Delhi applies a 3-minute averaging period, and the Australian scale is based on both 3-second wind gusts and maximum sustained winds averaged over a 10-minute interval. These differences make direct comparisons between basins difficult.
Within all basins tropical cyclones are named when the sustained winds reach at least 35kn (40mph; 65km/h).
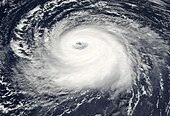
Tropical cyclones are defined as being warm cored, non-frontal synoptic cyclones, that develop over tropical or subtropical waters, with organized atmospheric convection and have a definite cyclonic surface wind circulation. They are classified by the wind speeds located around the circulation centre and are ranked, by the World Meteorological Organization's Regional Specialized Meteorological Centers on one of five tropical cyclone scales. The scale used for a particular tropical cyclone depends on what basin the system is located in; with for example the Saffir–Simpson hurricane wind scale and the Australian tropical cyclone intensity scales both used in the Western Hemisphere. All of the scales rank tropical cyclones using their maximum sustained winds, which are either observed, measured or estimated using various techniques, over a period between one and ten minutes.
Tropical cyclones that occur within the Northern Hemisphere to the east of the anti-meridian, are officially monitored by either the National Hurricane Center or the Central Pacific Hurricane Center.[1] Within the region a tropical cyclone is defined to be a warm cored, non-frontal synoptic disturbance, that develops over tropical or subtropical waters, with organized atmospheric convection and a closed well defined circulation centre.[1] The region also defines a subtropical cyclone as a non-frontal low pressure disturbance, that has the characteristics of both tropical and extratropical cyclones.[1] Once either of these classifications are met, then advisories are initiated and the warning centers will classify the system as either a tropical or subtropical depression, if the one-minute sustained winds estimated or measured as less than 34kn (39mph; 63km/h).[1]
Also, it will be assigned a tropical cyclone number (or TC number for short) comprising an officially spelled-out number (from ONE to THIRTY or less; these numbers are not recycled until next year) followed by (except for North Atlantic systems) a hyphen and a suffix letter ("-E" for East Pacific, "-C" for Central Pacific);[2]a two-digit (plus any suffix) abbreviation (like TD 08 for North Atlantic depression EIGHT, TD 21E for East Pacific depression TWENTYONE-E, or TD 03C for Central Pacific depression THREE-C) is also generated for bulletin and other automated purposes.[citation needed]
However, if a tropical disturbance is capable of producing tropical storm or hurricane conditions on land within 48 hours, then advisories will be initiated and it will be classified as a potential tropical cyclone (PTC)[1] with a two-digit PTC number (for example, PTC-09 or PTC-15E) that otherwise looks identical to a TC number. Should the system intensify further or already have one-minute sustained winds of 34–63kn (39–72mph; 63–117km/h), then it will be called either a tropical or subtropical storm and assigned a name[1] (which replaces the spelled-out TC number; the two-digit number is still kept for purposes like the Automated Tropical Cyclone Forecasting System, as in 2018's TS 12 (KIRK)).
Should the tropical system further intensify and have winds estimated or measured, as greater than 64kn (74mph; 119km/h), then it will be called a hurricane and classified on the Saffir–Simpson hurricane wind scale.[1] The lowest classification on the SSHWS is a Category 1 hurricane, which has winds of between 64 and 82kn (74 and 94mph; 119 and 152km/h).[1][3] Should the hurricane intensify further then it will be rated as a Category 2 hurricane, if it has winds of between 83 and 95kn (96 and 109mph; 154 and 176km/h).[1][3] When a system becomes a Category 3 hurricane with winds of between 96 and 112kn (110 and 129mph; 178 and 207km/h), it is considered to be a major hurricane by the warning centers.[3] A Category 4 hurricane has winds of 113 to 136kn (130 to 157mph; 209 to 252km/h), while a Category 5 hurricane has winds of at least 137kn (158mph; 254km/h).[1][3] A post tropical cyclone is a system that has weakened, into a remnant low or has dissipated and formal advisories are usually discontinued at this stage.[1] However, advisories may continue if the post tropical cyclone poses a significant threat to life and property.[1] They may also continue if the remnants of the system have a chance of regeneration and producing tropical storm or hurricane-force winds over land within 48hours.[1]
The SSHS was originally created using both wind speed and storm surge, but since the relationship between wind speed and storm surge is not necessarily definite, the scale was changed to the "Saffir–Simpson Hurricane Wind Scale" (SSHWS), based entirely on wind speed.[3][4]
Although increasing echelons of the scale correspond to stronger winds, the rankings are not absolute in terms of effects. Lower-category storms can inflict greater damage than higher-category storms, depending on factors such as local terrain, population density and total rainfall. For instance, a Category2 hurricane that strikes a major urban area will likely do more damage than a large Category5 hurricane that strikes a mostly rural region. In fact, tropical systems of less than hurricane strength, as in the case of Tropical Storm Allison, can produce significant damage and human casualties, especially from flooding and landslides.[5]
Historically, the term great hurricane was used to describe storms that possessed winds of at least 110 knots (130mph; 200km/h), large radii (over 160km / 100mi) and that caused large amounts of destruction. This term fell into disuse after the introduction of the Saffir–Simpson scale in the early 1970s.[6]
A minor change to the scale was made ahead of the 2012 hurricane season, with the wind speeds for Categories 3–5 tweaked to eliminate the rounding errors that had occurred during previous seasons, when a hurricane had wind speeds of 115kn (130mph; 215km/h).[7]
Tropical cyclones that occur within the Northern Hemisphere between the anti-meridian and 100°E are officially monitored by the Japan Meteorological Agency (JMA, RSMC Tokyo).[8] Within the region a tropical cyclone is defined to be a non-frontal synoptic scale cyclone originating over tropical or sub-tropical waters, with organized convection and a definite cyclonic surface wind circulation.[8] The lowest classification used by the Typhoon Committee is a tropical depression, which has 10-minute sustained winds of less than 34kn (17m/s; 39mph; 63km/h).[8] Should the tropical depression intensify further it is named and classified as a tropical storm, which has winds speeds between 34–47kn (17–24m/s; 39–54mph; 63–87km/h).[8] Should the system continue to intensify further then it will be classified as a severe tropical storm, which has winds speeds between 48–63kn (25–32m/s; 55–72mph; 89–117km/h).[8] The highest classification on the Typhoon Committee's scale is a typhoon, which has winds speeds greater than 64kn (33m/s; 74mph; 119km/h).[8]
The China Meteorological Administration, the Hong Kong Observatory (HKO), PAGASA and the JMA, all divide the typhoon category further for domestic purposes.[8] The JMA divides the typhoon category into three categories, with a 10-minute maximum wind speed below 84kn (43m/s; 97mph; 156km/h) assigned for the (strong) typhoon category. A very strong typhoon has wind speeds between 85–104kn (44–54m/s; 98–120mph; 157–193km/h), while a violent typhoon has wind speeds of 105kn (54m/s; 121mph; 194km/h) or greater.[8] The HKO and the CMA also divide the typhoon category into three categories, with both assigning a maximum wind speed of 80kn (41m/s; 92mph; 150km/h) to the typhoon category. A severe typhoon has wind speeds of 85–104kn (44–54m/s; 98–120mph; 157–193km/h), while a super typhoon has winds of 100kn (51m/s; 120mph; 190km/h).[8][9] In May 2015, PAGASA introduced the term Super Typhoon and used it for systems with winds greater than 120kn (62m/s; 140mph; 220km/h),[10] but later adjusted to at least 99.9kn (51.4m/s; 115.0mph; 185.0km/h) on March 23, 2022.[11][12][13][14][15]
In addition to the national meteorological services of each nation, the United States' Joint Typhoon Warning Center (JTWC) monitors the basin, and issues warnings on significant tropical cyclones for the United States Government,[16] assigning them two-digit TC numbers (with suffix "W").[2] These warnings use a 1-minute sustained wind speed and can be compared to the Saffir–Simpson hurricane wind scale; however, the JTWC uses their own scale for intensity classifications in this basin.[17] These classifications are Tropical Depression, Tropical Storm, Typhoon, and Super Typhoon.[17] The United States' Joint Typhoon Warning Center (JTWC) unofficially classifies typhoons with wind speeds of at least 130 knots (150mph; 240km/h)—the equivalent of a strong Category4 storm on the Saffir–Simpson scale—as super typhoons.[18] Also, when a tropical depression is upgraded to tropical storm and named by the JMA, the JTWC appends the international name (parenthesized) to its TC number[2] (i.e., 2018 tropical depression TWENTY-W, abbr. TD 20W, became Tropical Storm Bebinca, but was referred to as TS 20W (BEBINCA) in JTWC advisories); however, in cases when the JTWC upgrades a depression to tropical storm without the JMA following suit (due to the differences between JTWC and JMA wind-speed scales), the spelled-out number (without the suffix) is parenthesized and appended to the TC number as placeholder name, as in TS 16W (SIXTEEN), until JMA upgrades and names it, on which case the name replaces the placeholder.[17]
In addition, the Taiwan Central Weather Bureau has its own scale in Chinese but uses the Typhoon Committee scale in English.[19]
Any tropical cyclone that develops within the North Indian Ocean between 100°E and 45°E is monitored by the India Meteorological Department (IMD, RSMC New Delhi).[20] Within the region, a tropical cyclone is defined as being a non frontal synoptic scale cyclone that originates over tropical or subtropical waters with organized convection and a definite cyclonic surface wind circulation.[20] The lowest official classification used in the North Indian Ocean is a depression, which has 3-minute sustained wind speeds of between 17 and 27kn (20 and 31mph; 31 and 50km/h).[20] Should the depression intensify further then it will become a deep depression, which has winds between 28 and 33kn (32 and 38mph; 52 and 61km/h).[20] If the system intensifies further, it will be classified as a cyclonic storm and be assigned a name by the IMD, if it should develop gale-force wind speeds of between 34 and 47kn (39 and 54mph; 63 and 87km/h).[20] Severe cyclonic storms have wind speeds between 48 and 63kn (55 and 72mph; 89 and 117km/h), while very severe cyclonic storms have hurricane-force winds of 64–89kn (74–102mph; 119–165km/h). Extremely severe cyclonic storms have hurricane-force winds of 90–119kn (104–137mph; 167–220km/h).[20] The highest classification used in the North Indian Ocean is a super cyclonic storm, which has hurricane-force winds of at least 120kn (140mph; 220km/h).[20]
Historically, a system has been classified as a depression if its surface pressure is lower than its surroundings.[21] Other classifications historically used include: cyclonic storm where the winds did not exceed force 10 on the Beaufort scale and a Cyclone where the winds are either force 11 and 12 on the Beaufort scale.[21] Between 1924 and 1988, tropical cyclones were classified into four categories: depression, deep depression, cyclonic storms and severe cyclonic storms.[21] However, a change was made during 1988 to introduce the category "severe cyclonic storm with core of hurricane winds" for tropical cyclones, with wind speeds of more than 64kn (74mph; 119km/h).[21] During 1999 the categories very severe cyclonic Storm and super cyclonic storm were introduced, while the severe cyclonic storm with a core of hurricane winds category was eliminated.[21] During 2015, another modification to the scale took place, with the IMD calling a system with 3-minute maximum sustained wind speeds between 90 and 119kn (104 and 137mph; 167 and 220km/h): an extremely severe cyclonic storm.[22]
The American Joint Typhoon Warning Center also monitors the basin, and issues warnings on significant tropical cyclones on behalf of the United States,[16] also assigning them TC numbers as in all other basins above (albeit in an unofficial manner for this and subsequent basins; cyclones originating in the Arabian Sea are assigned suffix "A" while those in the Bay of Bengal get suffix "B"). These warnings use a 1-minute sustained wind speed and can be compared to the Saffir–Simpson hurricane wind scale, however, regardless of intensity in this basin the JTWC labels all systems as tropical cyclones with TC numbers (optionally appended with international names or placeholders in parentheses, as done for typhoons above).[17]
Any tropical cyclone that develops within the Southern Hemisphere between Africa and 90°E is monitored by Météo-France's La Réunion tropical cyclone centre (MFR, RSMC La Réunion).[23]
A tropical disturbance is MFR's generic term for a non-frontal area of low pressure that has organized convection and definite cyclonic surface wind circulation. The system should be estimated to have wind speeds of less than 28 knots (52km/h; 32mph).[23]
A system is designated as a tropical depression or a subtropical depression when it reaches wind speeds above 28 knots (52km/h; 32mph). If a tropical depression reaches wind speeds of 35 knots (65km/h; 40mph) then it will be classified as a moderate tropical storm and assigned a name by either the Sub Regional Center in Mauritius or Madagascar. No matter how strong a subtropical system is in this basin, it is always designated as a subtropical depression.[24]
If the named storm intensifies further and reaches winds speeds of 48 knots (89km/h; 55mph), then it will be classified as a severe tropical storm. A severe tropical storm is designated as a tropical cyclone when it reaches wind speeds of 64 knots (119km/h; 74mph). If a tropical cyclone intensify further and reaches wind speeds of 90 knots (170km/h; 100mph), it will be classified as an intense tropical cyclone. A very intense tropical cyclone is the highest category on the South-West Indian Ocean Tropical Cyclone scale, and has winds of over 115 knots (213km/h; 132mph).[23][24]
At the tenth RA I tropical cyclone committee held during 1991, it was recommended that the intensity classifications be changed ahead of the 1993–94 tropical cyclone season. Specifically it was decided that the classifications: Weak Tropical Depression, Moderate Tropical Depression and Severe Tropical Depression would be changed to Tropical Depression, Moderate Tropical Storm and Severe Tropical Storm. This change was implemented ahead of the 1993–94 tropical cyclone season.[25]
The United States Joint Typhoon Warning Center also monitors the basin, and issues warnings on significant tropical cyclones on behalf of the United States Government;[16] these systems are unofficially assigned TC numbers with suffix "S" (which spans the whole South Indian Ocean, including both BMKG and BoM areas of responsibility west of 135°E). These warnings use a 1-minute sustained wind speed and can be compared to the Saffir–Simpson hurricane wind scale, however, regardless of intensity in this basin the JTWC labels all systems as tropical cyclones with TC numbers (plus any parenthesized names or placeholders, like typhoons and North Indian Ocean cyclones above).[17]
Australia and Fiji
Australian tropical cyclone intensity scale
Category
Sustained winds
Gusts
Five
>107kn (198km/h; 123mph)
>151kn (280km/h; 174mph)
Four
86–107kn (159–198km/h; 99–123mph)
122–151kn (226–280km/h; 140–174mph)
Three
64–85kn (119–157km/h; 74–98mph)
90–121kn (167–224km/h; 104–139mph)
Two
48–63kn (89–117km/h; 55–72mph)
68–89kn (126–165km/h; 78–102mph)
One
34–47kn (63–87km/h; 39–54mph)
49–67kn (91–124km/h; 56–77mph)
Tropical cyclones that occur within the Southern Hemisphere to the east of 90°E are officially monitored by one or more tropical cyclone warning centres.[26] These are run by the Fiji Meteorological Service, New Zealand's MetService, Indonesia's Badan Meteorologi, Klimatologi, dan Geofisika, Papua New Guinea's National Weather Service and the Australian Bureau of Meteorology.[26] Within the region a tropical cyclone is defined as being a non-frontal low-pressure system of synoptic scale that develops over warm waters, with a definite organized wind circulation and 10-minute sustained wind speeds of 34kn (63km/h; 39mph) or greater near the centre.[26] Once this definition has been met then all of the centres name the system and start to use the Australian tropical cyclone intensity scale, which measures tropical cyclones using a five category system based on 10-minute maximum sustained winds.[26][27] A Category 1 tropical cyclone is estimated to have 10-minute sustained wind speeds of 34–47kn (39–54mph; 63–87km/h), while a Category 2 tropical cyclone is estimated to have 10-minute sustained wind speeds of 48–63kn (55–72mph; 89–117km/h).[27][28] When a system becomes a Category 3 tropical cyclone it is reclassified as a Severe tropical cyclone and has wind speeds of 64–85kn (74–98mph; 119–157km/h).[27][28] A Category 4 severe tropical cyclone has winds of 86–110kn (99–127mph; 159–204km/h), while the maximum rating is a Category 5 severe tropical cyclone, which has winds of at least 108kn (124mph; 200km/h).[27][28]
For systems below tropical cyclone strength there are various terms used, including Tropical Disturbance, Tropical Low and Tropical Depression.[26] A tropical disturbance is defined as being a non-frontal system of synoptic scale originating over the tropics, with persistent enhanced convection or some indication of a circulation.[26] A tropical depression or tropical low is a disturbance with a defined circulation, where the central position can be estimated, and the maximum 10-minute average wind speed is less than 34kn (39mph; 63km/h) near the centre.[26] The FMS numbers these systems when they have a potential to develop into a tropical cyclone or persist to cause significant impact to life and property, within its area of responsibility and have been analysed for the previous 24 hours.[26] The Australian tropical cyclone intensity scale was introduced by the BoM, ahead of the 1989–90 cyclone season.
The United States Joint Typhoon Warning Center also monitors the basin, and issues warnings on significant tropical cyclones on behalf of the United States Government;[16] these systems are unofficially assigned TC numbers with either suffix "S" (if originating west of 135°E; spans the whole South Indian Ocean, including MFR's area of responsibility) or suffix "P" (if east of 135°E; spans the whole South Pacific Ocean, merging BoM, PNG-NWS, FMS, and MSNZ AORs together). These warnings use a 1-minute sustained wind speed and can be compared to the Saffir–Simpson hurricane wind scale, however, regardless of intensity in these basins the JTWC labels all systems as tropical cyclones with TC numbers (plus any names or placeholders parenthesized, as for typhoons and Indian Ocean cyclones above).[17]
Accumulated cyclone energy (ACE) is used by the National Oceanic and Atmospheric Administration and other agencies to express the activity of individual tropical cyclones that are above tropical storm strength and entire tropical cyclone seasons.[30] It is calculated by taking the squares of the estimated maximum sustained velocity of every active tropical storm (wind speed 35 knots or higher) at six-hour intervals.[30] The numbers are usually divided by 10,000 to make them more manageable. The unit of ACE is 104 kn2, and for use as an index the unit is assumed.[30] As well as being squared for ACE, wind speed can also be cubed, which is referred to as the Power Dissipation Index (PDI).[31]
The Hurricane Severity Index (HSI) is another scale used and rates the severity of all types of tropical and subtropical cyclones based on both the intensity and the size of their wind fields.[32] The HSI is a 0 to 50 point scale, allotting up to 25 points for a tropical cyclone's intensity and up to 25 points for wind field size.[32] Points are awarded on a sliding scale, with the majority of points reserved for hurricane force and greater wind fields.[32]
The Saffir–Simpson hurricane wind scale (SSHWS) classifies hurricanes—which in the Western Hemisphere are tropical cyclones that exceed the intensities of tropical depressions and tropical storms—into five categories distinguished by the intensities of their sustained winds. This measuring system was formerly known as the Saffir–Simpson hurricane scale, or SSHS.
Tropical cyclones and subtropical cyclones are named by various warning centers to simplify communication between forecasters and the general public regarding forecasts, watches and warnings. The names are intended to reduce confusion in the event of concurrent storms in the same basin. Once storms develop sustained wind speeds of more than 33 knots, names are generally assigned to them from predetermined lists, depending on the basin in which they originate. Some tropical depressions are named in the Western Pacific, while tropical cyclones must contain a significant amount of gale-force winds before they are named in the Southern Hemisphere.
The 2006 Pacific typhoon season was a near-average season which produced a total of 23 named storms, 15 typhoons, and six super typhoons. The season ran throughout 2006, though most tropical cyclones typically develop between May and October. The season's first named storm, Chanchu, developed on May 9, while the season's last named storm, Trami, dissipated on December 20.
The 1992 Pacific typhoon season is the fourth consecutive above-average season, producing 31 tropical storms, 16 typhoons and five super typhoons. It had no official bounds; it ran year-round in 1992. Despite this, most tropical cyclones tend to form in the northwestern Pacific Ocean between May and November. These dates conventionally delimit the period of each year when most tropical cyclones form in the northwestern Pacific Ocean.
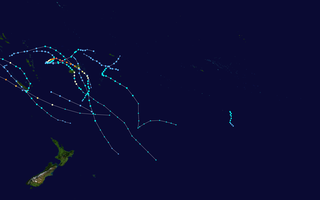
The 1996–97 South Pacific cyclone season was one of the most active and longest South Pacific tropical cyclone seasons on record, with 12 tropical cyclones occurring within the South Pacific basin between 160°E and 120°W. The season officially ran from November 1, 1996 - April 30, 1997, however, the season ended later than normal with three systems monitored after the official end of the season. The strongest tropical cyclone of the season was Cyclone Gavin which had a minimum pressure of 925 hPa (27.32 inHg). After the season had ended 4 tropical cyclone names were retired from the naming lists, after the cyclones had caused significant impacts to South Pacific islands.
During 2010, tropical cyclones formed within seven different tropical cyclone basins, located within various parts of the Atlantic, Pacific and Indian Oceans. During the year, a total of 111 tropical cyclones developed, with 64 of them being named by either a Regional Specialized Meteorological Center (RSMC) or a Tropical Cyclone Warning Center (TCWC). The most active basin was the North Atlantic, which documented 19 named systems, while the North Indian Ocean, despite only amounting to five named systems, was its basin's most active since 1998. Conversely, both the West Pacific typhoon and East Pacific hurricane seasons experienced the fewest cyclones reaching tropical storm intensity in recorded history, numbering 14 and 8, respectively. Activity across the southern hemisphere's three basins—South-West Indian, Australian, and South Pacific—was spread evenly, with each region recording 7 named storms apiece. The southern hemisphere's strongest tropical cyclone was Cyclone Edzani, which bottomed out with a barometric pressure of 910 mbar in the South-West Indian Ocean. Nineteen Category 3 tropical cyclones formed, including four Category 5 tropical cyclones in the year. The accumulated cyclone energy (ACE) index for the 2010, as calculated by Colorado State University was 573.8 units.
Throughout 2006, 133 tropical cyclones formed in seven bodies of water known as tropical cyclone basins. Of these, 80 have been named, including two tropical cyclones in the South Atlantic Ocean, and a tropical cyclone in the Mediterranean Sea, by various weather agencies when they attained maximum sustained winds of 65 km/h (40 mph). The strongest storms of the year were Typhoon Yagi in the Western Pacific, and Cyclone Glenda of the Australian region. The deadliest and costliest storms of the year were a series of five typhoons that struck the Philippines and China; Chanchu, Bilis, Saomai, Xangsane, and Durian, with most of the damage being caused by Durian of November. So far, 27 Category 3 tropical cyclones formed, including five Category 5 tropical cyclones in the year. The accumulated cyclone energy (ACE) index for the 2006, as calculated by Colorado State University was 761 units.
The following is a glossary of tropical cyclone terms.
The 1984–85 South Pacific cyclone season was an above-average tropical cyclone season, with nine tropical cyclones occurring within the basin between 160°E and 120°W. The season ran from November 1, 1984, to April 30, 1985, with tropical cyclones officially monitored by the Fiji Meteorological Service (FMS), Australian Bureau of Meteorology (BoM) and New Zealand's MetService. The United States Joint Typhoon Warning Center (JTWC) and other national meteorological services including Météo-France and NOAA also monitored the basin during the season. During the season there was nine tropical cyclones occurring within the basin, including three that moved into the basin from the Australian region. The BoM, MetService and RSMC Nadi all estimated sustained wind speeds over a period of 10-minutes, which are subsequently compared to the Australian tropical cyclone intensity scale, while the JTWC estimated sustained winds over a 1-minute period, which are subsequently compared to the Saffir–Simpson hurricane wind scale (SSHWS).
The 2020–21 South Pacific cyclone season was an average season where most tropical cyclones formed within the South Pacific Ocean to the east of 160°E. The season officially started on November 1, 2020, and officially ended on April 30, 2021, however a tropical cyclone could form at any time between July 1, 2020, and June 30, 2021, and would count towards the season total. During the season, tropical cyclones will be officially monitored by the Fiji Meteorological Service (FMS), Australian Bureau of Meteorology (BoM), New Zealand's MetService. The United States Armed Forces through the Joint Typhoon Warning Center (JTWC) will also monitor the basin and issue unofficial warnings for American interests. RSMC Nadi attaches a number and an F suffix to tropical disturbances that form in or move into the basin while the JTWC designates significant tropical cyclones with a number and a P suffix. RSMC Nadi, TCWC Wellington and TCWC Brisbane all use the Australian Tropical Cyclone Intensity Scale and estimate windspeeds over a period of ten minutes, while the JTWC estimated sustained winds over a 1-minute period, which are subsequently compared to the Saffir–Simpson hurricane wind scale (SSHWS).
Most of the tropical cyclones of the 2013 Pacific typhoon season formed between May and November of that year. The scope of this article is the Pacific Ocean north of the equator, between 100°E and the International Date Line. Tropical storms which form in the Western Pacific basin are assigned a name by the Japan Meteorological Agency (JMA). Tropical depressions forming in this basin are given a number with a "W" suffix by the United States' Joint Typhoon Warning Center (JTWC). The Philippine Atmospheric, Geophysical and Astronomical Services Administration (PAGASA) assigns names to tropical cyclones that enter or form in the Philippine area of responsibility, but these names are not in common use outside the Philippines.
This timeline documents all of the events of the 2014 Pacific typhoon season. Most of the tropical cyclones forming between May and November. The scope of this article is limited to the Pacific Ocean, north of the equator between 100°E and the International Date Line. Tropical storms that form in the entire Western Pacific basin are assigned a name by the Japan Meteorological Agency. Tropical depressions that form in this basin are given a number with a "W" suffix by the United States' Joint Typhoon Warning Center. In addition, the Philippine Atmospheric, Geophysical and Astronomical Services Administration (PAGASA) assigns names to tropical cyclones that enter or form in the Philippine area of responsibility. These names, however, are not in common use outside of the Philippines.
Severe Tropical Storm Zelda was the last tropical cyclone of the 1991 Pacific typhoon season; it struck the Marshall Islands on November 28. The area of low pressure that eventually became Zelda formed near the International Date Line, and strengthened into a tropical depression on November 27. The Joint Typhoon Warning Center (JTWC) reported that the depression had reached tropical storm intensity near the Marshall Islands on November 28, thus naming it Zelda. On November 29, the storm quickly strengthened to 65 knots according to the JTWC, equivalent to a Category 1 typhoon on the Saffir–Simpson hurricane wind scale. It reached a peak of 80 kn according to the JTWC, and 60 kn according to the Japanese Meteorological Agency (JMA), with a barometric pressure of 975 hectopascals (28.8 inHg). Zelda weakened into a tropical storm on December 2, and then a tropical depression two days later. The JTWC discontinued warnings late on December 4, while the JMA declared the storm to be extratropical the next day and continued to track until it crossed the International Date Line again on December 7.
Typhoon Kim, known in the Philippines as Typhoon Osang, was the second typhoon in a week to directly affect the Philippines during July 1980. Like Typhoon Joe, Kim formed from the near equatorial monsoon trough in the northwestern Pacific Ocean on July 19. The disturbance tracked quickly westward-northwest underneath a subtropical ridge, reaching tropical storm strength on the July 21 and typhoon strength on July 23. After developing an eye, Kim began to rapidly intensify, and during the afternoon of July 24, peaked in intensity as a super typhoon. Several hours later, Kim made landfall over the Philippines, but the storm had weakened considerably by this time. Throughout the Philippines, 40 people were killed, 2 via drownings, and 19,000 others were directly affected. A total of 12,000 homes were destroyed and 5,000 villages were flooded. Less than a week earlier, the same areas were affected by Joe; however, Kim was considered the more damaging of the two typhoons. Land interaction took its toll on Kim, and upon entering the South China Sea, the storm was down below typhoon intensity. Kim continued northwestward but its disrupted circulation prevented re-intensification, and it remained a tropical storm until hitting southern China July 27 to the northeast of Hong Kong, where only slight damage was reported. Later that day, Kim dissipated.
The Tropical Cyclone Wind Signals are tropical cyclone alert levels issued by the Philippine Atmospheric, Geophysical, and Astronomical Services Administration (PAGASA) to areas within the Philippines that may be affected by tropical cyclone winds and their associated hazards.
1 2 3 National Hurricane Operations Plan(PDF) (Report). Office of the Federal Coordinator for Meteorological Services and Supporting Research. May 2017. Retrieved October 14, 2018.
This page is based on this Wikipedia article Text is available under the CC BY-SA 4.0 license; additional terms may apply. Images, videos and audio are available under their respective licenses.